Performance review challenges with Jira
Typical performance review process using standard Jira functionalities might turn to be a tricky task. Usually, common sense objectives related to quality, delivery, estimation accuracy, require multi step actions from the manager and the direct report. This process includes creating number of saved filters within Jira and extracting the data in other tools for further calculations (e.g., XLS) whenever there is need of review or interim check on the progress against the goal. Because of the Administration overhead, such approach is not feasible to be executed on regular bases and that’s why in most cases performance results get reviewed at the end of the evaluation period and with pretty good potential to surprise all parties and downplay the purpose of the whole process.
Built-in Jira capabilities
There is good built in Jira reporting functionality including: Burndown Chart, Burnup Chart, Sprint Report, Control Chart, Cumulative Flow Diagram, Epic Report, Epic Burndown, Release Burndown, Velocity Chart, Version Report, and it is sufficient to track your work in progress (WIP), but it is not well suited for performance reviews, although some of the reports can be adopted for that purpose, like Velocity Chart. In addition, there is an option for aggregation of certain metrics like “Work log”, “Time Spent” and “Original Estimate” within few Jira standard dashboard widgets like the Pie charts, but it does not support custom metrics (e.g., Story Points) and is not good enough to track KPIs progress and evaluate results against target afterwards.
Improving review process
Performance Objectives: Charts for Jira add-on is developed to improve review process and includes gadgets that allow you to setup dashboard with more than 10 KPIs in minutes, without further customization of your Jira. Of course, if you are open to exploring new metrics, you can learn how to configure them under Design new Jira metrics and come up with metrics aligned exactly to your workflows and business processes that each team follows.
In addition, you may leverage metrics and dimensions coming from other plugins that are already installed on your system.

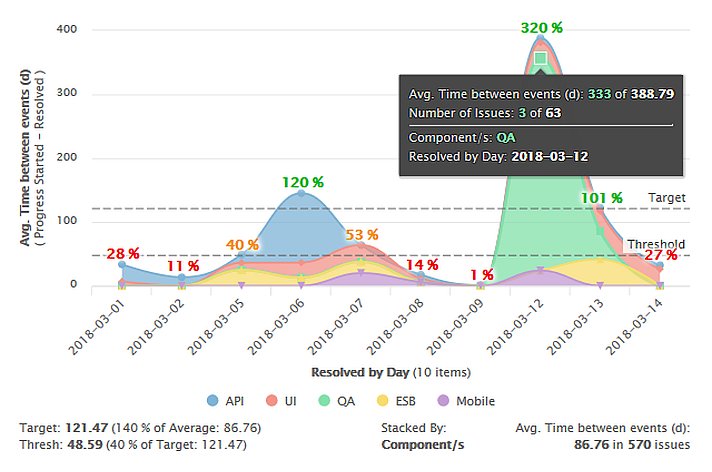
The dashboard will be a big step forward to bring transparency in individual and team performance review and decrease burned in bureaucracy time. It will reward performers, build trust in fairness in the process and raise early awareness of the bottlenecks within your team. The Add-on widget itself adds advanced navigation capabilities that allow you to explore particular results beaked down by several dimension and easily justify results and validate data accuracy that felled in scope. It helps with creation of metrics and compare data sets based on improvement, compared to previous period, % of total, % of average, avg. time between events. Powerful features that help creating “specific, measurable, attainable, relevant, time-bound” i.e., SMART objectives.
Takeaways
It is hard to pick and agree on the right KPIs, turn perception of the performance review process to something fair, objective, something that truly helps building trust and transparency within the team. It is an ongoing challenge that managers looking for happy, honest and productive teams face with each evaluation, and with the help of Jira flexible workflows, Performance Objectives add-on and manager’s persistence it is achievable to great extend within any organization.
Start your 30 days free trial of Performance Objectives: Charts for Jira from Atlassian Marketplace.