Among various KPI reporting options, Performance Objectives: Charts for Jira app enables you to establish individual targets calculated as a percentage of the total Story Points achieved by the entire team across multiple Sprints within your project. This empowers you to establish performance standards that recognize and reward high achievers within the team, all the while enabling them to track their progress in real time throughout the evaluation period.
Frequently, the last assignee on a ticket might be responsible for reviewing the issue, rather than the person who initially worked on it. This highlights the importance of refining the report to accurately attribute the “ownership” of the issue – typically, the developer.
To achieve this, you have two options: employ JQL data segmentation or create custom fields (e.g., ‘Developed by’) and use them for Display by. In this article, we will demonstrate how to leverage JQL queries for identifying transitions between statuses done by specific users (e.g., status CHANGED FROM ‘In Progress’ TO ‘Resolved’ BY linda.jones or resolution CHANGED TO ‘Completed’ BY linda.jones).”
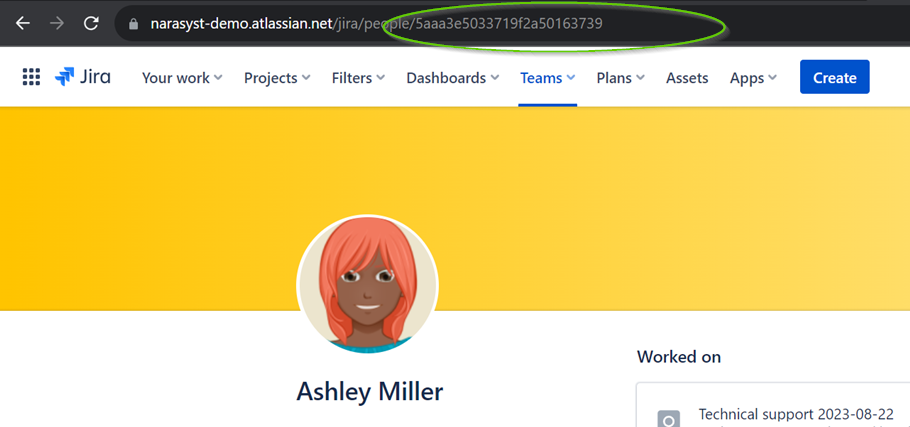
Important Note: Presently, Jira’s JQL “By” predicament does not display names, necessitating the use of user’ Account IDs instead. To obtain the Account ID of your team members, simply access their user profile and find the Account ID within the URL of the page. The URL will typically resemble this format:
https://****.atlassian.net/people/5aaa3e5033719f2a50163739, where ‘5aaa3e5033719f2a50163739’ is the Account ID (without quotes).
For more information on this topic, you can refer to Atlassian developer’s blog.
Crafting an Effective % of Total Story Points KPI Report
Incorporating the % of Total Story Points KPI Report into your Jira dashboard enhances performance management, teamwork, and organizational progress. Key benefits include precise measurement of individual performance, increased accountability, and recognition for those consistently exceeding their targets. The Performance Objectives app allows team members to track their progress in real time, fostering ownership and continuous improvement.
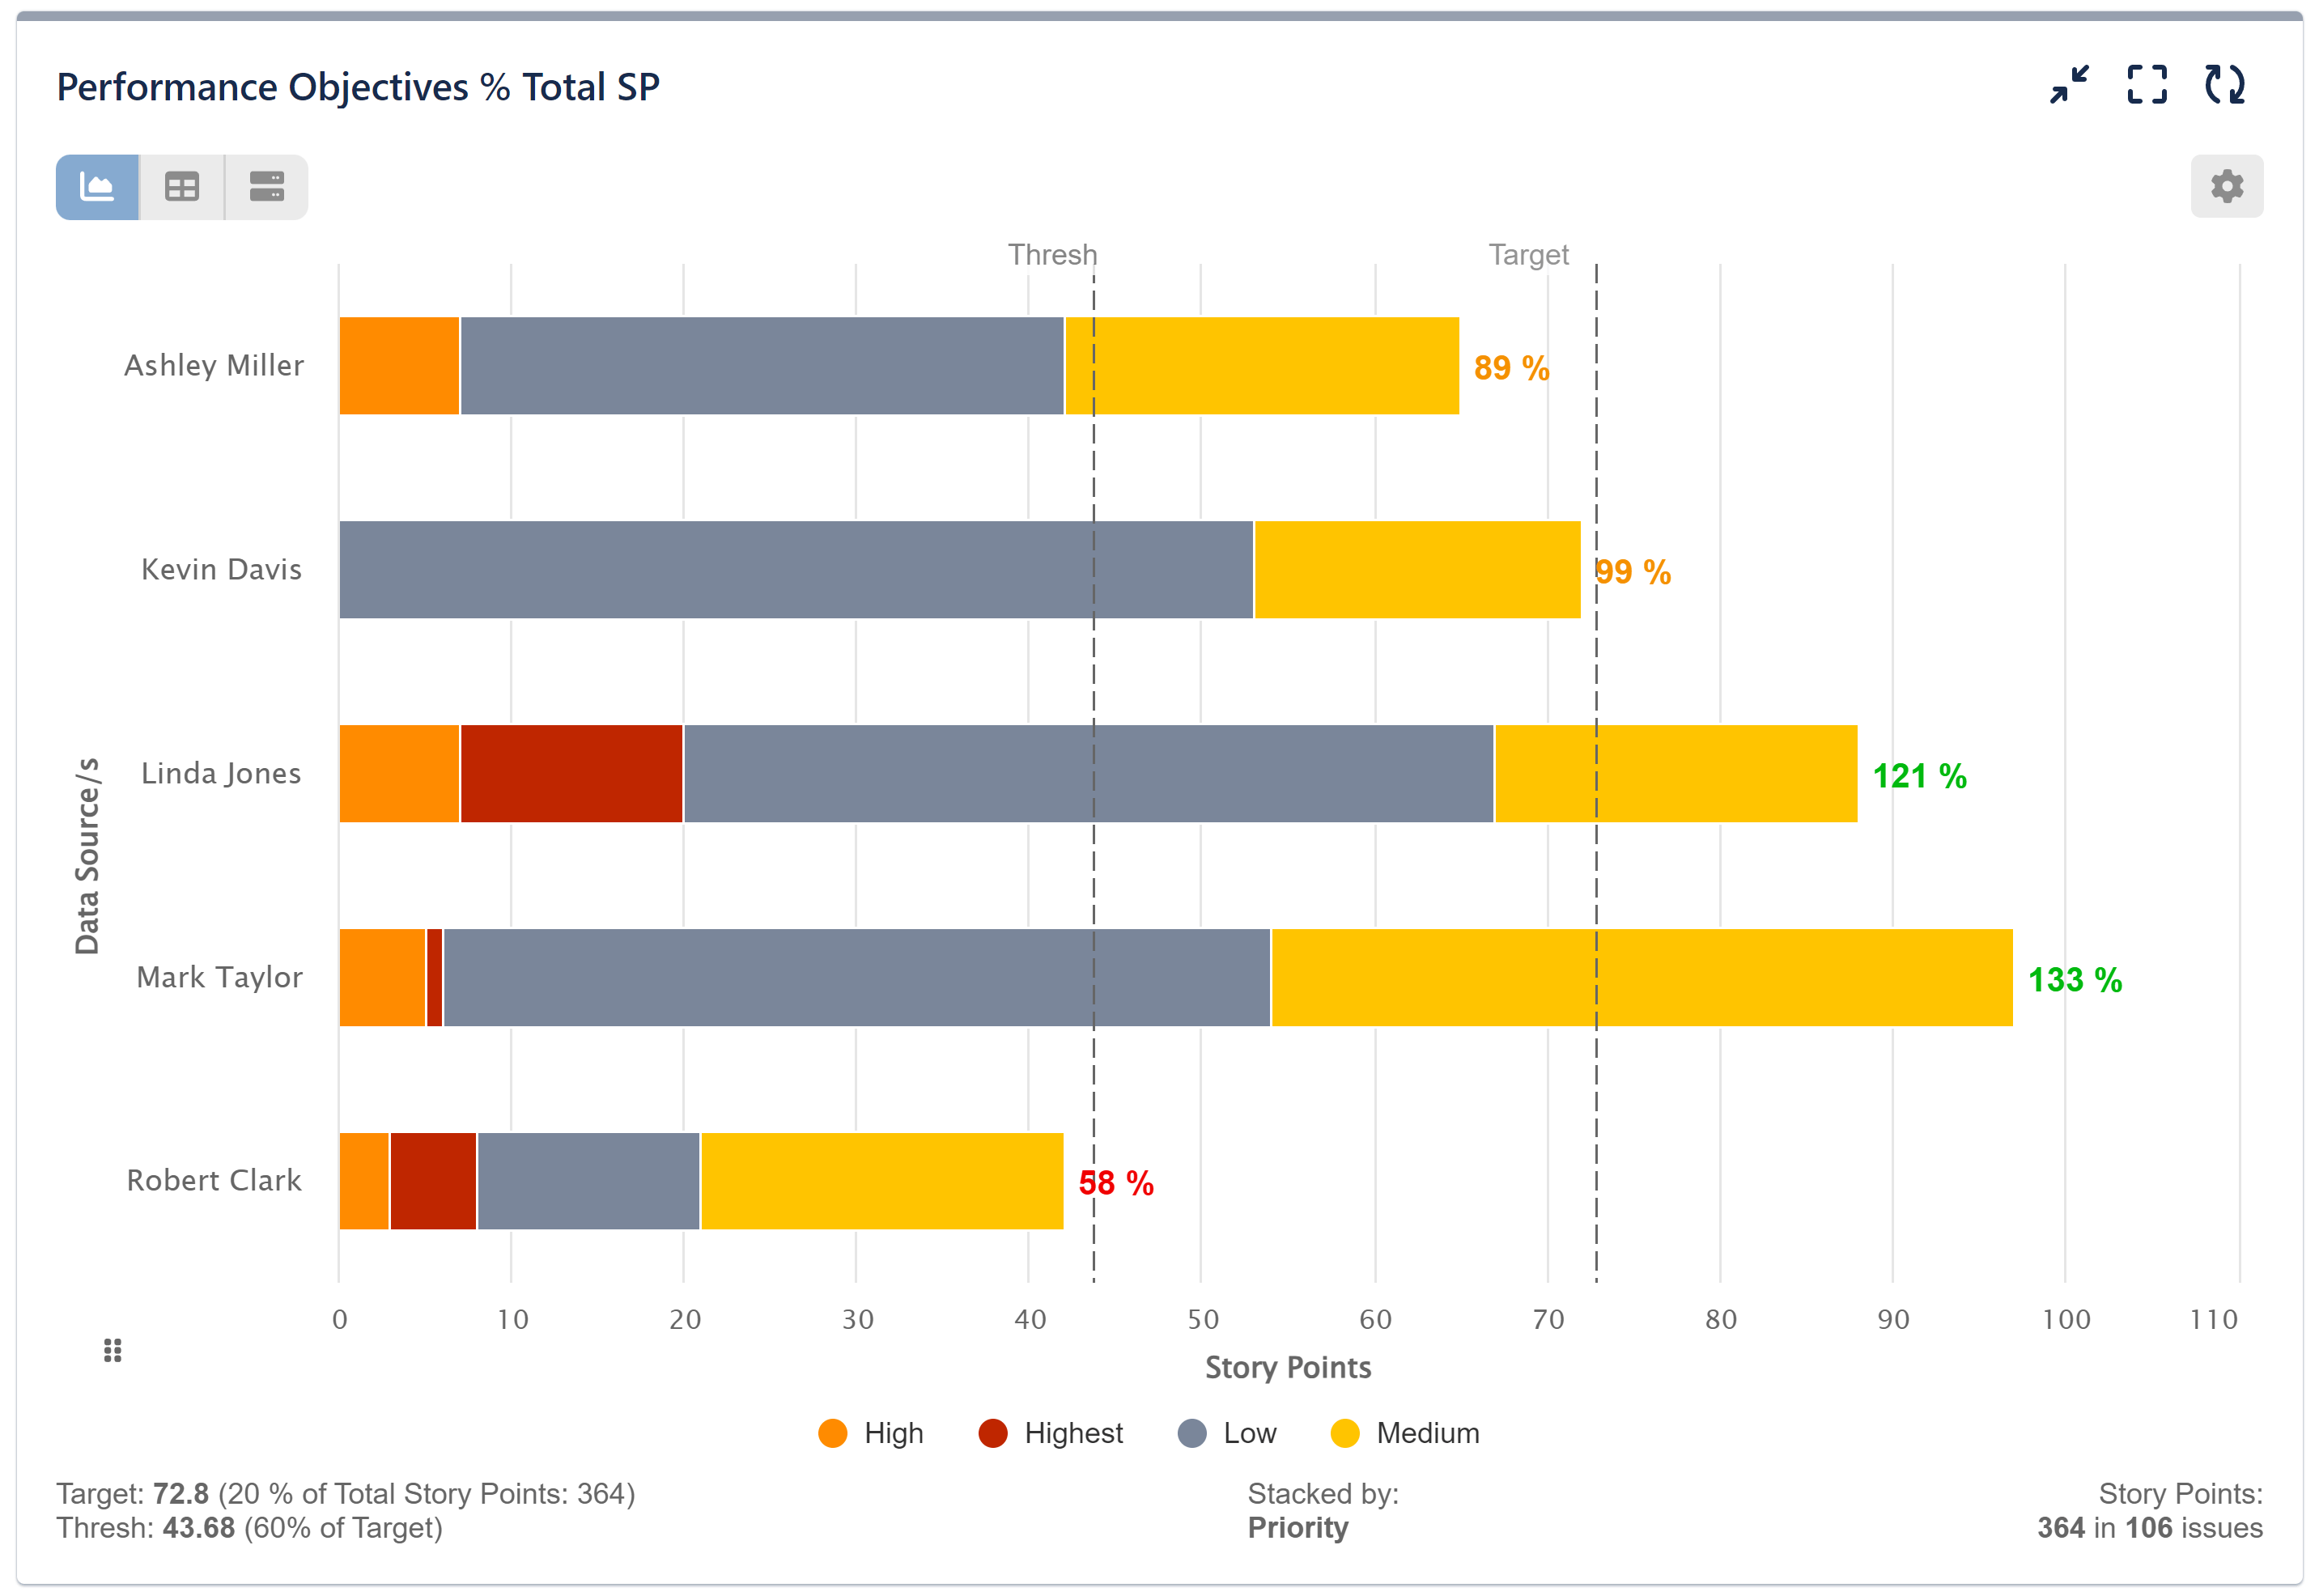
Follow this step-by-step instructions to creating % of Total Story Points KPI report using the Performance Objectives dashboard gadget in Jira:
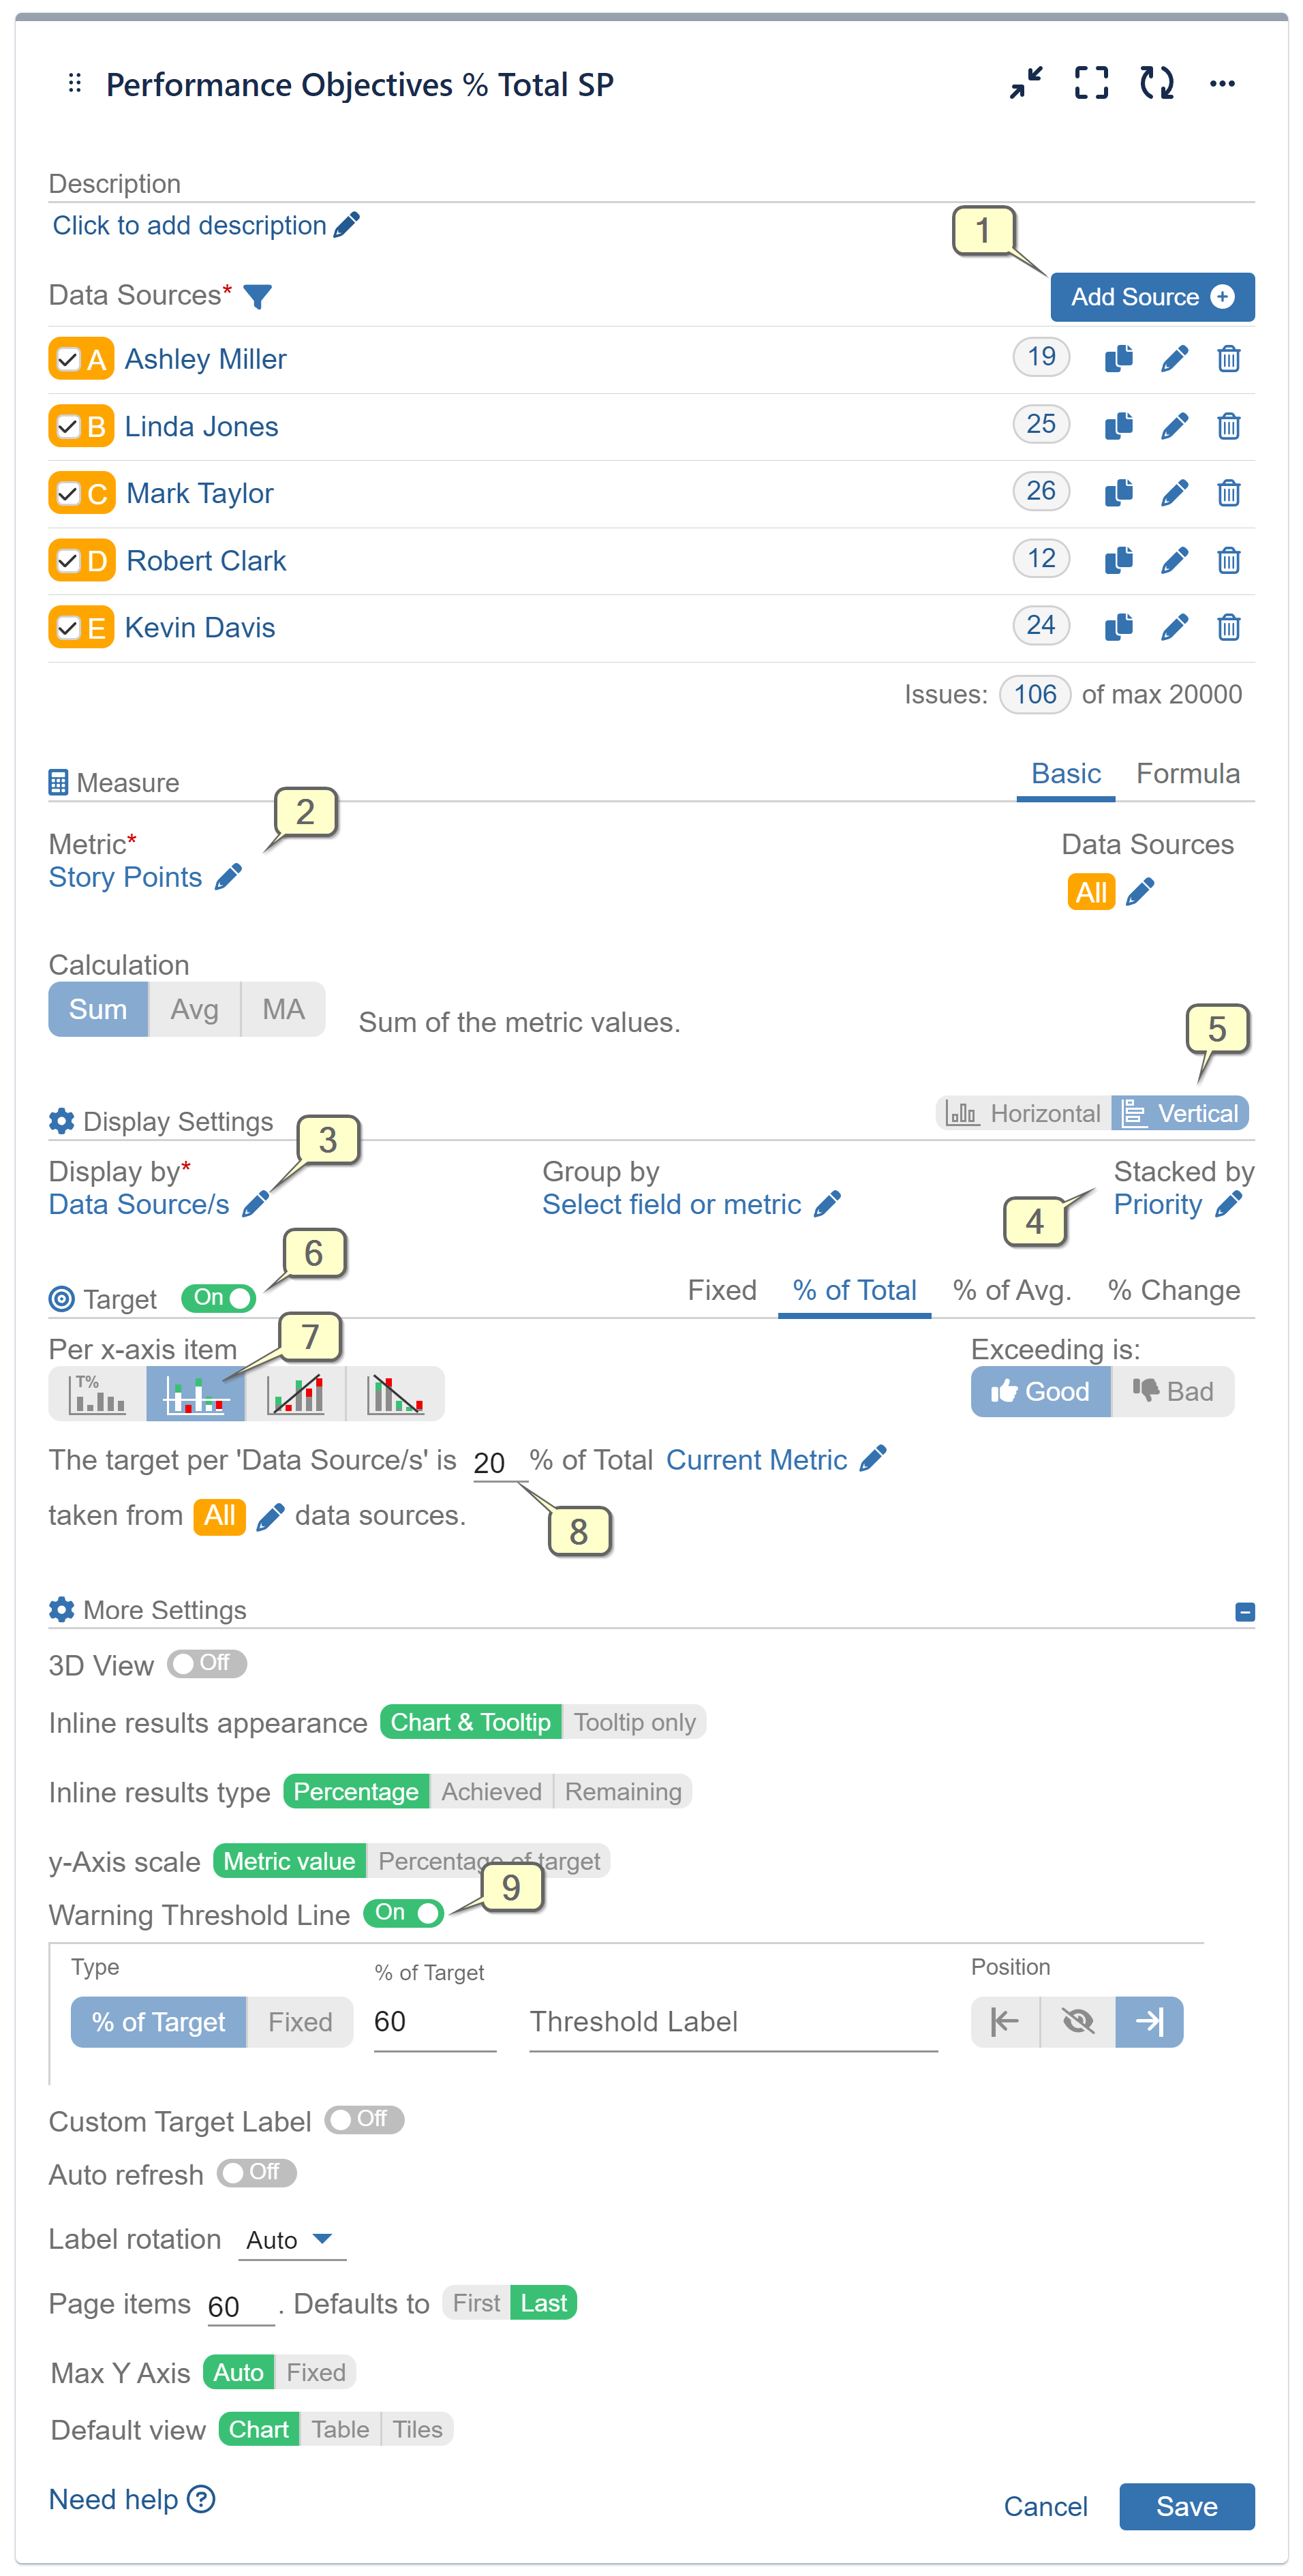
Step 1: Configure multiple Data Sources, each filtering issues for specific team member on the project.
Step 2: Choose the ‘Story Points’ Jira field as the metric.
Step 3: Display by Data Sources.
Step 4: (Optional) Choose “Priority” or “Components” for the Stacked by display option.
Step 5: Enable vertical mode for a more condensed x-axis presentation.
Step 6: Activate the Target section and navigate to the ‘% of Total’ tab.
Step 7: Select the Target results to be evaluated per x-axis item (i.e., the user field from the ‘Display by’ setting).
Step 8: Define the target value. For instance, in our example scenario, this would be 20% of the total Story Points achieved over the last 6 sprints.
Step 9: (Optional) Additionally, you can enhance your chart by incorporating a warning threshold (set here to 60% of the target). Determine its positioning on the chart to ensure clear comprehension. You’ll find more ways to tweak your results under “More Settings”.
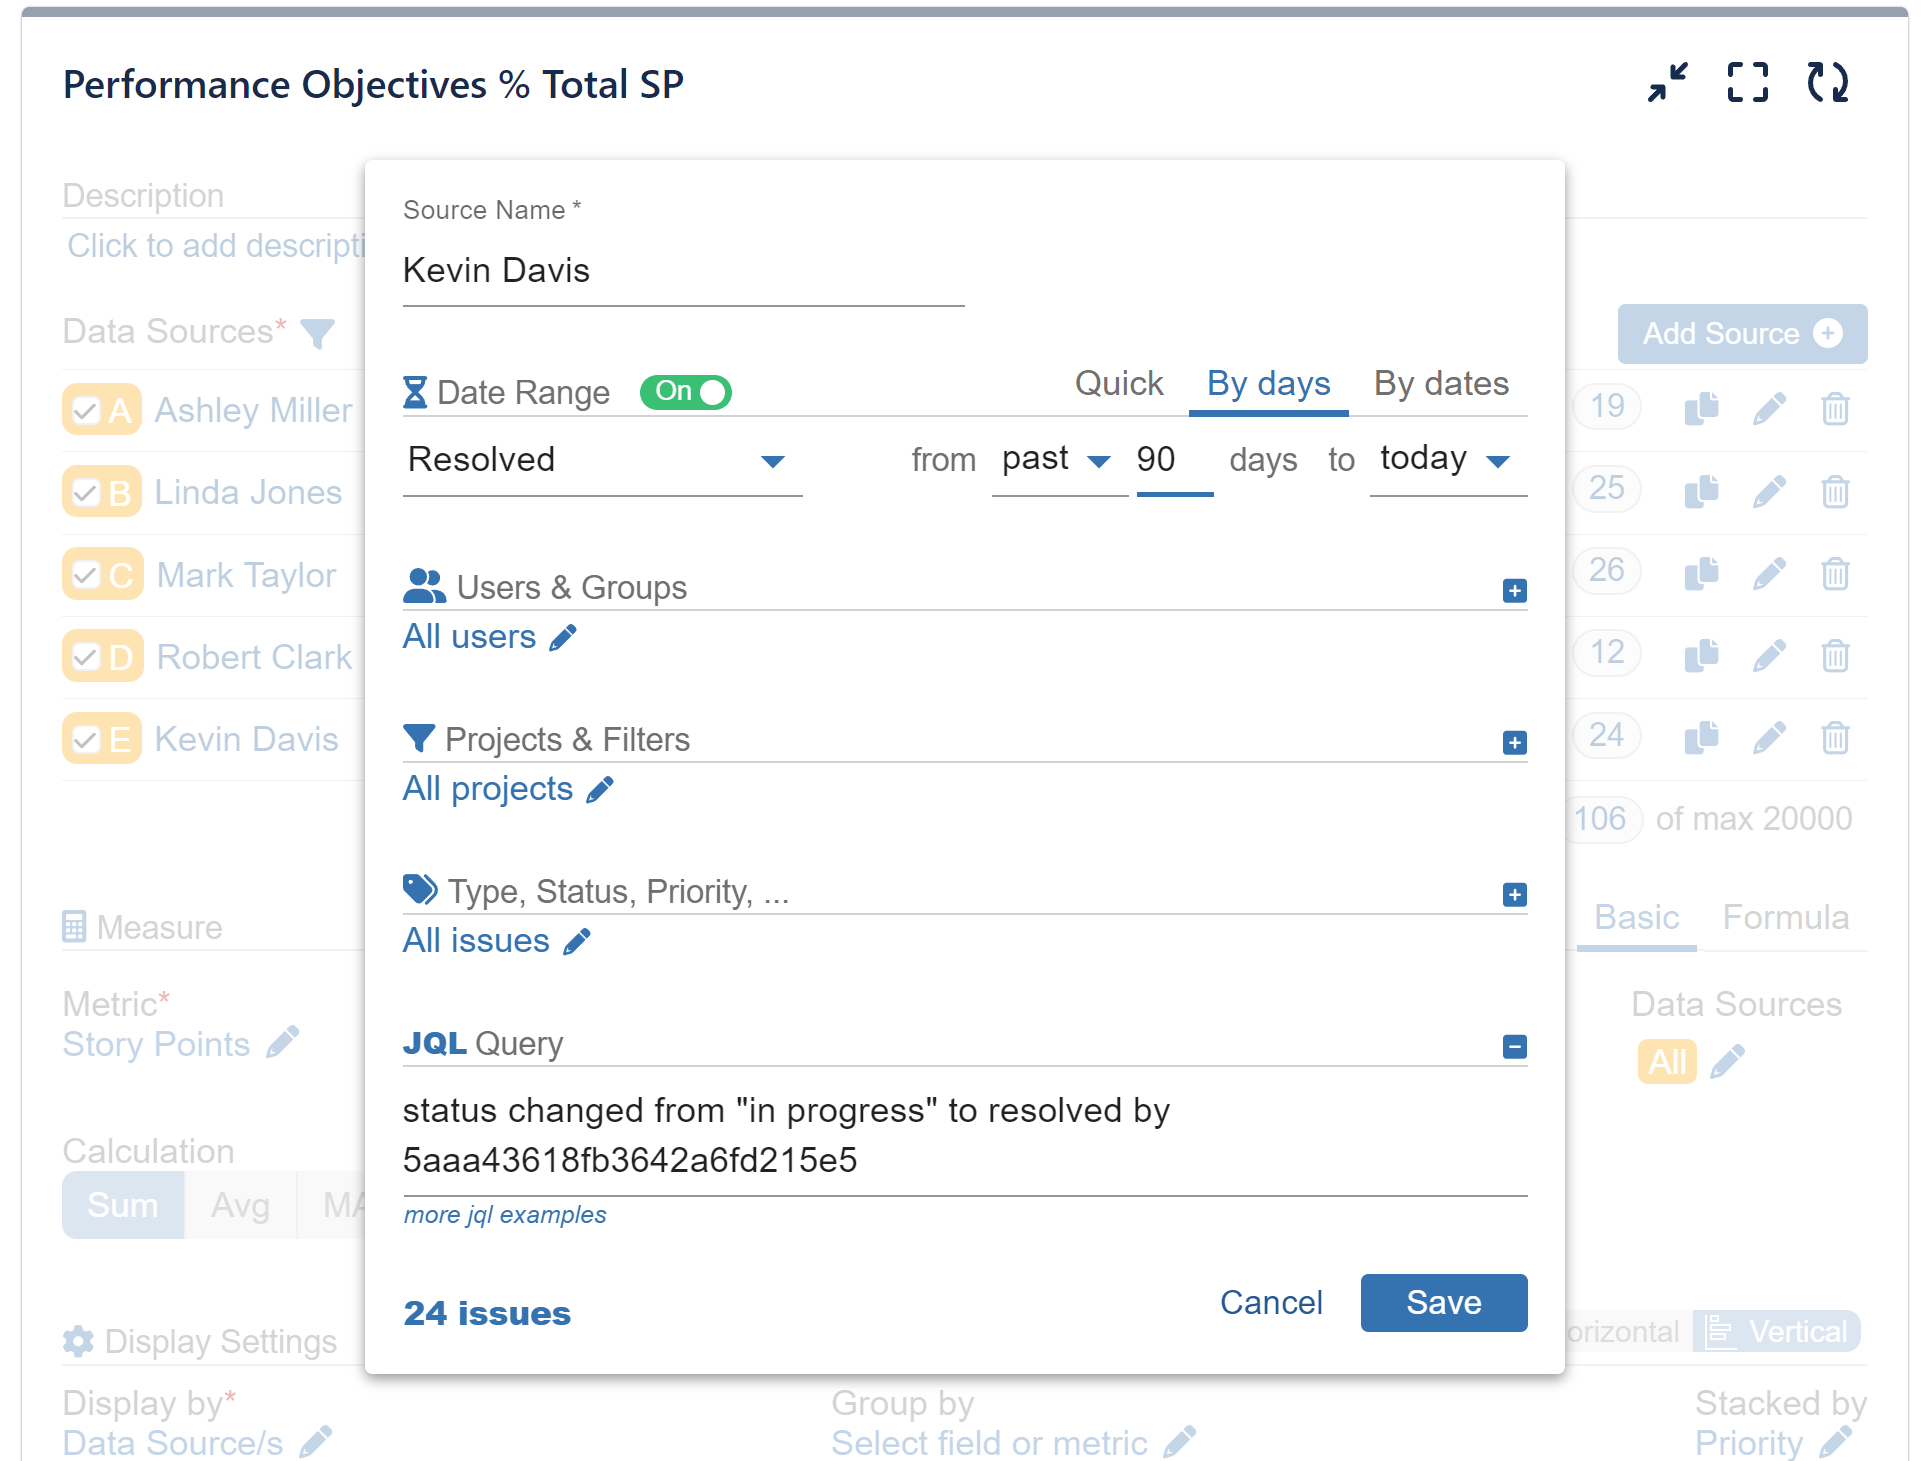
Additional instructions for Step 1:
Here’s an example of a sample JQL query for this scenario. Please be aware that directly using this query may not yield the expected results if your workflow differs from the example provided. It is advisable to create your own JQL query tailored to match your specific workflow. Afterward, repeat it in each separate data source, ensuring to modify only the user Account ID to filter data for the particular team member.
Check out this configuration video that will walk you through the entire process:
Using the Performance Objectives: Charts for Jira app, you have the ability to create a dedicated “KPI Dashboard” directly on your Jira dashboard. This dashboard can include a set of reports focused on your objectives, all aimed at reinforcing your SMART goals. Our support team is prepared to assist you.
For additional use cases take a look at the KPI Examples page.
Start your 30 days free trial of Performance Objectives: Charts for Jira from Atlassian Marketplace.