Table of Contents
Monitoring Bounce Back Issues in Jira: Why It Matters
Monitoring bounce back issues in Jira is crucial for maintaining an efficient workflow and identifying potential bottlenecks in your processes. Bounce back issues occur when tasks or tickets move forward in the workflow, such as from “In Progress” to “Review”, “Testing” or “Done”, but then revert back to an earlier stage. This differs from reopened issues, a more narrow metric that refers specifically to tasks marked as Done or Resolved but later reopened due to additional problems. Repeated bounce backs may suggest that tasks are not meeting the required standards at certain stages, leading to rework and delays. Understanding and tracking bounce back issues allows teams to address recurring challenges, ensure smoother project progress and better overall outcomes.
Key Point: Bounce back issues typically involve the movement of tasks or tickets backward through workflow stages.
Creating a Bounce Back Report with Jira’s Two-Dimensional Gadget
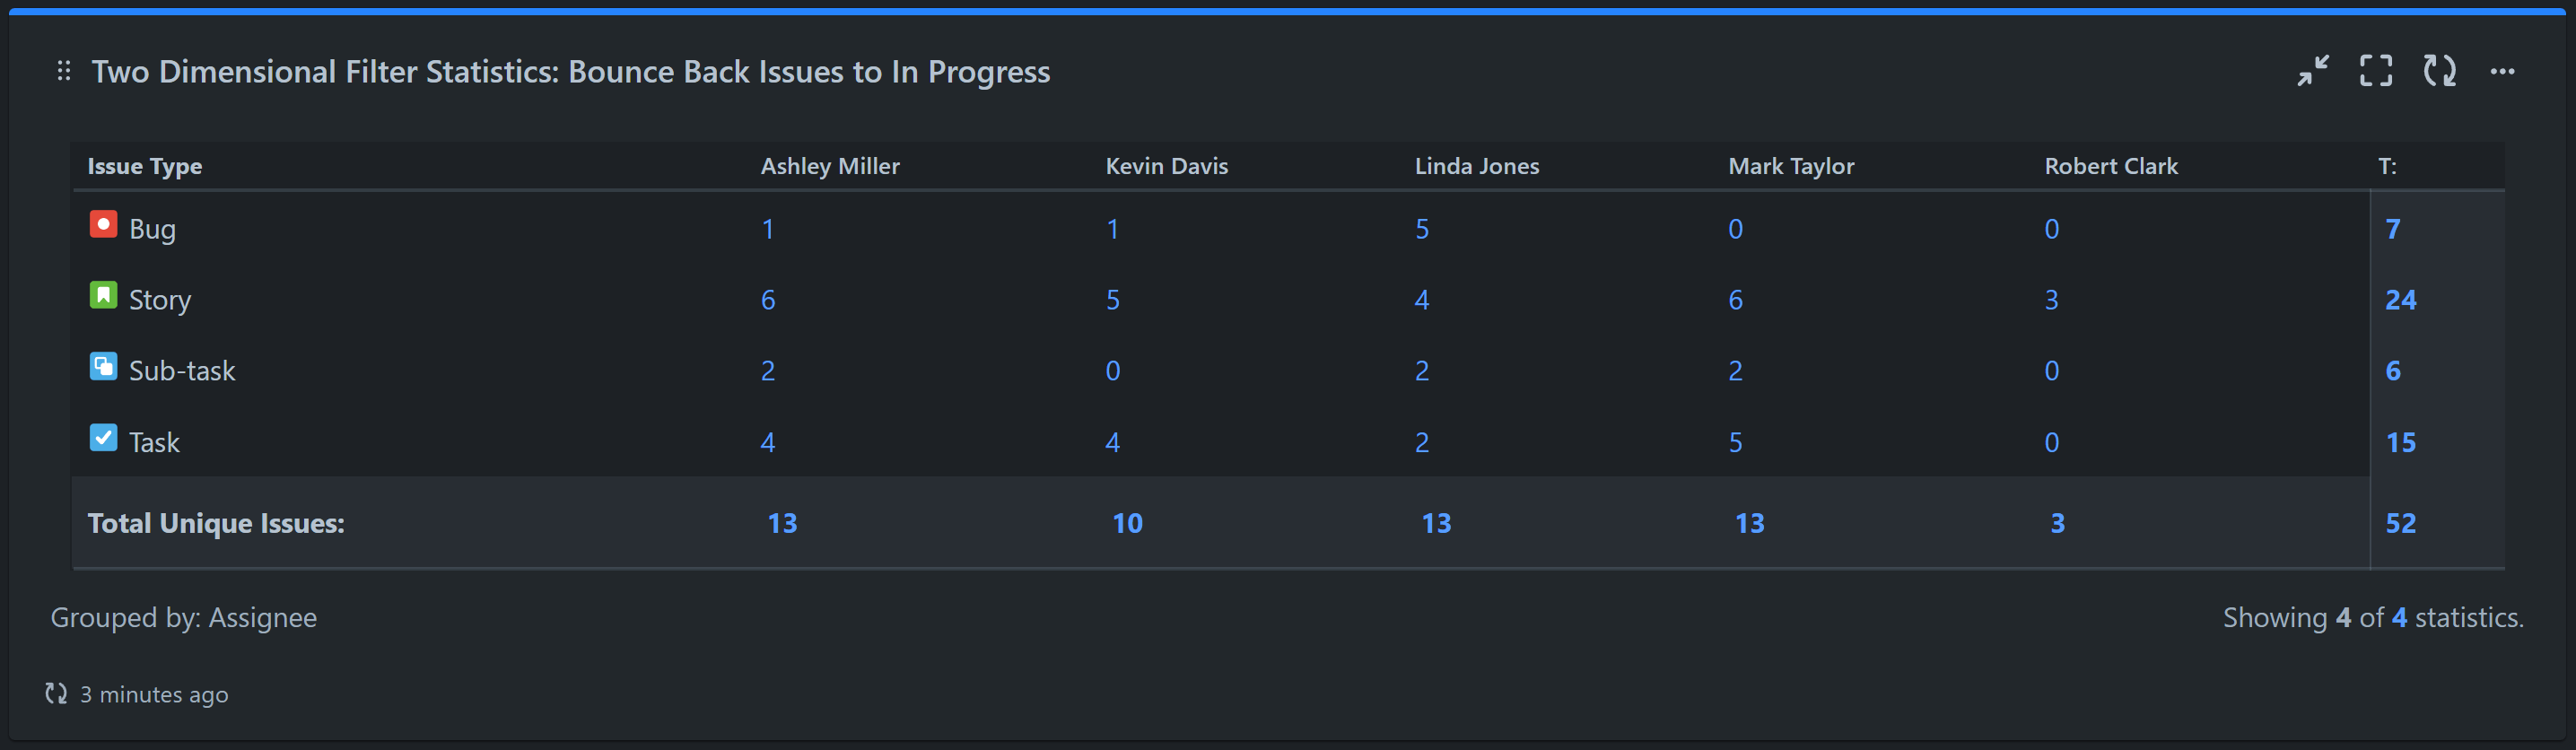
You can create a bounce-back report in Jira using the native Two-Dimensional Filter Statistics gadget. This gadget is straightforward and allows you to visualize data effectively. To set it up for bounce-back issues, you first need to create a JQL query in the issue navigator that filters only the issues that have transitioned back to “In Progress” from statuses like “Review” or “Testing” (or other statuses depending on your specific workflow).
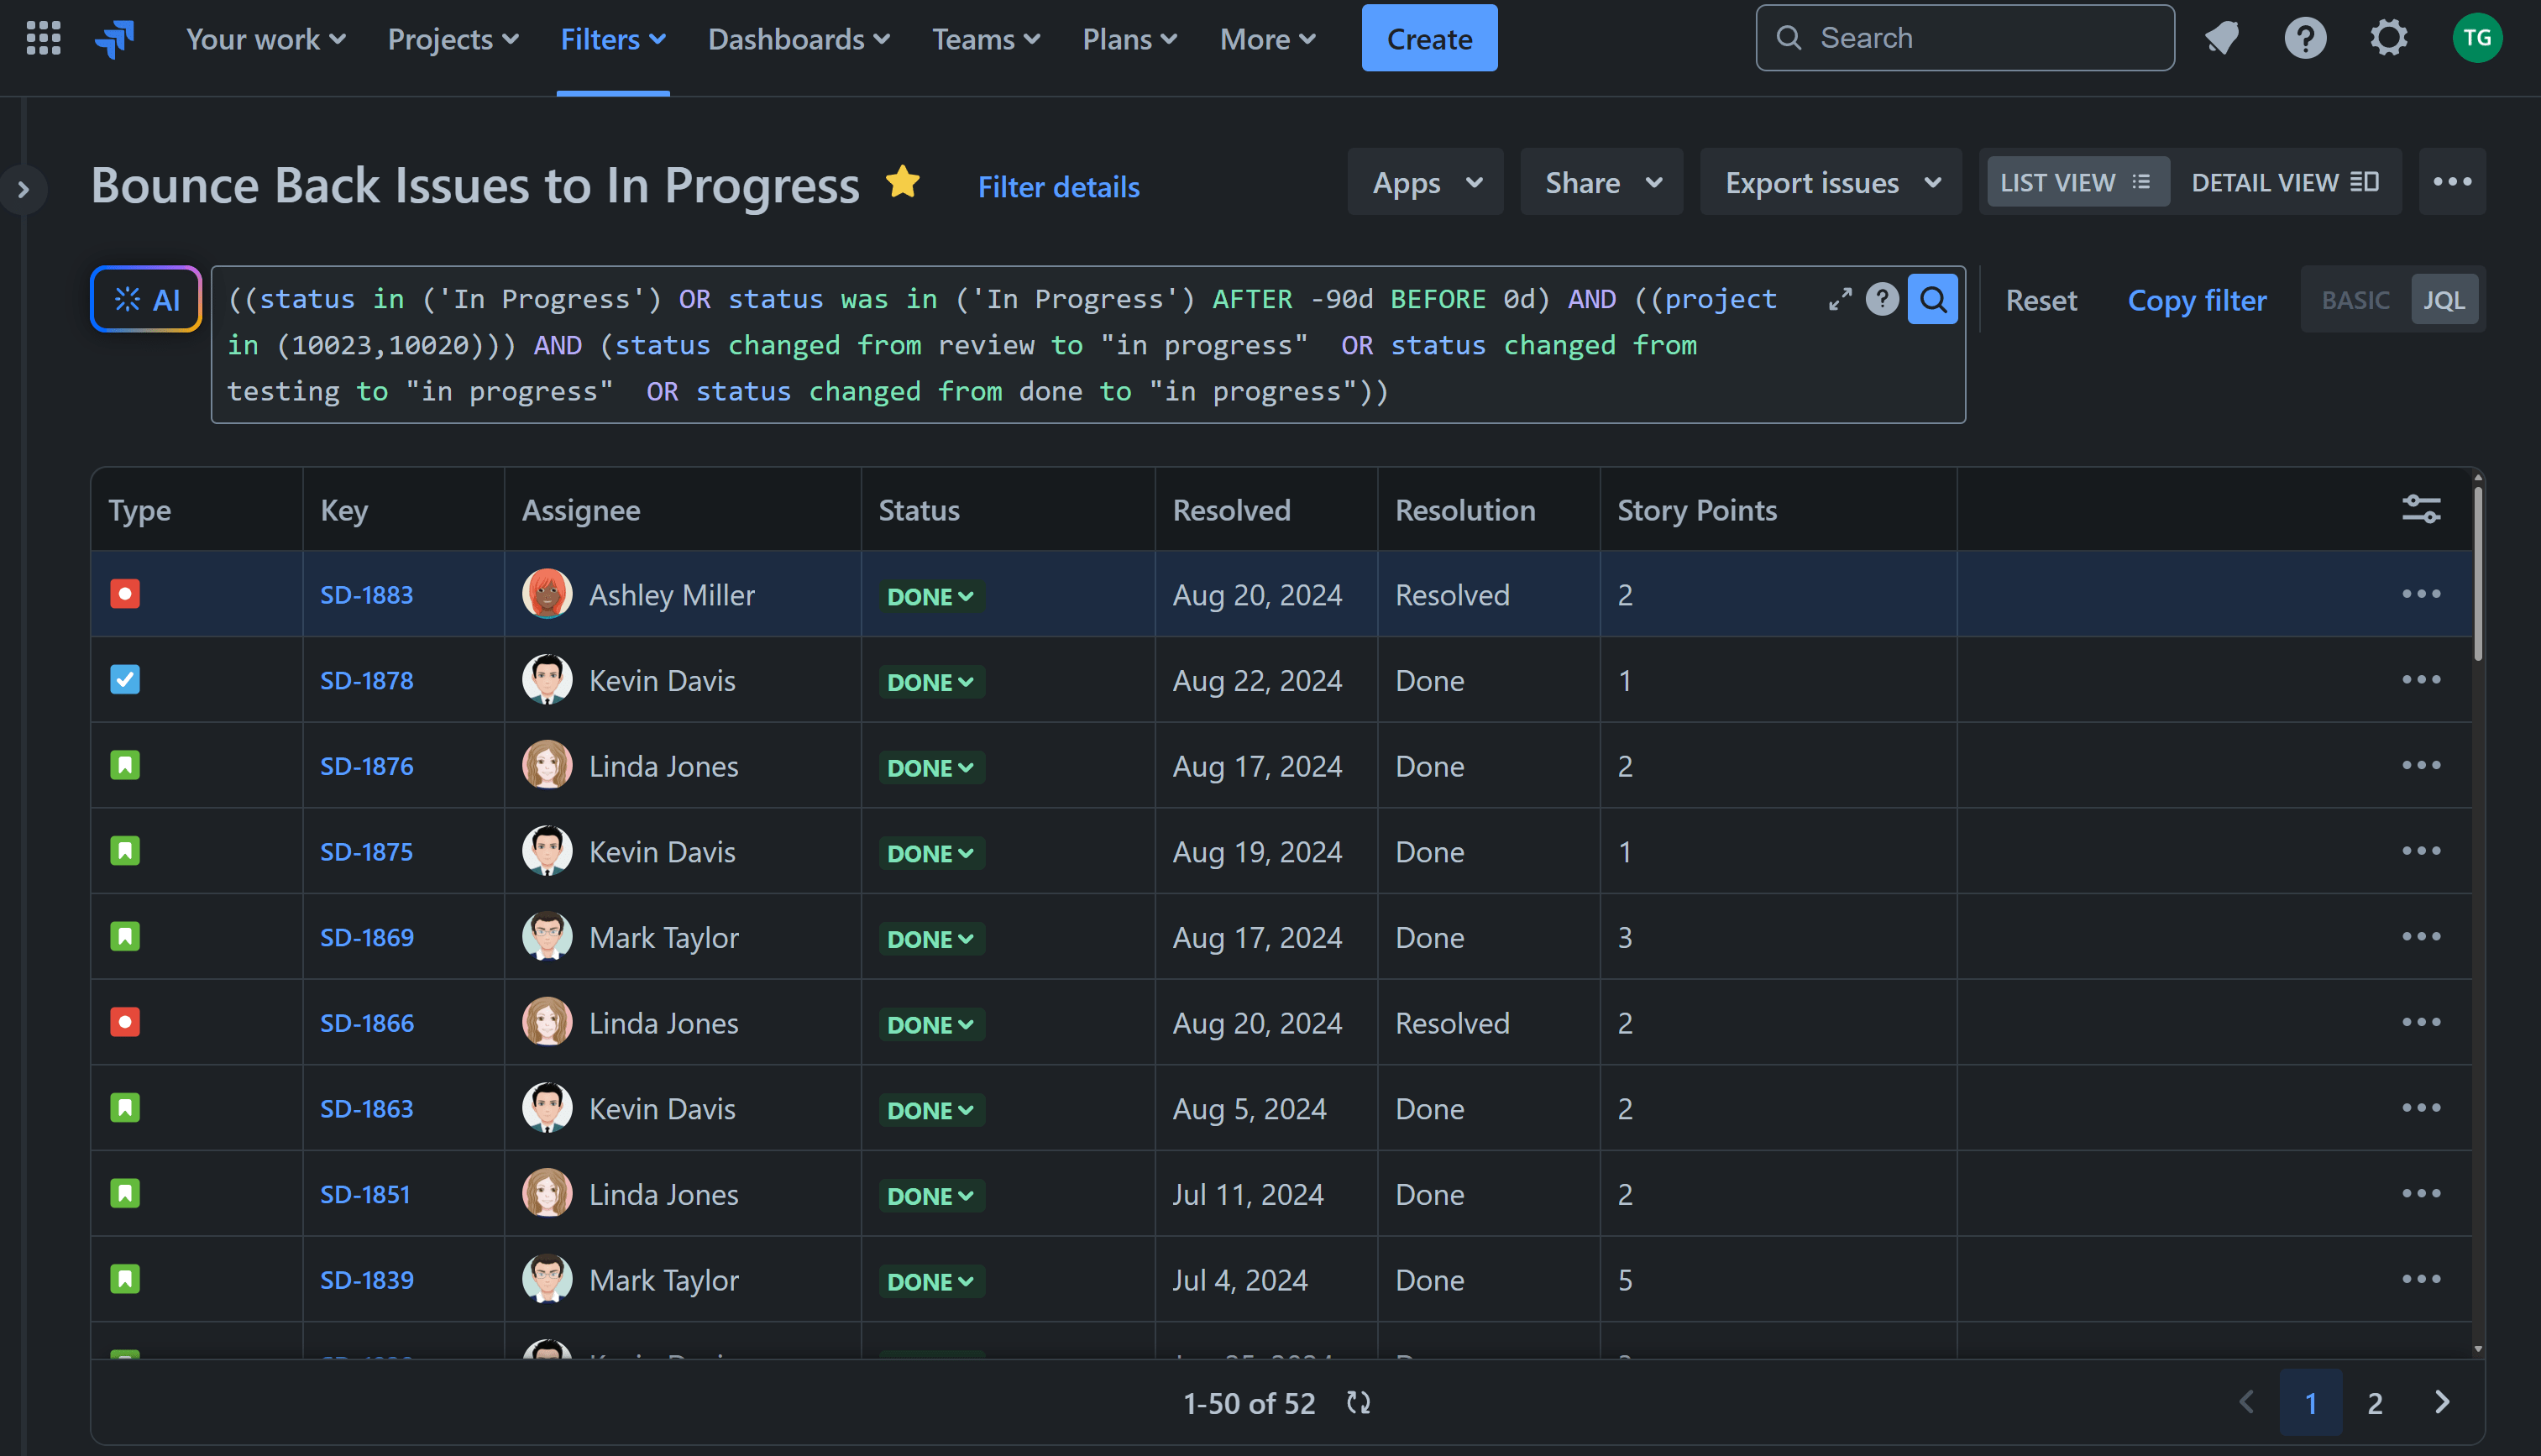
After saving this filter, you can use it as the data source in the Two-Dimensional gadget.
While building the JQL query for this approach can be challenging – especially in workflows with multiple statuses and transitions – it also offers flexibility. For example, you can filter only specific transitions, such as issues that moved from ‘Testing’ to ‘In Progress’ or from ‘Review’ to ‘In Progress’.
The native gadget is a good starting point for analyzing your bounce-back issues. If there are only a few, a detailed examination of each issue can provide valuable insights into the underlying causes and help you identify measures to improve your bounce-back rate. However, if you’re dealing with a large number of bounce-back issues, further segmenting the data may be necessary for deeper insights. If you need to track how many times an issue bounced back to a certain status, one solution is to create a custom number field and use automation to record the number of transitions in it. Check out our 3-Step Guide to Enrich Your Jira Reports with Jira Custom Fields and Automation.
Enhance Your Bounce Back Reporting with the Performance Objectives App
Using custom fields and automation may not be the preferred solution for many users. This is where the Performance Objectives app becomes beneficial with its dynamic metrics, “Cycles in Status” and “Cycles in Assignee.” These metrics count how many times each issue has been in particular status/es or with specific assignee/s.
The “Cycles in Status” metric allows you to segment issues that frequently return to “In Progress” or any other status, and identify patterns by grouping them by any Jira field – such as assignee, component, reporter, etc. This level of detail can be invaluable for spotting workflow patterns and gaining a more precise understanding of potential process inefficiencies.
Similarly, the “Cycles in Assignee” metric tracks how many times Jira issues are assigned to one or multiple users. By breaking down the metric by Assignee (history) or Status (history), you can gain deeper insights into the back-and-forth cases that slow down issue resolution.
With the Performance Objectives app, you can easily generate various reports on the severity and frequency of bounce-back issues for Jira Software, Jira Service Management, and Jira Work Management, such as:
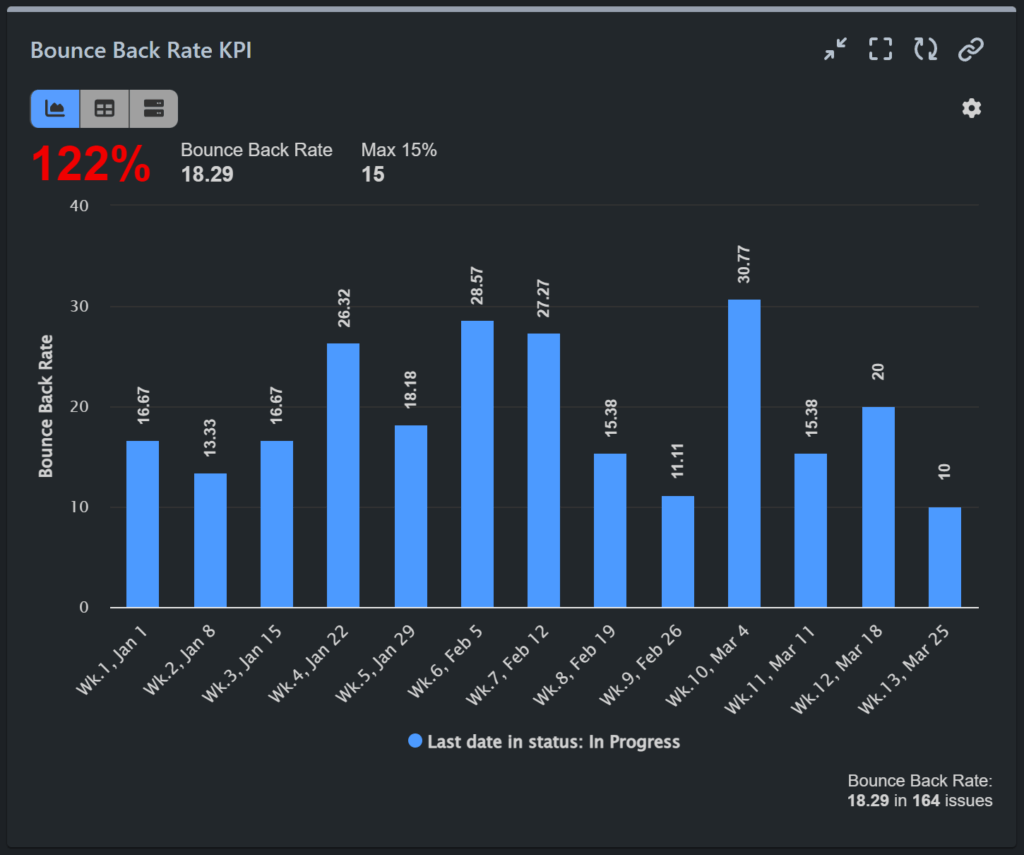
Bounce Back Rate KPI
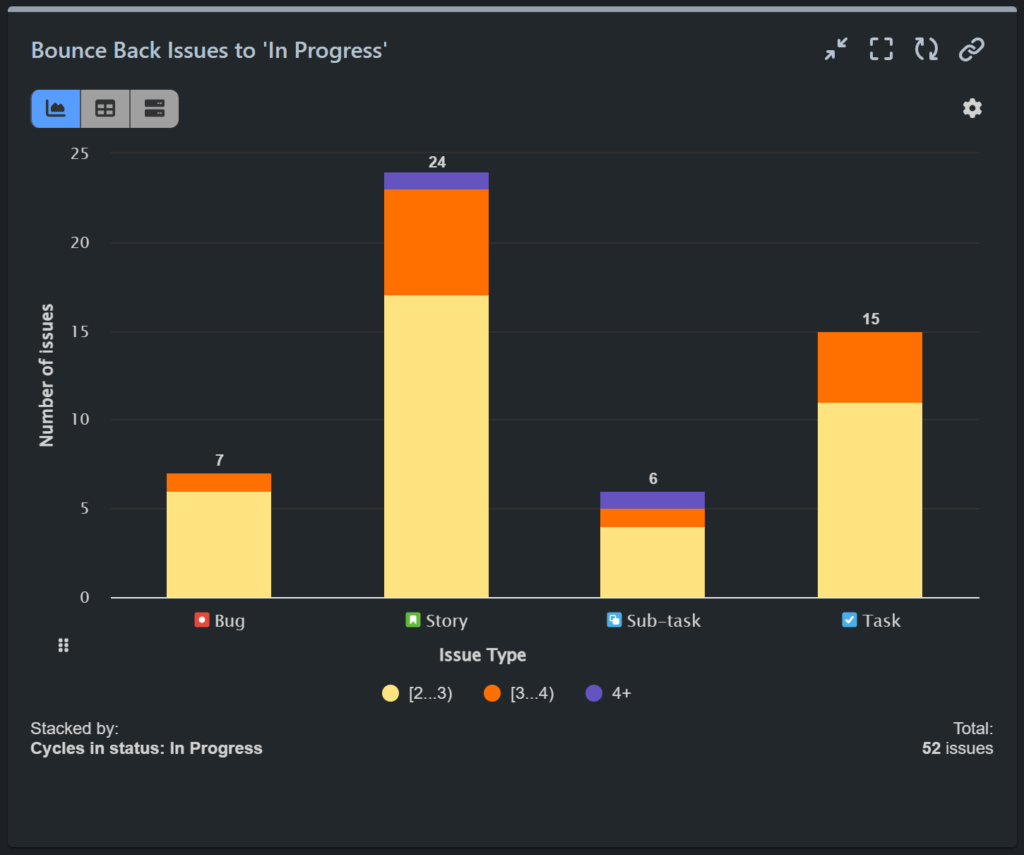
Bounce Back Issues to ‘In Progress’
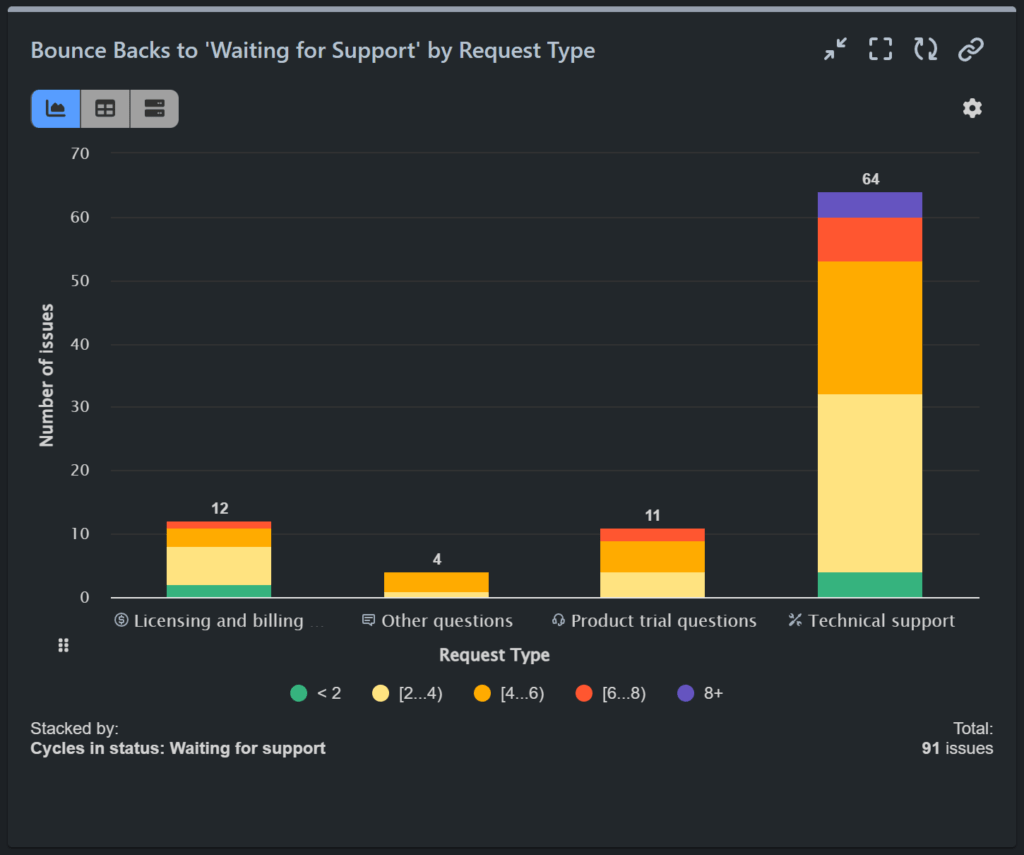
Bouncing Issues to ‘Waiting for Support’
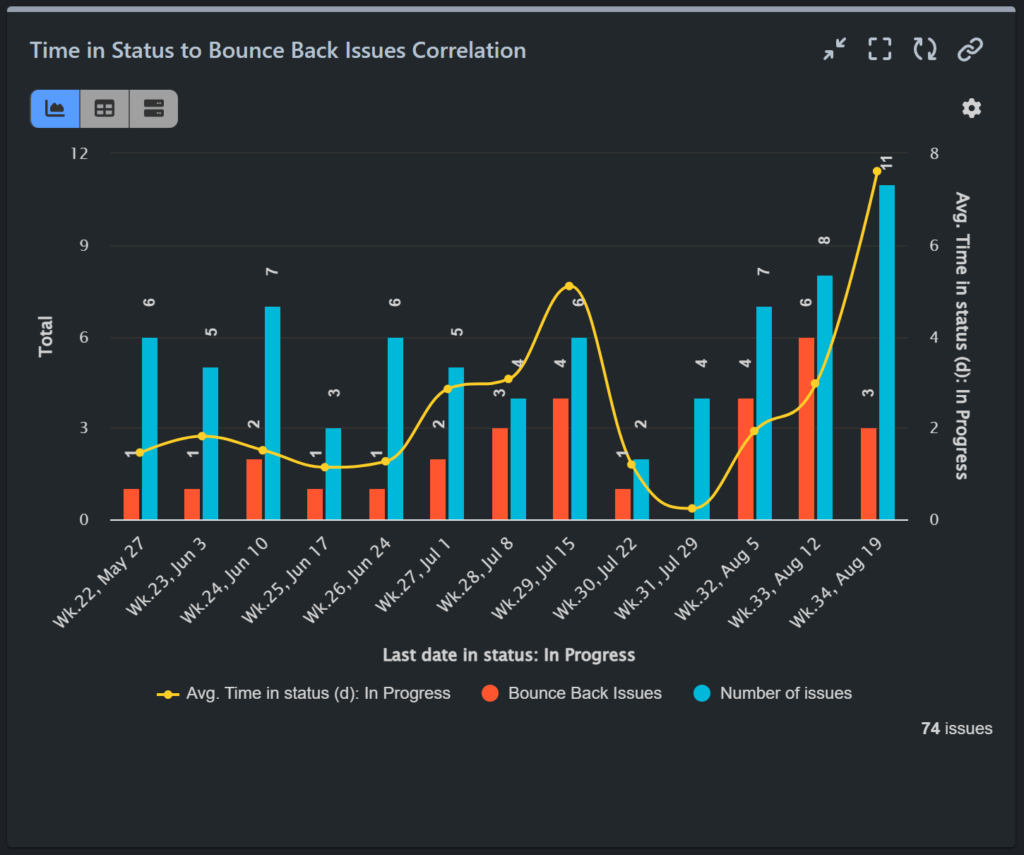
Bouncing Issues vs Time in Status
For a step-by-step guide on creating a Bounce Back Issues to ‘In Progress’ report, please refer to our Confluence documentation. Additionally, you can check the configuration steps for the Bounce Back Rate report here.
By using the Performance Objectives app, you gain a more comprehensive view of your project’s health, leading to better decision-making and improved outcomes.
For those interested in exploring reports related to reopened issues, including examples of resolved vs. reopened reports, ticket reopen rates, and multiple reopened issues, check out our detailed article on these topics.
Start your 30 days free trial of Performance Objectives: Charts for Jira from Atlassian Marketplace.