- All
- Data Analysis
- Gadgets
- Getting started
- Goals
- Metrics
- Styling
First steps
Take a closer look at each of the available gadgets in the Performance Objectives: Charts for Jira a...
Chart types overview
Performance Objectives: Charts for Jira app provides a wide range of chart types through its gadgets...
Configuration Overview
Configuration overview of the app's robust features and a comprehensive list of Standard and Custom ...
Performance Objectives Gadget
Performance Objectives is the flagship gadgets of the app, allowing you to leverage its powerful cap...
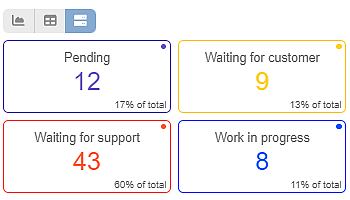
Tiles View
Diverse Jira Dashboards with Seamless Integration of Charts, Tables, and Tiles With our app, Jira us...
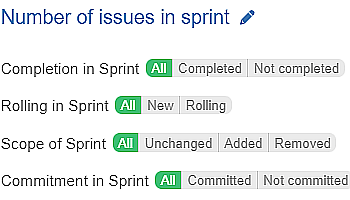
Enhanced Sprint Insights: Introducing New Filtering Options and Metrics
Introducing New Sprint-Related Filtering Options In addition to the wide range of Agile metrics and ...
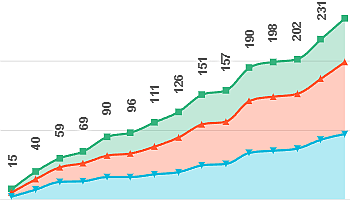
Performance Trend Gadget
Performance Trend Gadget: Spotting Patterns on Your Jira Dashboard Introducing one of the 10 standal...
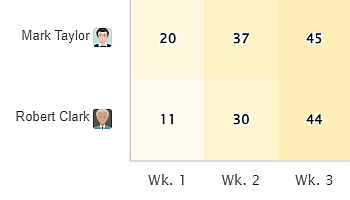
Heat Map Gadget
The Heat Map is one of the 10 standalone gadgets available within our app, Performance Objectives fo...
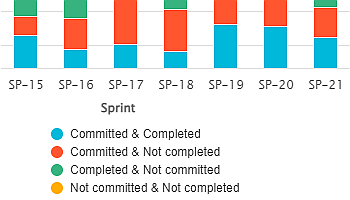
Sprint Commitment State Report
Using the Performance Objectives app, you can leverage a variety of sprint-related metrics and field...
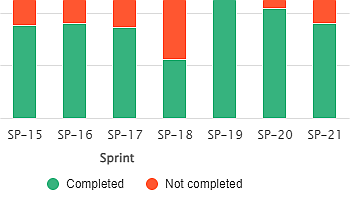
Sprint Completion State Report
The Sprint Completion State Report, created using the Performance Objectives gadget, provides a deta...
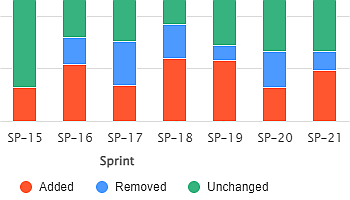
Sprint Scope Change Report
By leveraging the Sprint Scope Change field supported by the Performance Objectives app, agile teams...
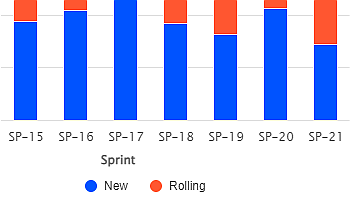
Sprint Rolling State Report
In agile project management, stories and their estimates sometimes don’t get completed within ...
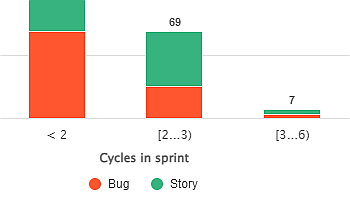
Cycles in Sprint Report
The ‘Cycles in Sprint’ metric, supported by the Performance Objectives app for Jira prov...
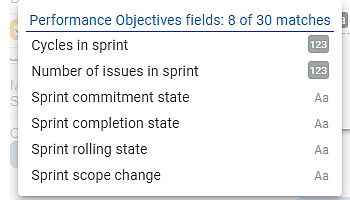
Sprint metrics
Drive productive sprint retrospectives with valuable reports using our new metrics and fields. Enhan...
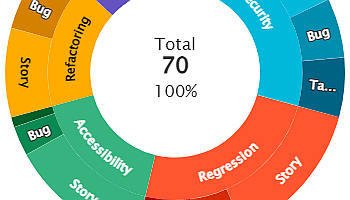
Sunburst Chart / Donut Chart
Create impressive interactive reports with Sunburst chart visualization on your Jira Dashboard using...
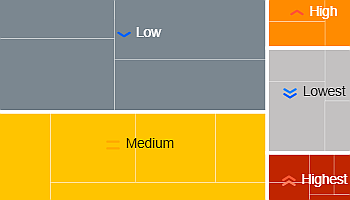
Tree Map Gadget
Performance Objectives for the Jira app comes with a variety of 10 dashboard gadgets to suit the rep...
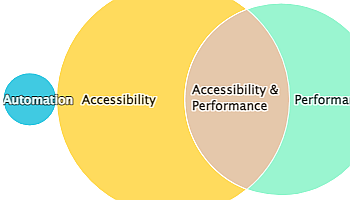
Venn Diagram
The Venn diagram is one of the 12 chart types supported by the Performance Objectives app for Jira. ...
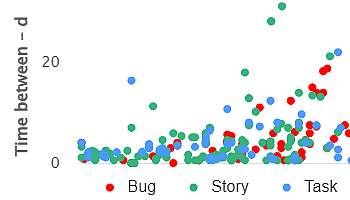
Scatter chart
Powerful Data Insights: Harness the Potential of Scatter Charts The Scatter chart, also known as a s...

Bubble chart
The Bubble chart is among the 12 available chart types within our app, enabling you to visualize tas...
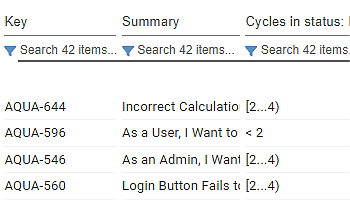
Issue List View: Scatter & Bubble Charts Gadget
Maximizing Insights with the Issue List View in Scatter & Bubble Gadget The Performance Objectiv...
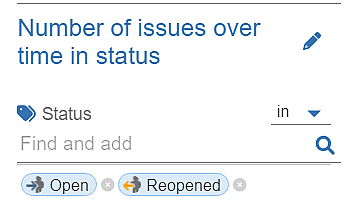
Number of open issues over time
Display open issues over time in Jira Dashboard. Keep your ticketing process under control using ...
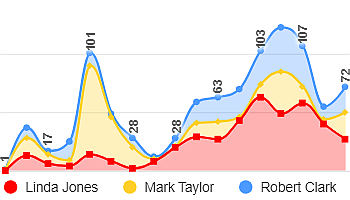
Stack by
Use Performance Objectives gadgets to create Stacked Area or Stacked Bar charts. Compare data sets w...
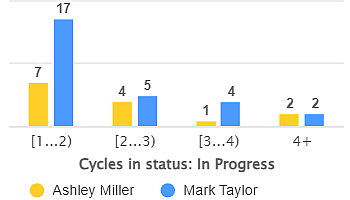
Group by
Use 'Group by' in Performance Objectives app to break down data by a second dimension, that can be a...
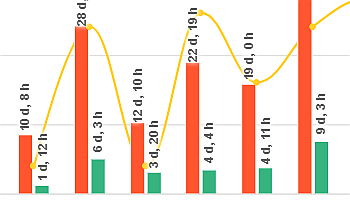
Multi Metric Combined Chart Gadget
Explore Cross-Metric Analysis with Multi Metric Combined Gadget The Performance Objectives app intro...
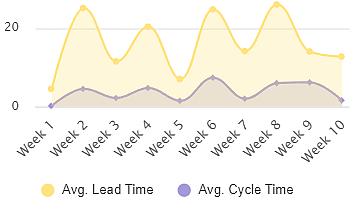
Multi Metric Trend Chart Gadget
Explore Cross-Metric Trend Analysis with Multi Metric Trend Gadget The Multi Metric Trend Chart is o...
Support for Cloud Migration
At present, the Jira Cloud Migration Assistant does not support the automatic migration of dashboard...
Import / Export Gadgets
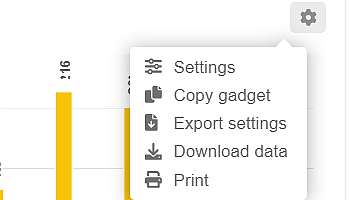
New Feature Launch If your goal is to duplicate a gadget on the same dashboard to partially reuse it...
Data Segmentation & Dimensions
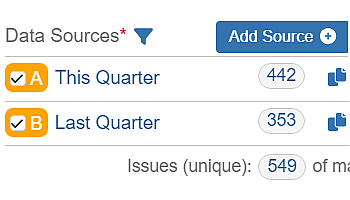
Use Multiple Data Sources for Enhanced Data Segmentation Performance Objectives: Charts for Jira app...
Average Metrics and Calculation
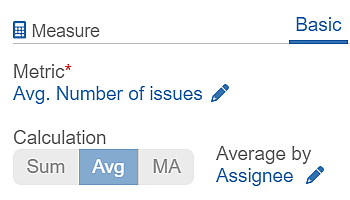
Performance Objectives: Charts for Jira offers three calculation types for metrics, providing unmatc...
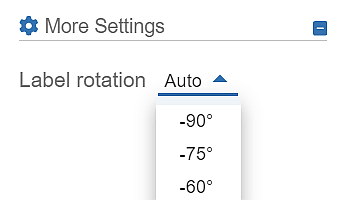
Label rotation / Alignment of x-axis label
A new customization feature is available within the Performance Objectives app, allowing you to tail...
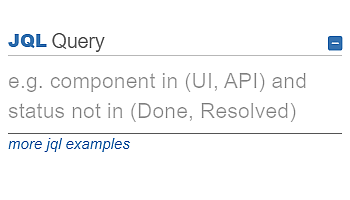
JQL Data Segmentation
JQL Data segmentation option in Performance Objectives for Jira app provides you the ability to segm...

Pie Chart
Simplify Data Interpretation with Pie Charts in Performance Objectives App Pie charts enjoy widespre...
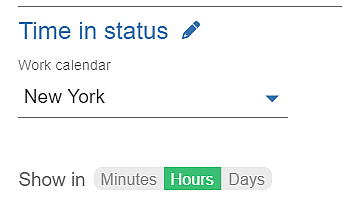
Time in Status
Discover the Power of ‘Time in Status’ Metric Unlock the full potential of your Jira wor...
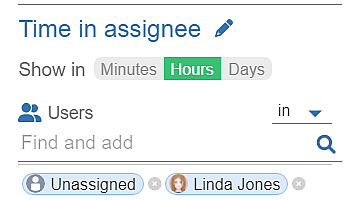
Time in Assignee
You want to know how long it takes an assignee to complete a task in Jira? Leverage the ‘Time ...
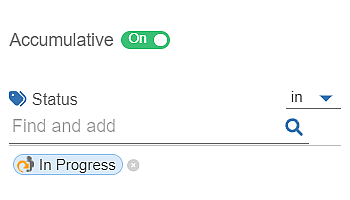
Accumulative Toggle
The Accumulative toggle is an option enabled after you select either the ‘Time in Status’ or...
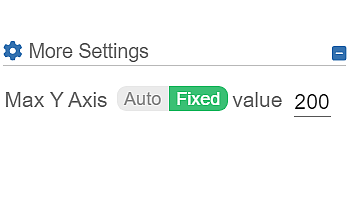
Set Maximum Y-Axis Value
A new toggle is now available in Performance Objectives for Jira app. It gives you control over the ...
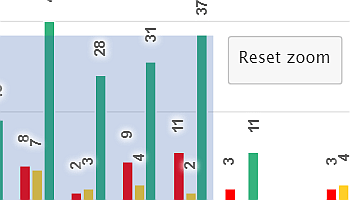
Zooming & Padding
Performance Objectives: Charts for Jira provides an array of built-in chart customization options. W...
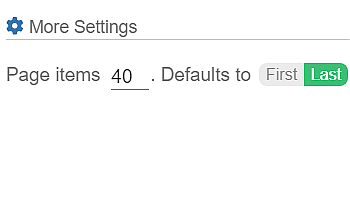
Pagination
Performance Objectives: Charts for Jira introduces a robust feature allowing chart pagination, grant...
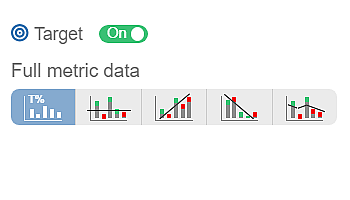
Target Results
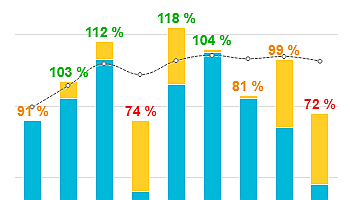
Our Performance Objectives and Performance Trend gadgets come equipped with a dynamic target-setting...
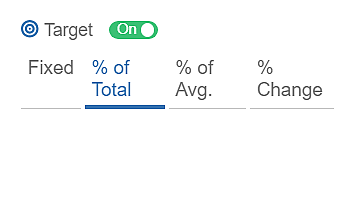
Target Types
Building Jira KPIs: Four Target Types with the Performance Objectives App Are you tired of relying o...
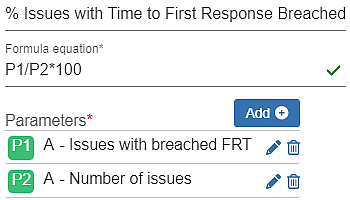
Formula Metrics
One of the features that set the Performance Objectives app for Jira apart from other charting and r...
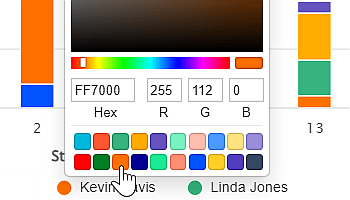
Custom Colors
Performance Objectives: Charts for Jira provides a multitude of customization possibilities, includi...
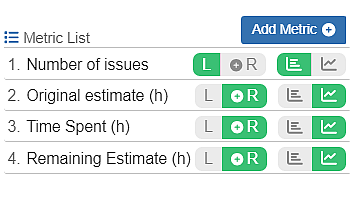
Multiple Metrics
The Vital Role of Tracking Cycle Time vs Lead Time in Jira Lead time and cycle time are key project&...
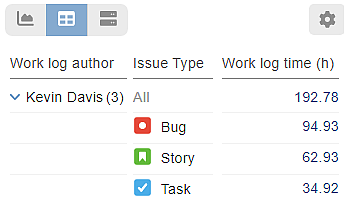
Default Table and Pivot Table View
Tables and charts are both valuable tools for presenting data effectively. Each has its own advantag...
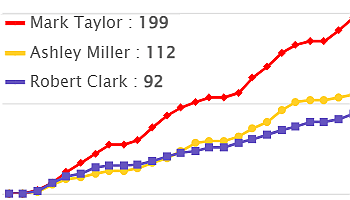
Cumulative Mode
Performance Objectives: Charts for Jira supports cumulative mode configuration option that allows fo...
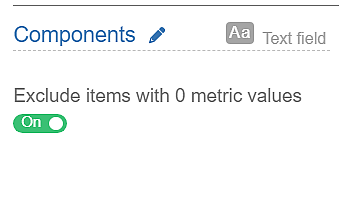
Exclude items with Zero metric values
You need to exclude empty dates from your chart in Jira? Performance Objectives: Charts for Jira off...
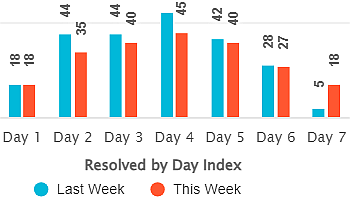
By Date Index
Enhance Period over period analysis - Visualize Jira data using "by date index" in Performance Objec...
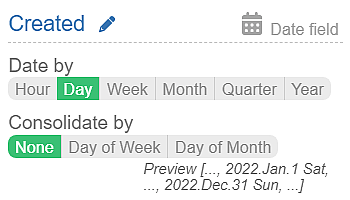
Date Granularity
Enhancing Precision with Date-Type Fields and Date Granularity Options in Jira Performance Objective...
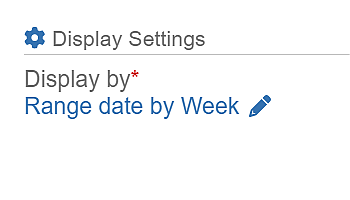
Range Date
Range Date Field as a Key to Time-Based Data Insights The Range Date is a key Date field, seamlessly...

Work calendars
Get actual Time in status, Time in assignee, Time since, and Time between metrics considering the wo...
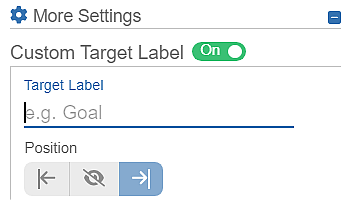
Target Label Aliasing
‘Performance Objectives‘ and ‘Performance Trend‘ dashboard gadgets empower u...
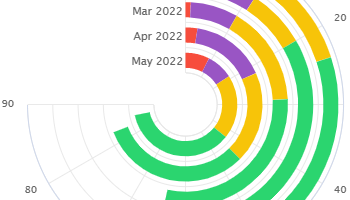
Radial bar chart
Create Radial Bar Charts on your Jira dashboard by utilizing the ‘Circular Chart’ gadget...
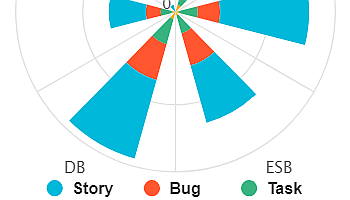
Wind rose chart
Wind rose chart: Visualize direction and magnitude. Rich display options in Jira for valuable insigh...
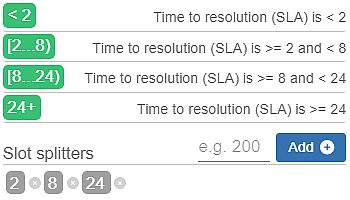
Metric Distribution
Utilizing Metric Distribution in Performance Objectives Metric Distribution offers a valuable soluti...
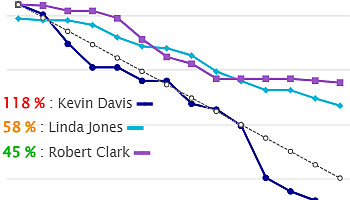
Burndown Chart
Burndown charts are invaluable in project management and agile software development, offering a host...
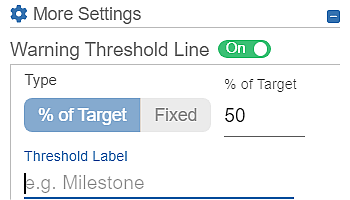
Warning Threshold
The warning threshold feature is available under ‘More Settings’ in Performance Objectiv...
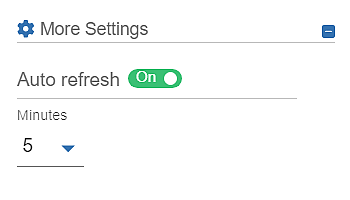
Auto Refresh
Keep your Jira dashboards effortlessly up-to-date with our Auto-Refresh feature. No more manual char...
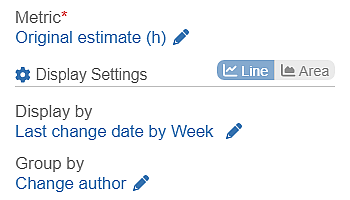
Change History Gadget
Monitor field changes and trends in Jira with the Change History Gadget for data-driven insights....
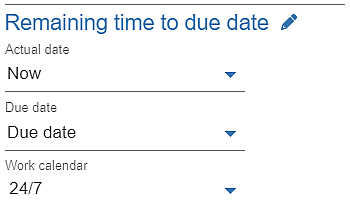
Remaining time to due date
Track the remaining time between now and due date or any date field in Jira using Performance Object...
Conditional Metrics
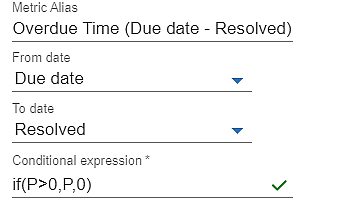
The Conditional Metric is an advanced feature of the Performance Objectives for Jira app, offering e...
Time between any date fields
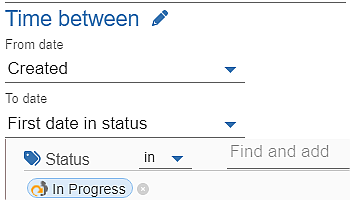
Calculate time between dates in Jira with "Time between" metric. Create diverse reports on your Dash...
Overdue time from date
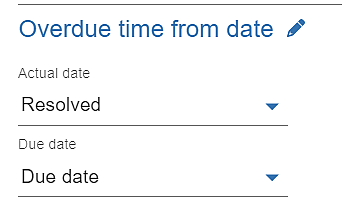
Track assignee performance & priority-based issue resolution in Jira with 'Overdue time from date' m...
SLA Metrics
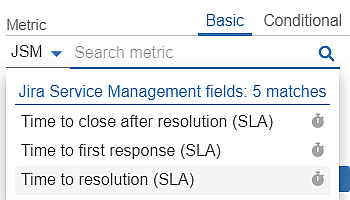
Teams worldwide rely on Jira Service Management (JSM) as their IT Service Management solution (ITSM)...
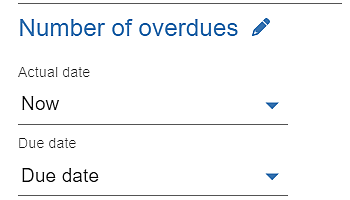
Number of overdues
Track the number of times when Jira issues have passed the due date (number of overdues) and use it ...
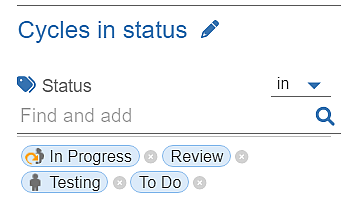
Cycles in status
Track the number of cycles in status (the number of times your Jira issues were in any status, or mu...
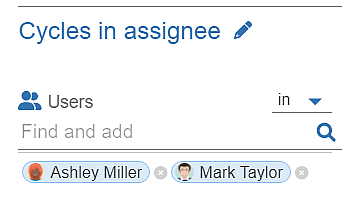
Cycles in Assignee
Track the number of cycles or how many times Jira issues get assigned to one or any of multiple user...
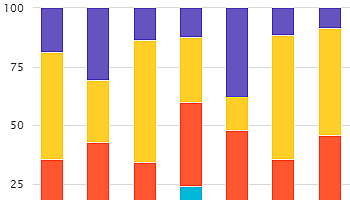
by Percentage
Performance Objectives: Charts for Jira allows you to stack your charts by percentage to display the...
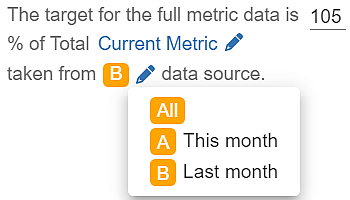
Segmentation & Targets
Performance Objectives: Charts for Jira empowers you to segment data from multiple sources, enhancin...
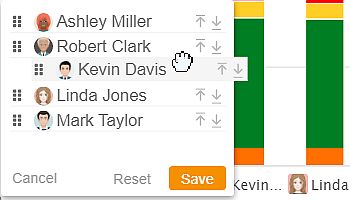
Custom Reorder
Introducing a game-changing customization feature supported by the Performance Objectives app: the d...
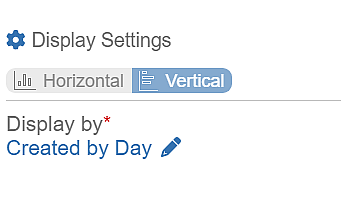
Display Settings: Vertical Orientation
By choosing the ‘Vertical orientation‘ feature in the display settings of the Performanc...
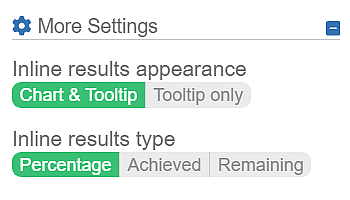
Target Result formatting
Performance Objectives and Performance Trend gadgets are essential tools for goal-setting, performan...
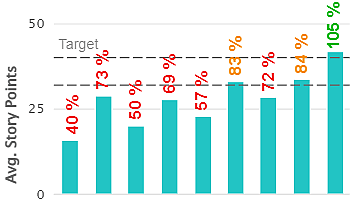
Moving Average
Use Moving Average as a metric calculation with Performance Objectives app and present any selected ...
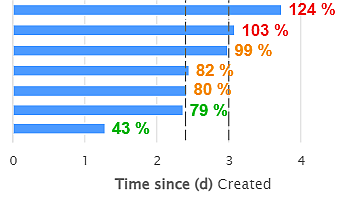
Time Since Metric/ Age of …
Performance Objectives: Charts for Jira offers extensive support for dynamic fields and metrics, fac...