Table of Contents
Enhancing Agile Team Reporting With New Fields and Sprint Metrics For Jira
In addition to the rich set of Agile metrics and fields already supported by the app, Performance Objectives: Charts for Jira is now introducing new scrum metrics and fields, custom-designed to cater to the reporting needs of Scrum teams and empower their continuous improvement efforts. Our focus is on delivering accurate and comprehensive analyses of essential Agile aspects, such as team velocity, rolling issues, resolution state, and scope changes. Leverage these metrics and fields to generate valuable reports that spark productive and data-driven discussions during your sprint retrospectives.
F
F
F
F
F
M
F
In this article we will explore the practical use of each of the new metrics and fields. Let’s dive in:
Explore Sprint-Related Data and Actual Team Velocity
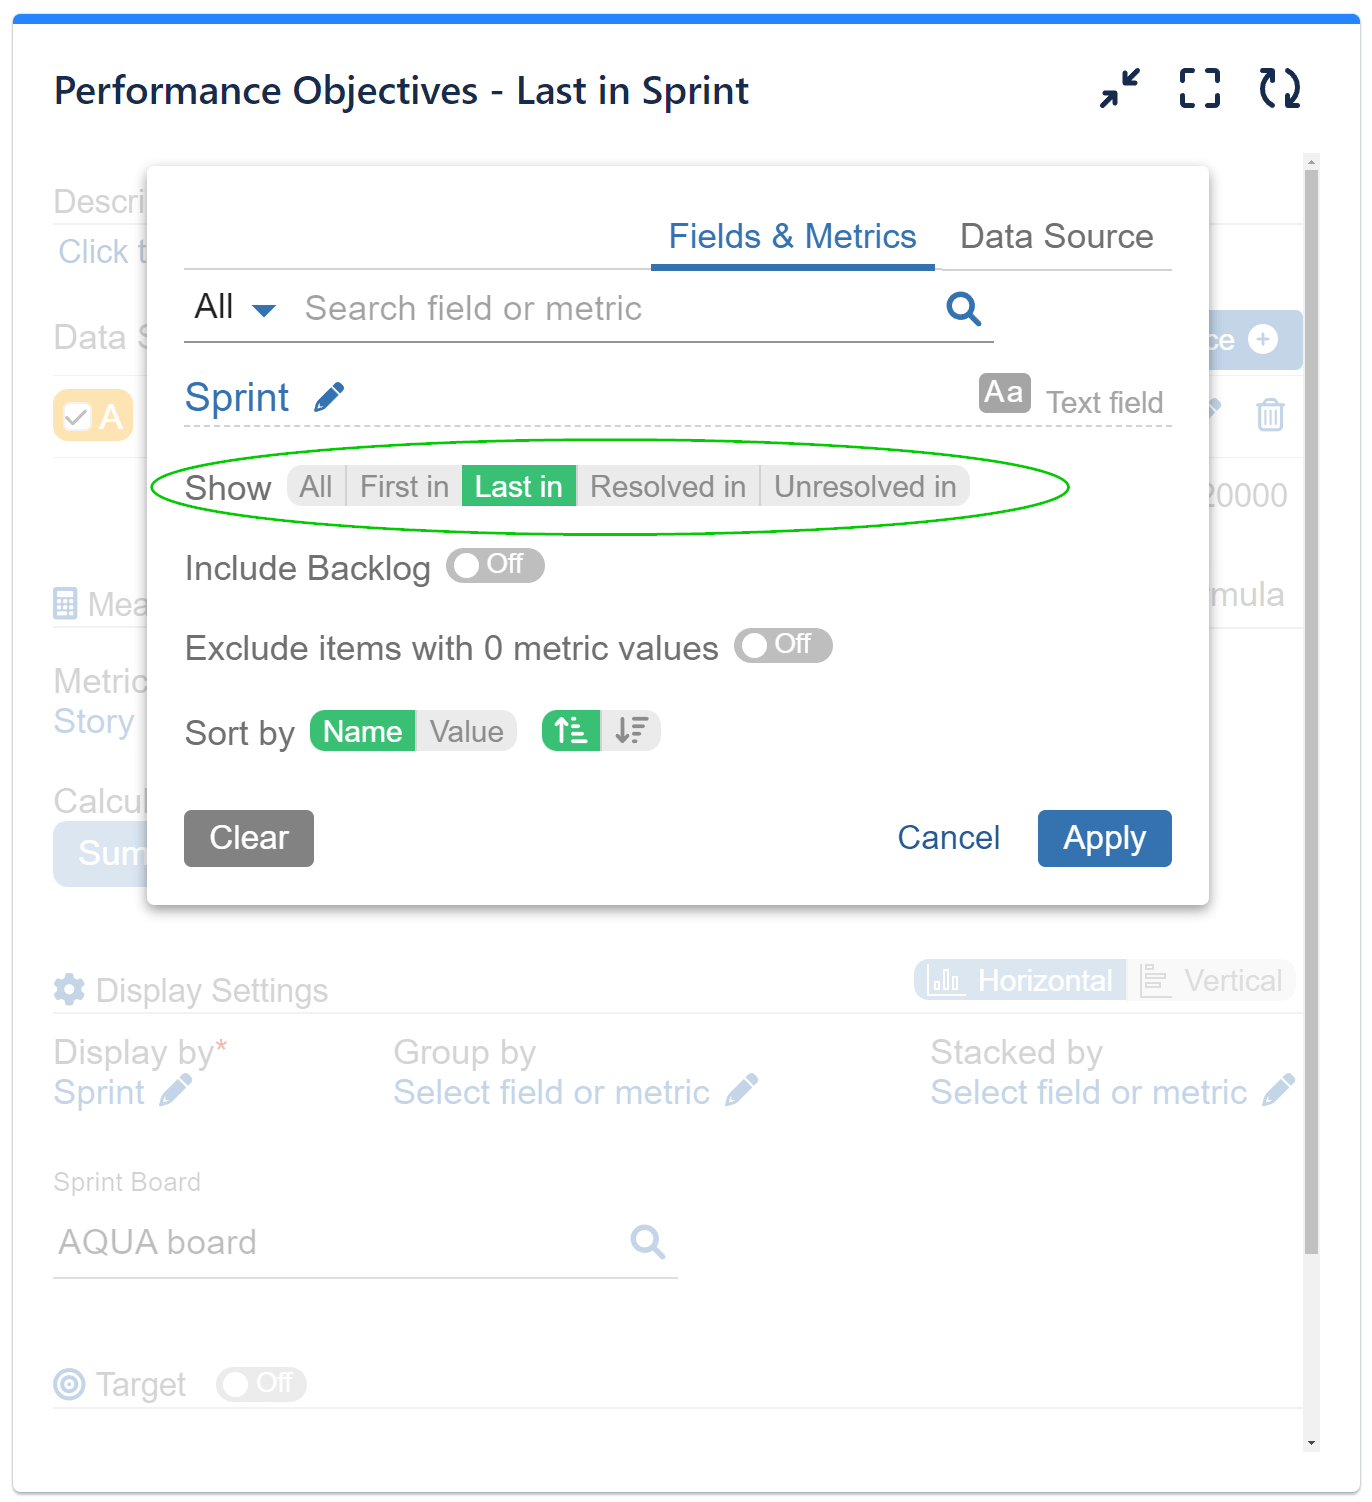
Jira system field Sprint is now enriched with new options, offering distinct state concepts. This enhancement enables you to segment story points or the number of issues based on their appearance and presence within a sprint.
- All: This option presents data for all sprints across selected projects, providing a comprehensive view of the team’s performance over time.
- First in: Filter issues by their initial appearance in a sprint.
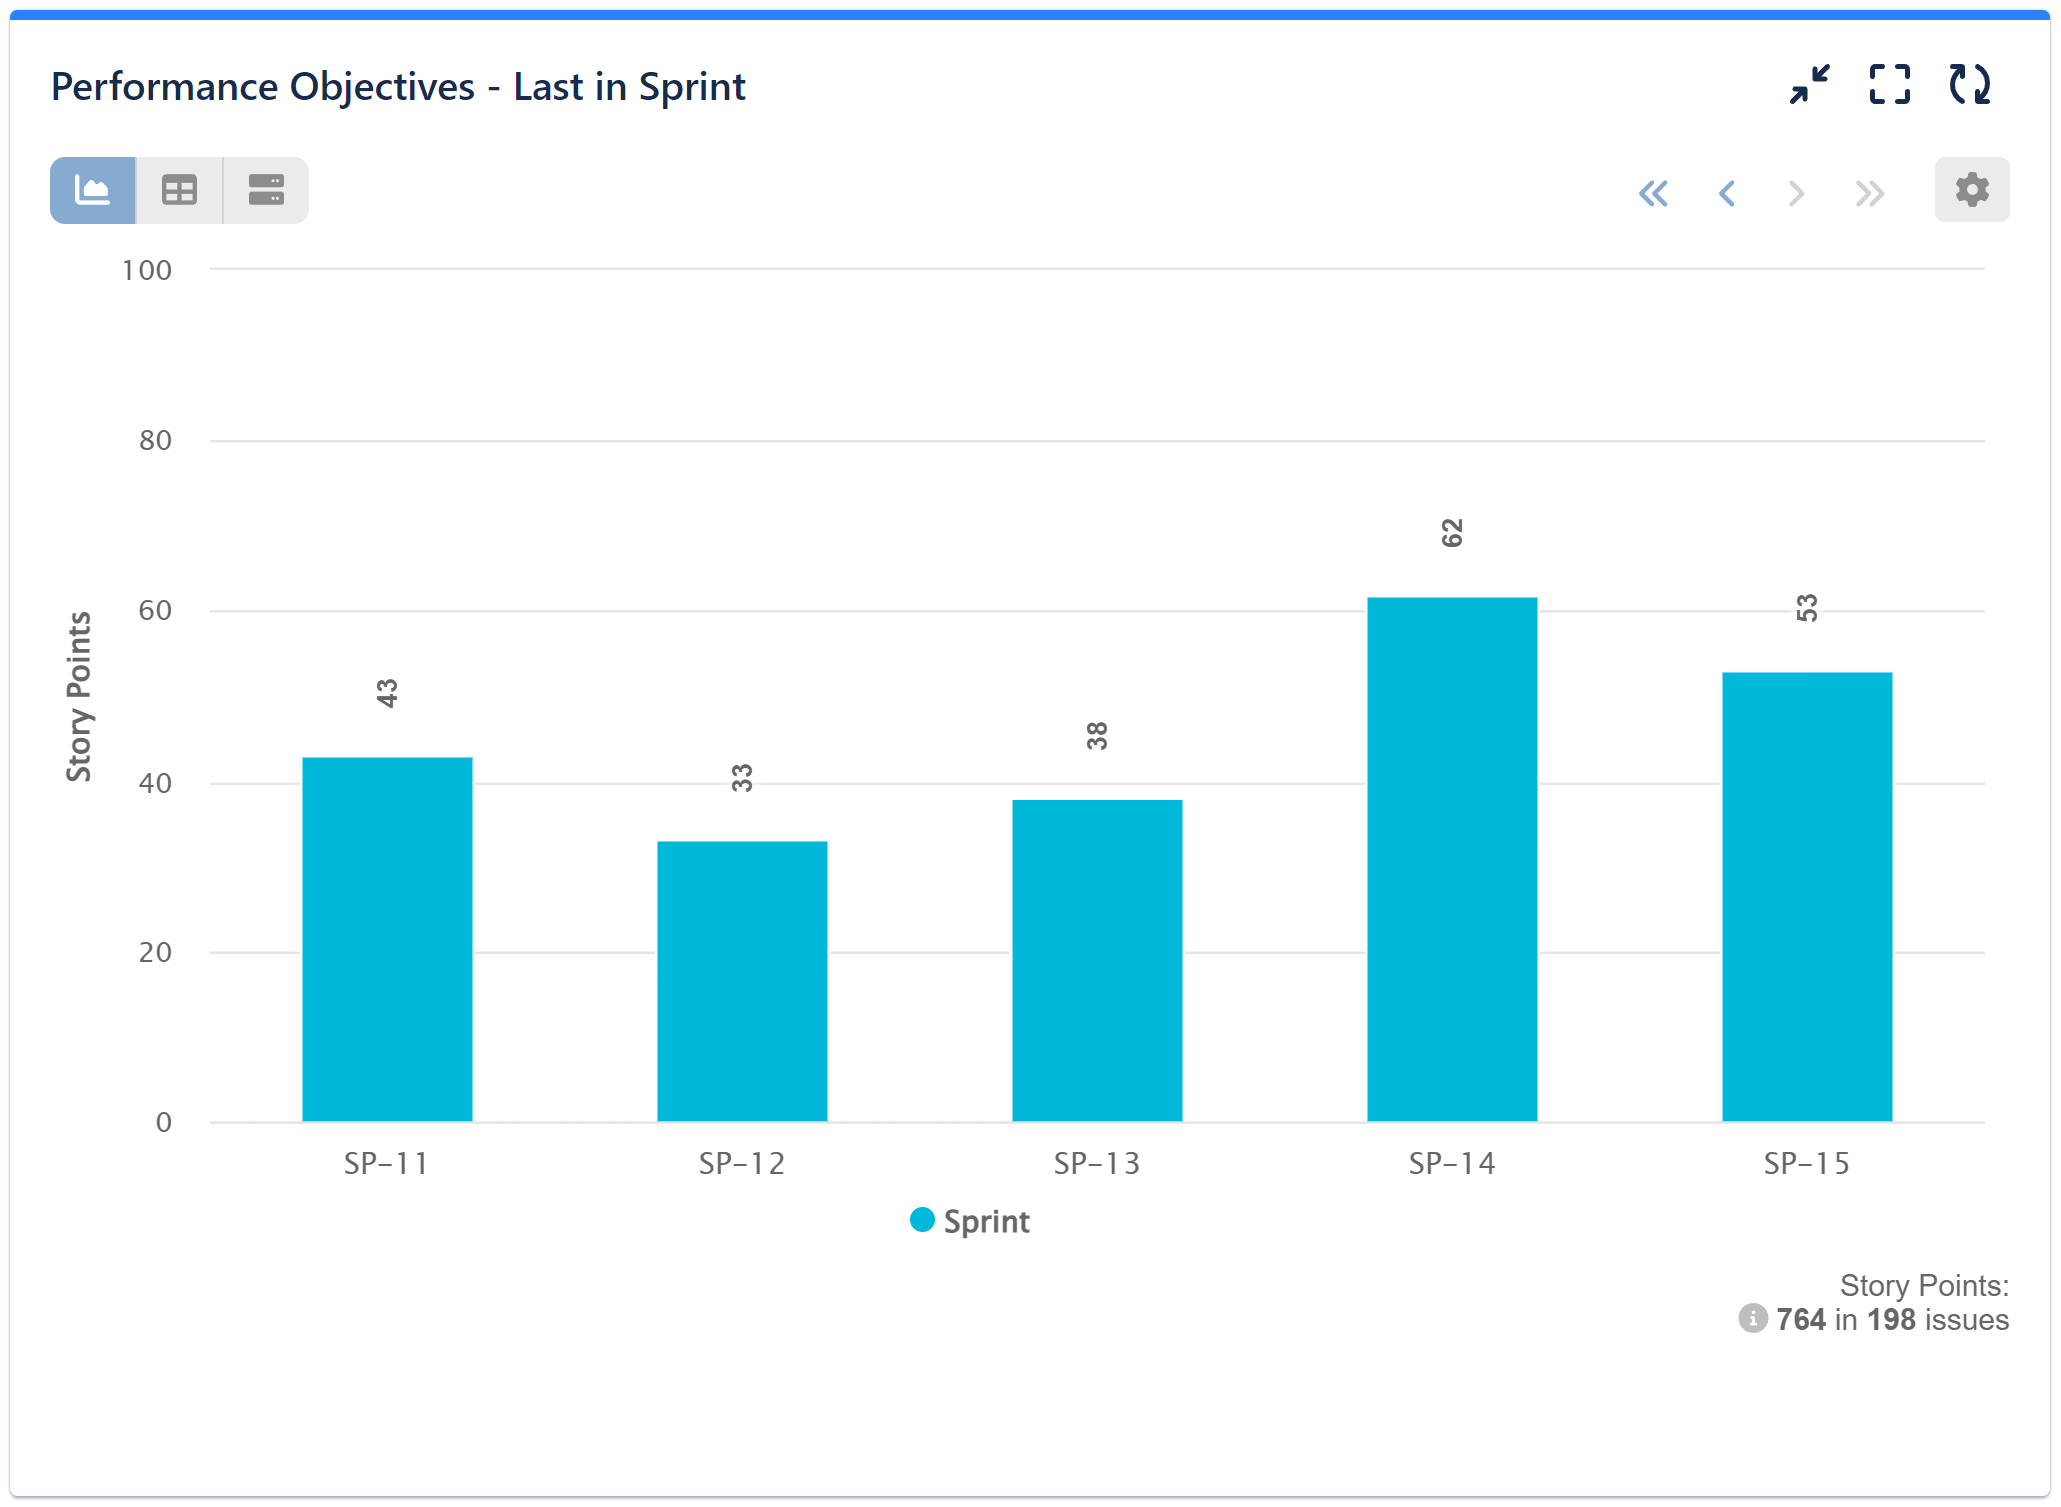
- Last in: Helps you understand how much value is being delivered to customers. This filtering option allows users to filter issues based on their most recent appearance in a sprint. By doing so, it helps provide a more accurate representation of the team’s velocity as it ensures that issues or story points are only counted once, based on their latest sprint appearance. This prevents any duplication or double-counting of work items, resulting in a more reliable and precise measure of the team’s performance.
- Resolved in: Filter issues by the sprints in which they were marked as “resolved” or successfully completed.
- Unresolved in: Filter issues by the sprint in which they remain open or unresolved. By examining only the unresolved issues, teams can uncover the reasons behind their status, reveal any external dependencies, and address the health of backlog items in discussions with the entire team.
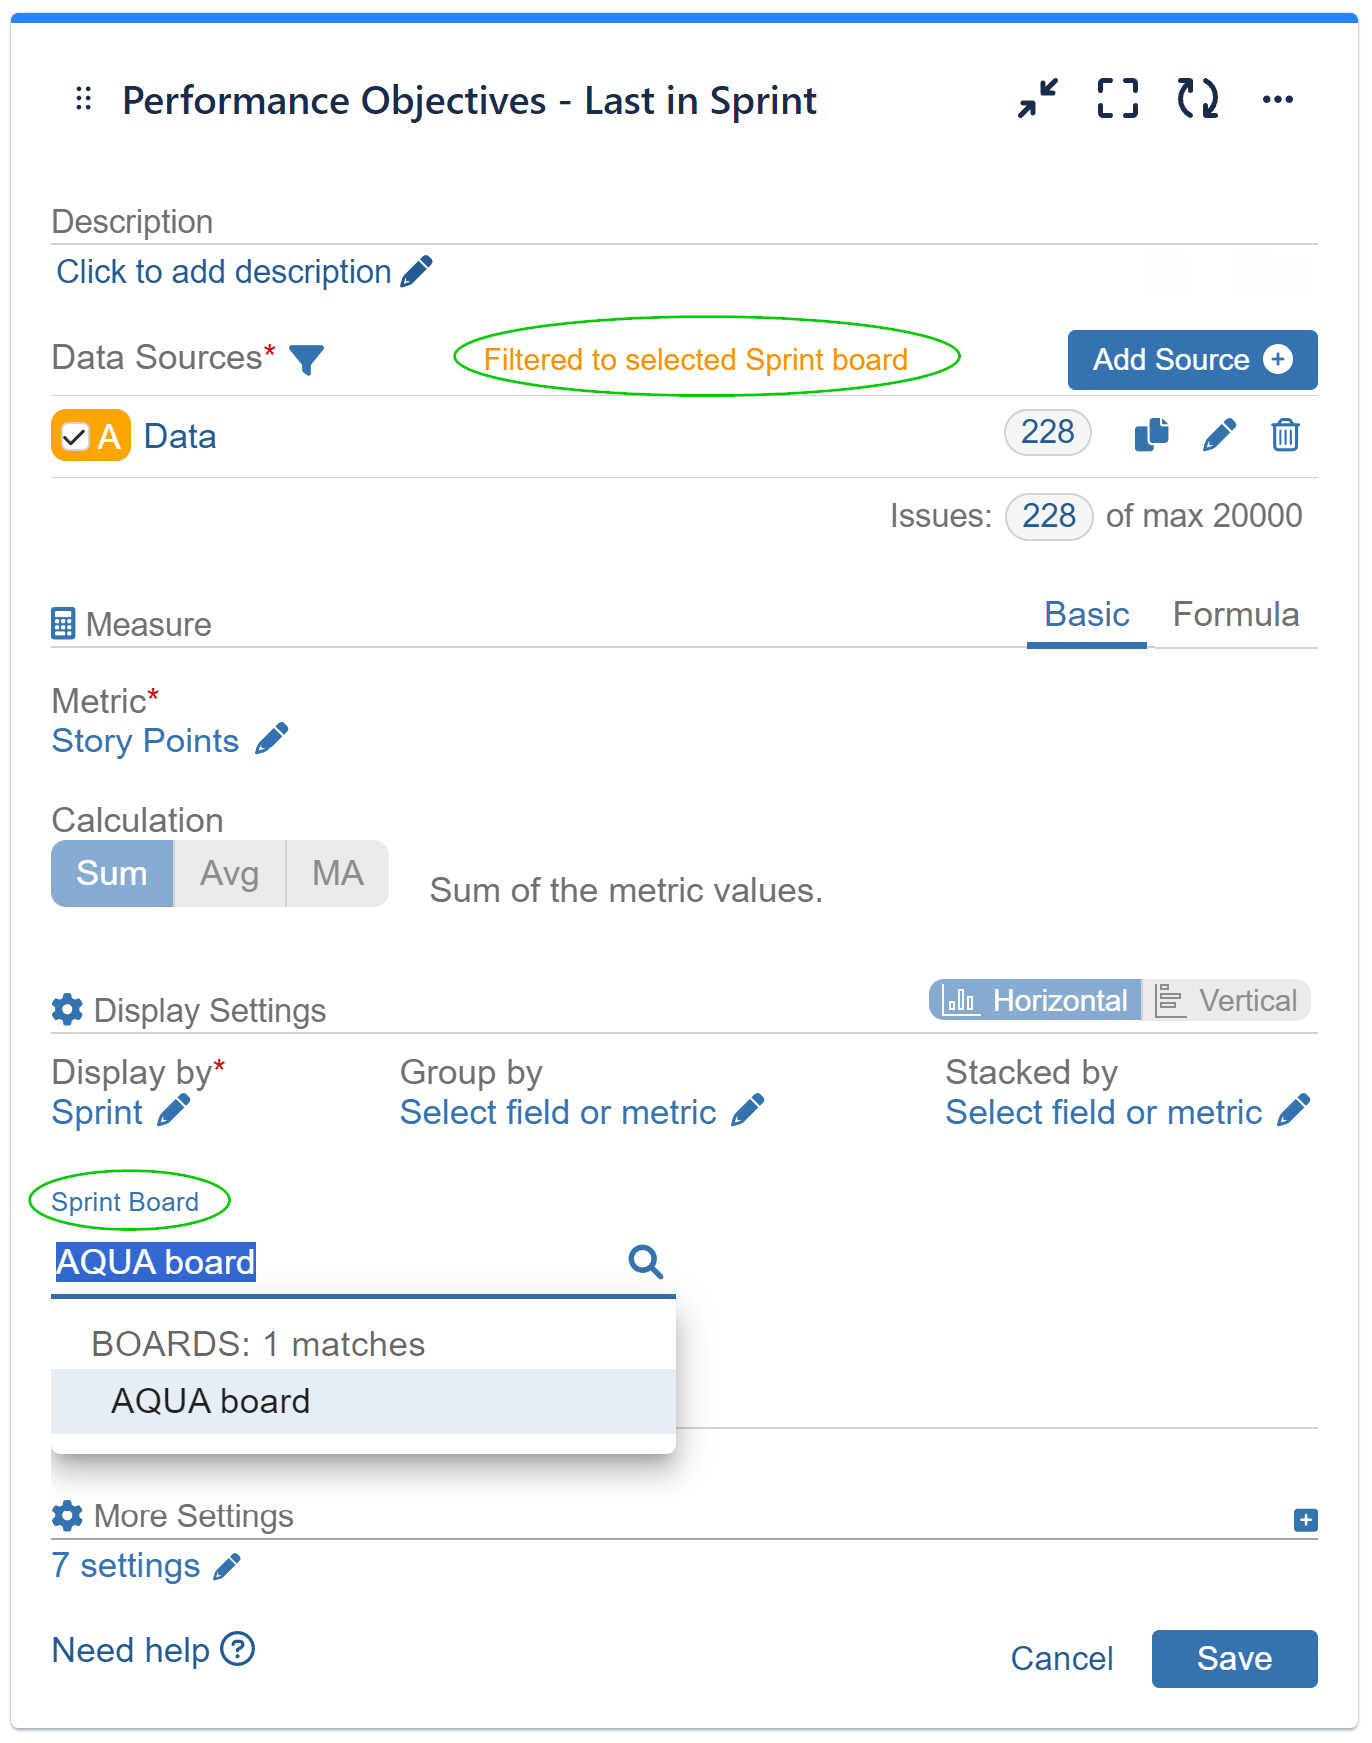
On the sample chart below, we’ve selected the metric ‘Story Points’ and displayed it by the field ‘Sprint’. Additionally, we’ve filtered the Sprint field to only show sprints where Story Points were last present (Last in). Moreover, we have selected a specific Sprint board to generate the report and turned off the Date Range in the Data Source to capture all data related to the selected Sprint board. Selecting a specific board is mandatory and ensures accurate sprint reporting.
Understanding the Composition and Velocity Dynamics with ‘Sprint Commitment State’
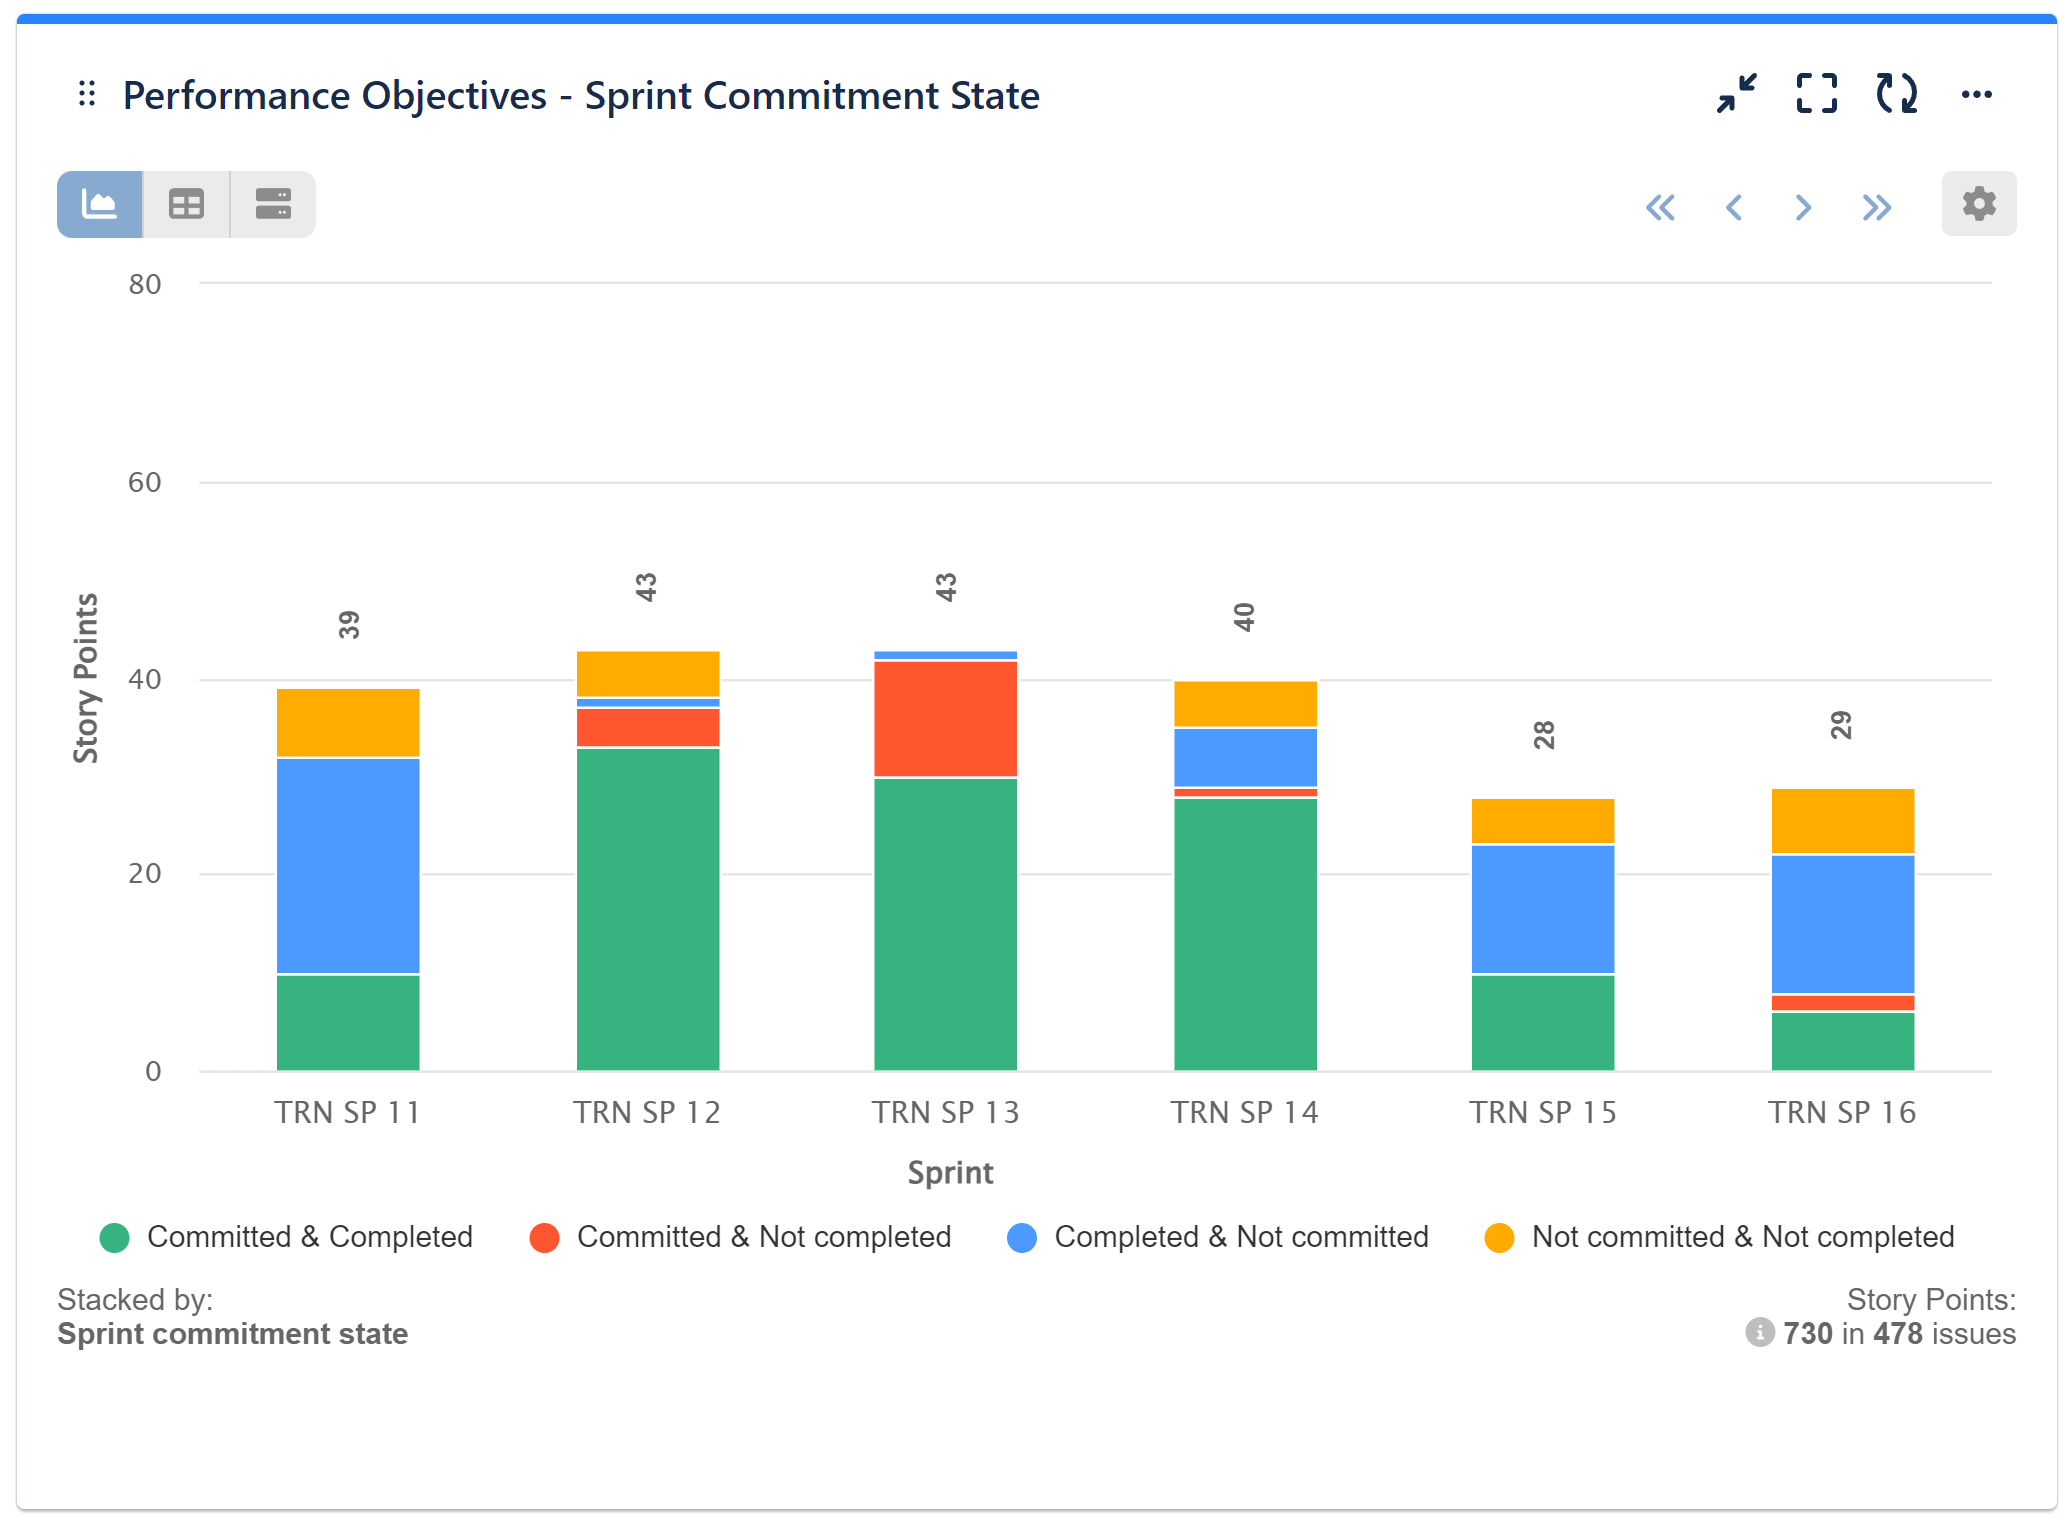
The ‘Sprint Commitment State’ field facilitates grouping or stacking of Story Points or Issues based on their status within a sprint. Here’s a breakdown of the states it encompasses:
- Committed & Completed: Represents issues or story points initially added to the sprint and successfully resolved within it.
- Committed & Not Completed: Signifies issues or story points initially added to the sprint but left unresolved by the end of the sprint.
- Completed & Not Committed: Denotes issues or story points added after the sprint’s start and successfully resolved in it.
- Not Committed & Not Completed: Stands for issues or story points added after the sprint’s start and left unresolved at its conclusion.
By differentiating the state of story points within a sprint, users can gain a more comprehensive understanding of what occurred during the sprint, thereby providing a clearer depiction of their team’s velocity and the composition of the Sprint. This enhanced insight enables teams to make more informed decisions and adjustments to optimize their workflow and sprint planning processes. Here’s a step-by-step guide on configuring a Sprint Commitment State report in Jira.
Analyze Story Points and Rolling Issues In Sprints
The Sprint Rolling State field provides valuable insights into the number of issues or story points that transition from one sprint to the next without being first transitioned back to the backlog. It tracks both the issues or work items newly created within each sprint (New) and those carried over from previous sprints (Rolling) into the subsequent one. This provides a comprehensive view of the flow of work items between sprints, aiding in better understanding and managing your Agile project’s progress and performance.
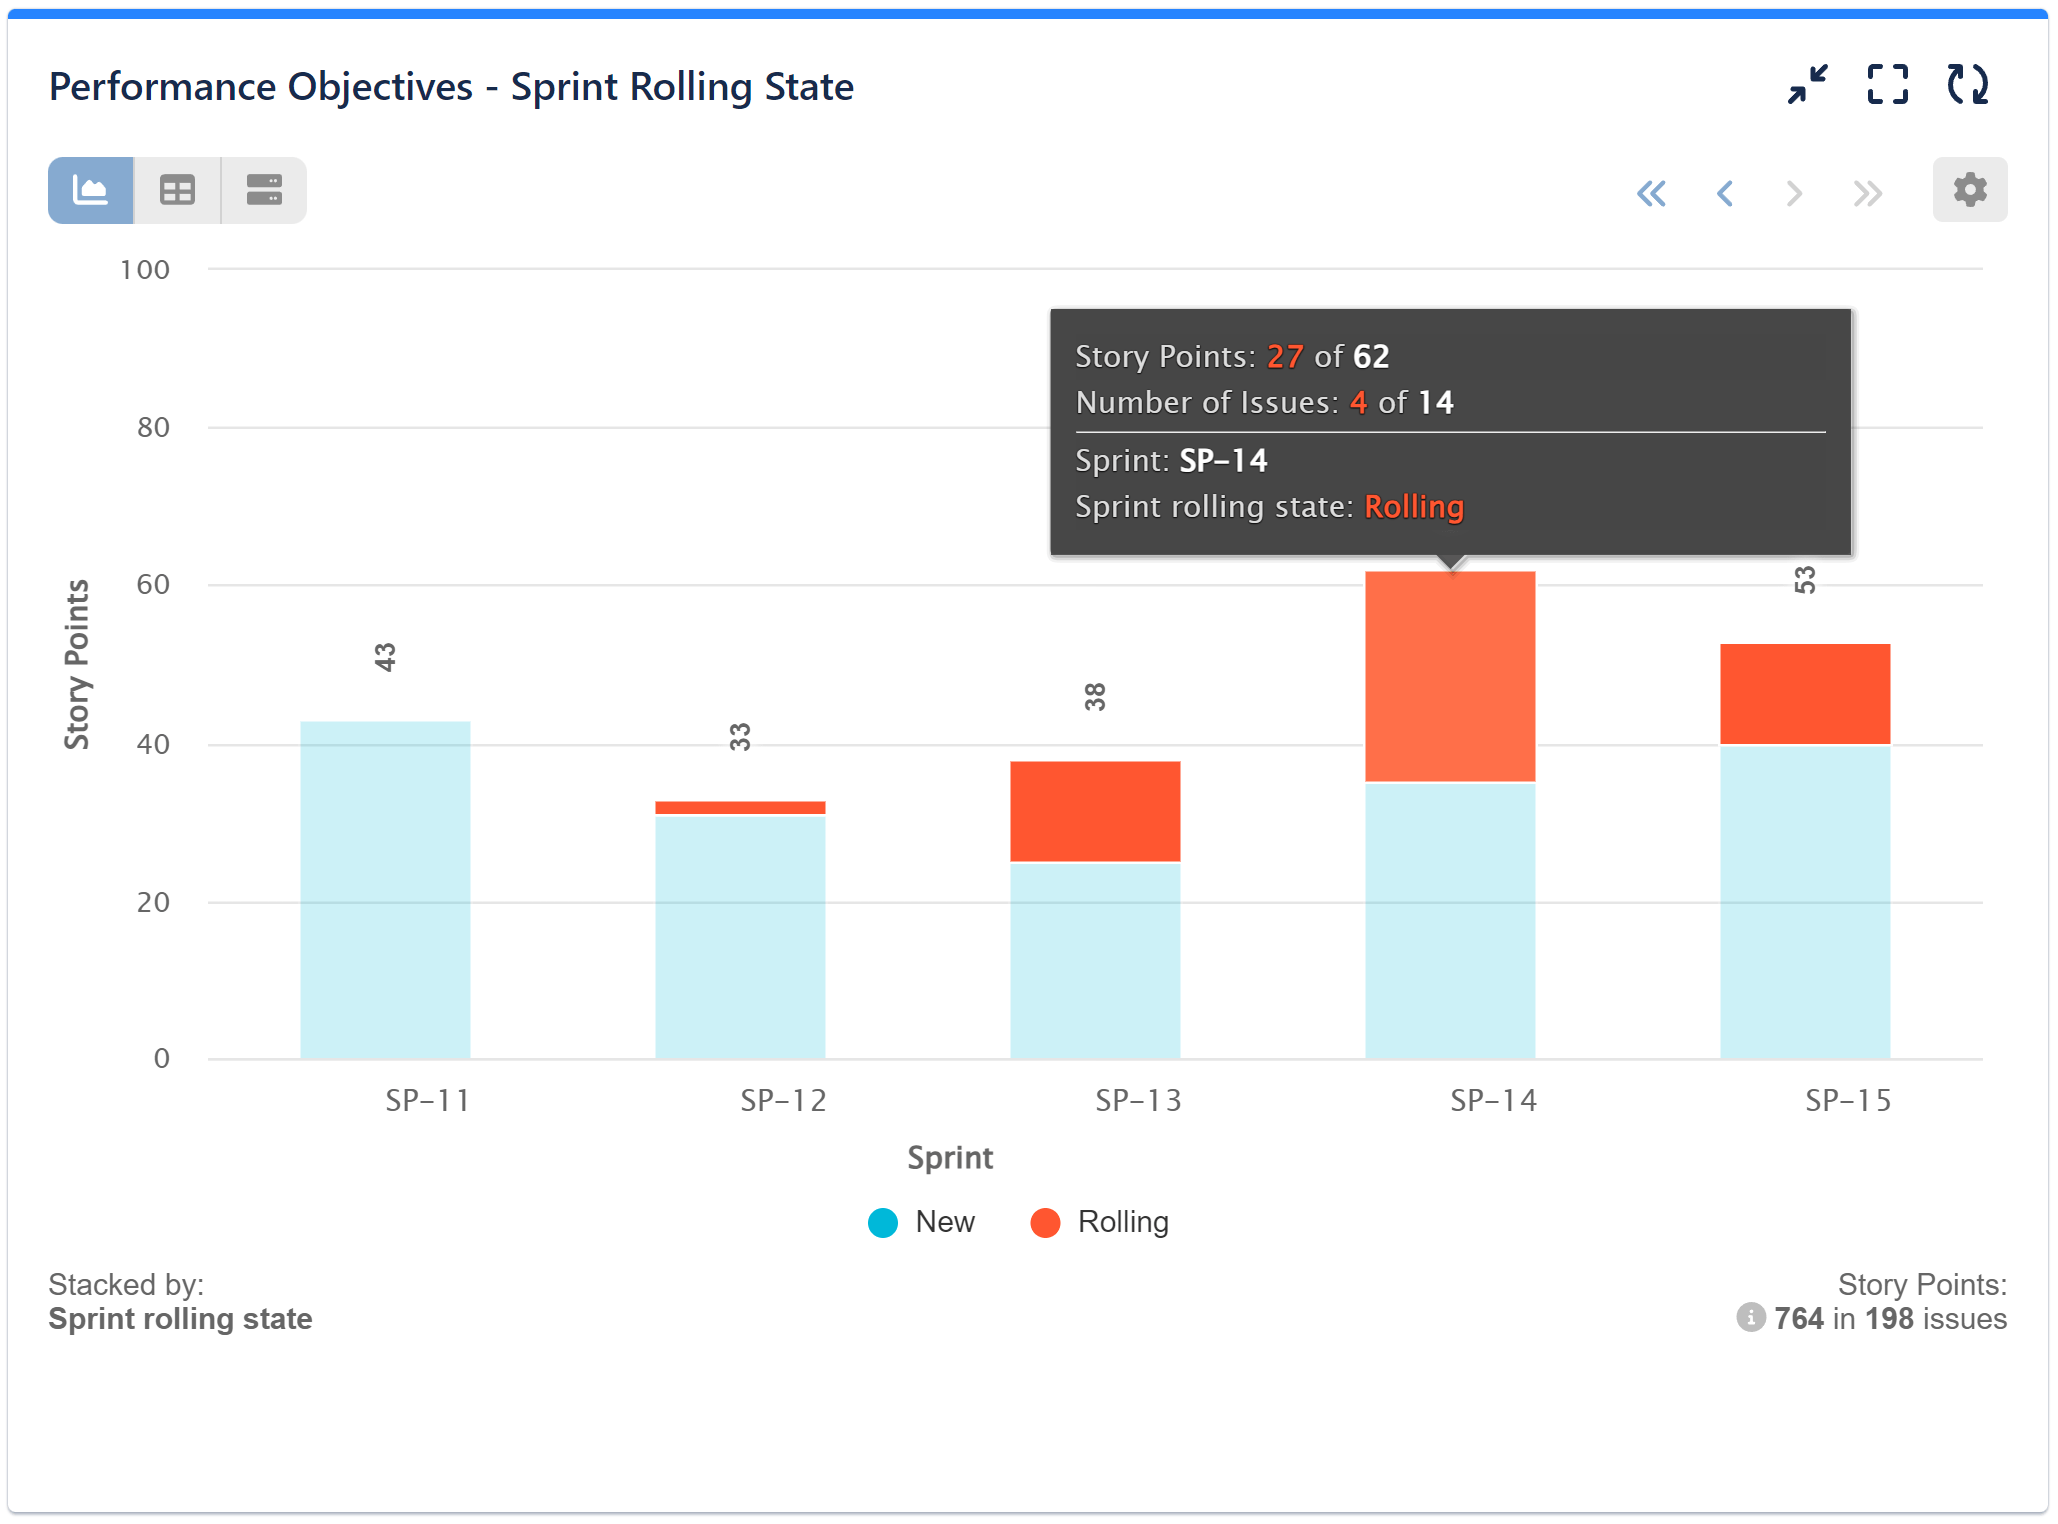
For the sample report above, we have disabled the date range of the data source and have chosen only the appropriate project. Subsequently, we’ve opted for the ‘Story points’ metric and designated the corresponding Sprint Board. For the Display by option, we’ve selected the ‘Sprint’ field with “Last in” option, while for the Stack by, we’ve chosen the ‘Sprint rolling state’ field. Additionally, under More settings, we’ve limited the displayed items per page to the last five. Here’s a step-by-step guide on configuring a Sprint Rolling State report in Jira.
Deeper Insights for Agile Teams with ‘Sprint Completion State’
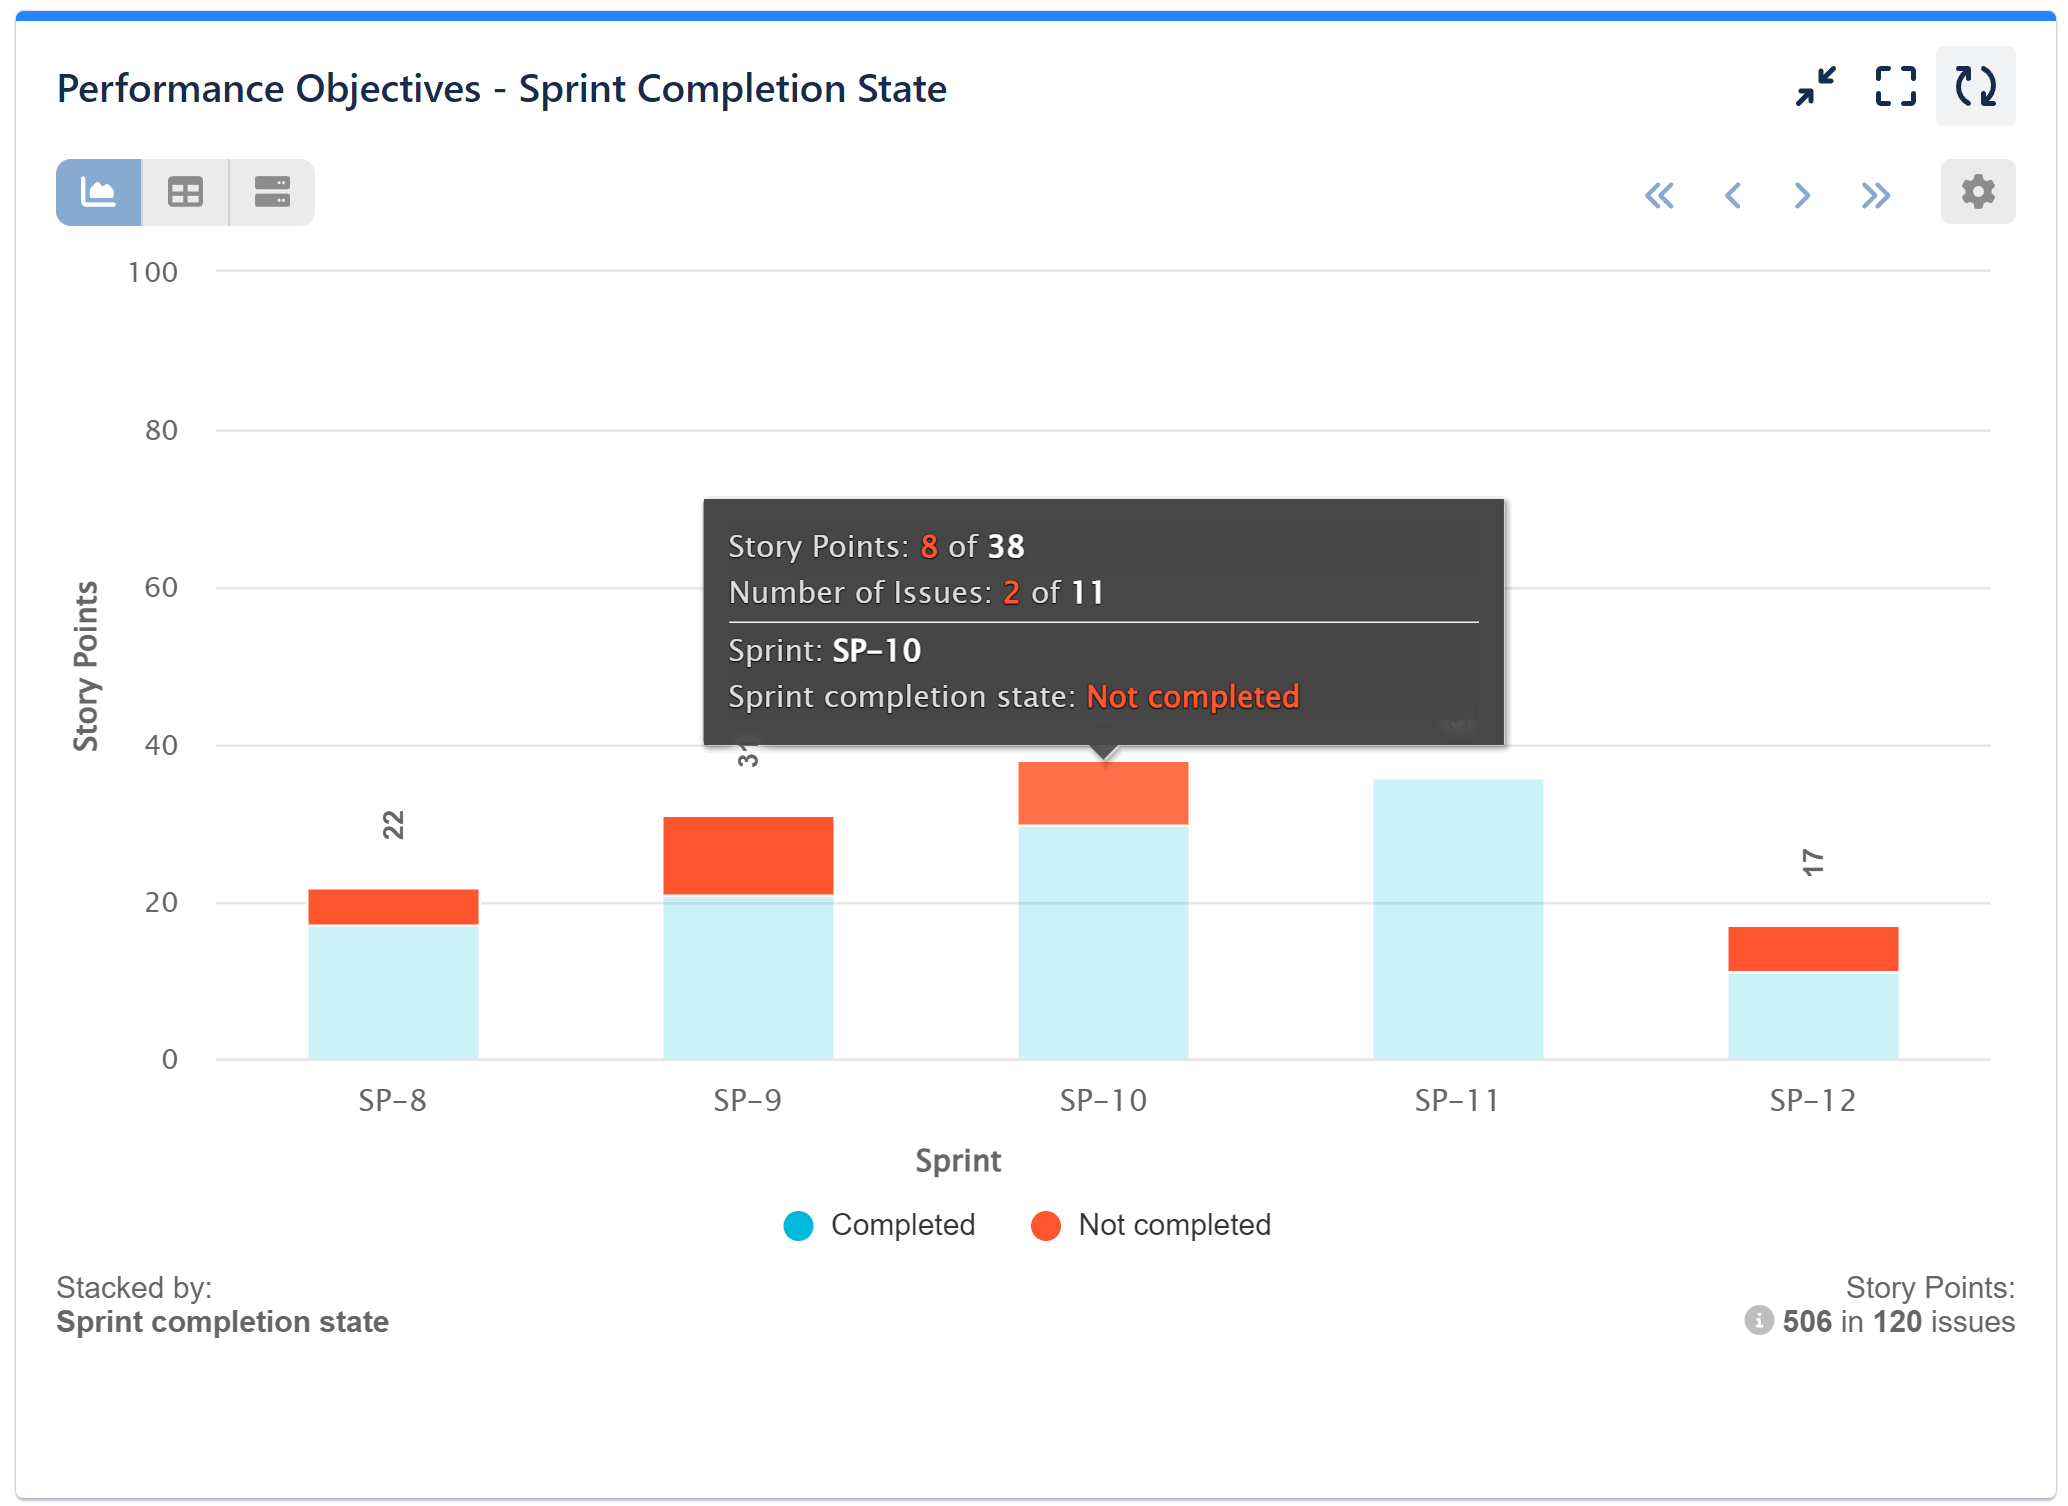
The Sprint Completion State field significantly enhances an Agile team’s grasp of their work efficiency. Completed issues indicate successful task completion, contributing to increased Return on Investment (ROI) and customer satisfaction. On the other hand, Not completed issues shed light on challenges, bottlenecks, or scope creep, allowing teams to address inefficiencies and optimize their workflows during sprint retrospective.
Use this field to visualize the ratio between resolved and unresolved issues within a single sprint or across subsequent sprints over time, as shown in the image below:
Here’s a step-by-step guide on configuring a Sprint Completion State report in Jira.
Track Scope Changes and Manage Scope Creep
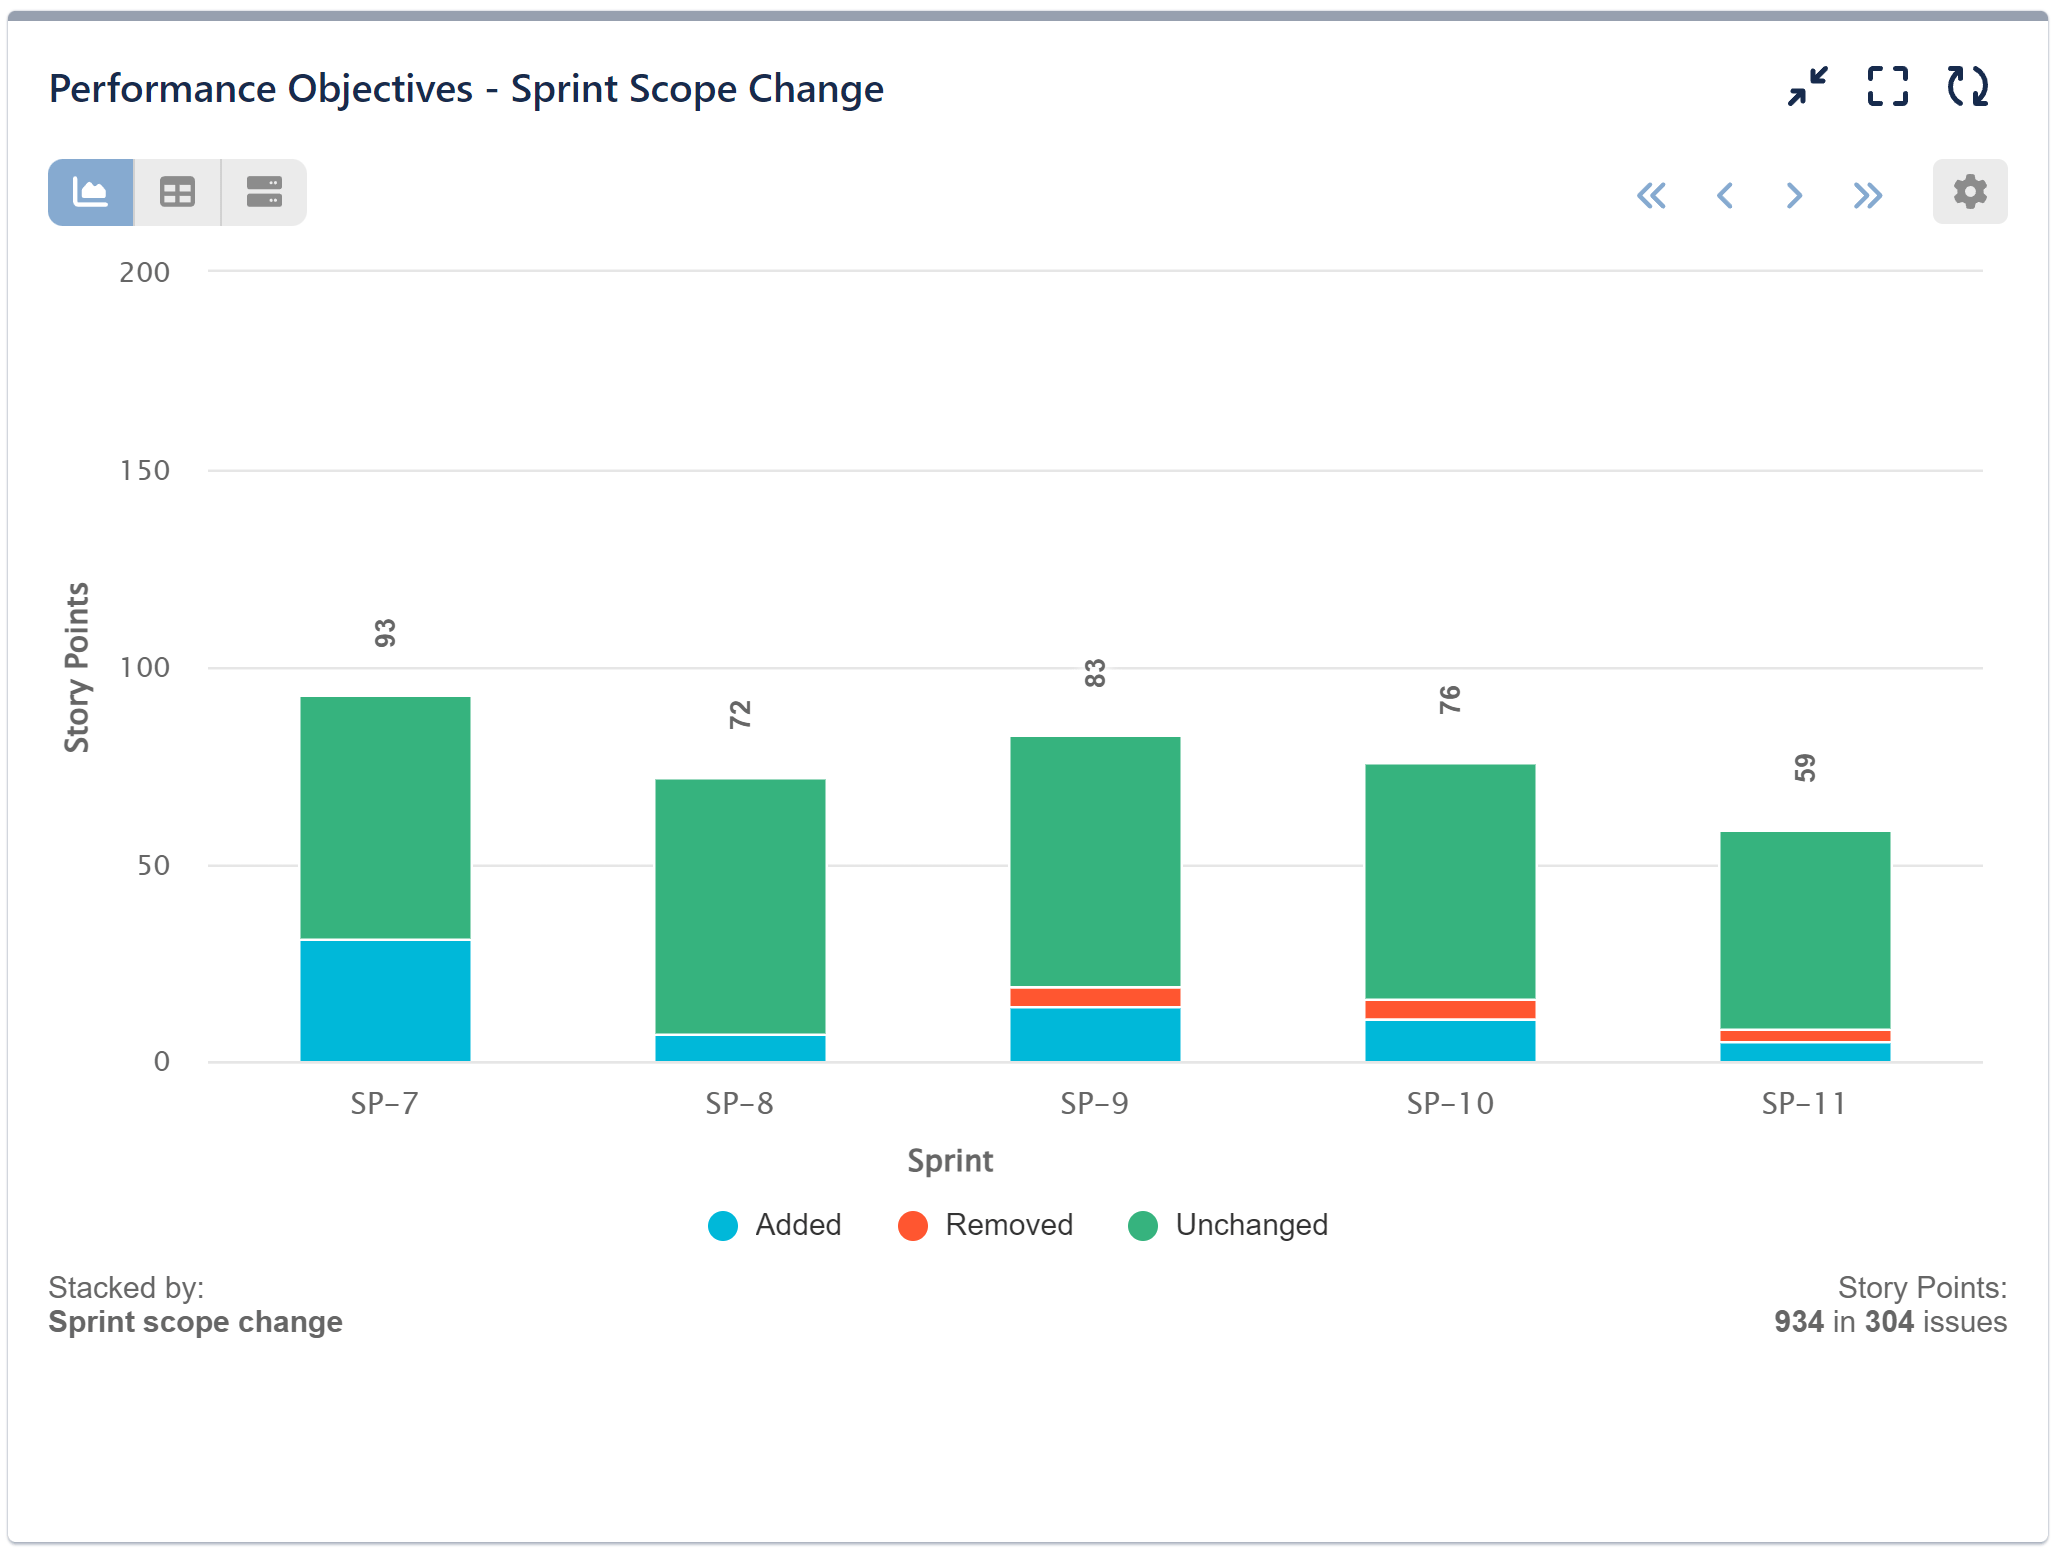
The Sprint Scope Change text field holds significant value for Scrum teams as it enables them to proactively manage potential scope creep and understand the reasons behind any deviations from their sprint goals.
With three distinct issue categories available, teams can precisely track and categorize changes in the sprint scope:
- Unchanged: This category represents the issues or story points that remained consistent and unchanged throughout the sprint. It allows teams to validate the success of their original sprint goal and verify the accuracy of their initial estimation.
- Added: This category indicates the number of stories that were added after the start of the sprint, exceeding the originally committed numbers. A significant number of additions may have potentially impacted the sprint’s focus.
- Removed: This category represents the issues that were removed from the sprint during its execution. By examining these removed items, teams can gain insights into why certain goals were not achieved, and whether context switching played a role in their sprint’s performance.
Here’s a step-by-step guide on configuring this report.
Unveil Issue Iterations with ‘Cycles in sprint’
With the Sprint Rolling State field, you can easily visualize the sum of story points or the number of rolling issues per sprint. Additionally, the ‘Cycles in Sprint’ metric provides valuable insights into how many times an issue moves between sprints. It highlights instances where issues weren’t completed in their original sprints and were carried over to subsequent ones for further work. This metric provides valuable insights into the frequency of such rolling, and can be useful in identifying patterns or issues that may impact sprint planning and execution.
By monitoring the number of times issues move between sprints, teams can identify recurring challenges, potential roadblocks, or underestimations in task complexity. For instance, in a software development project, the use of this metric may reveal that certain types of bugs consistently require multiple sprints to resolve, indicating areas for improvement in bug triaging and testing practices.
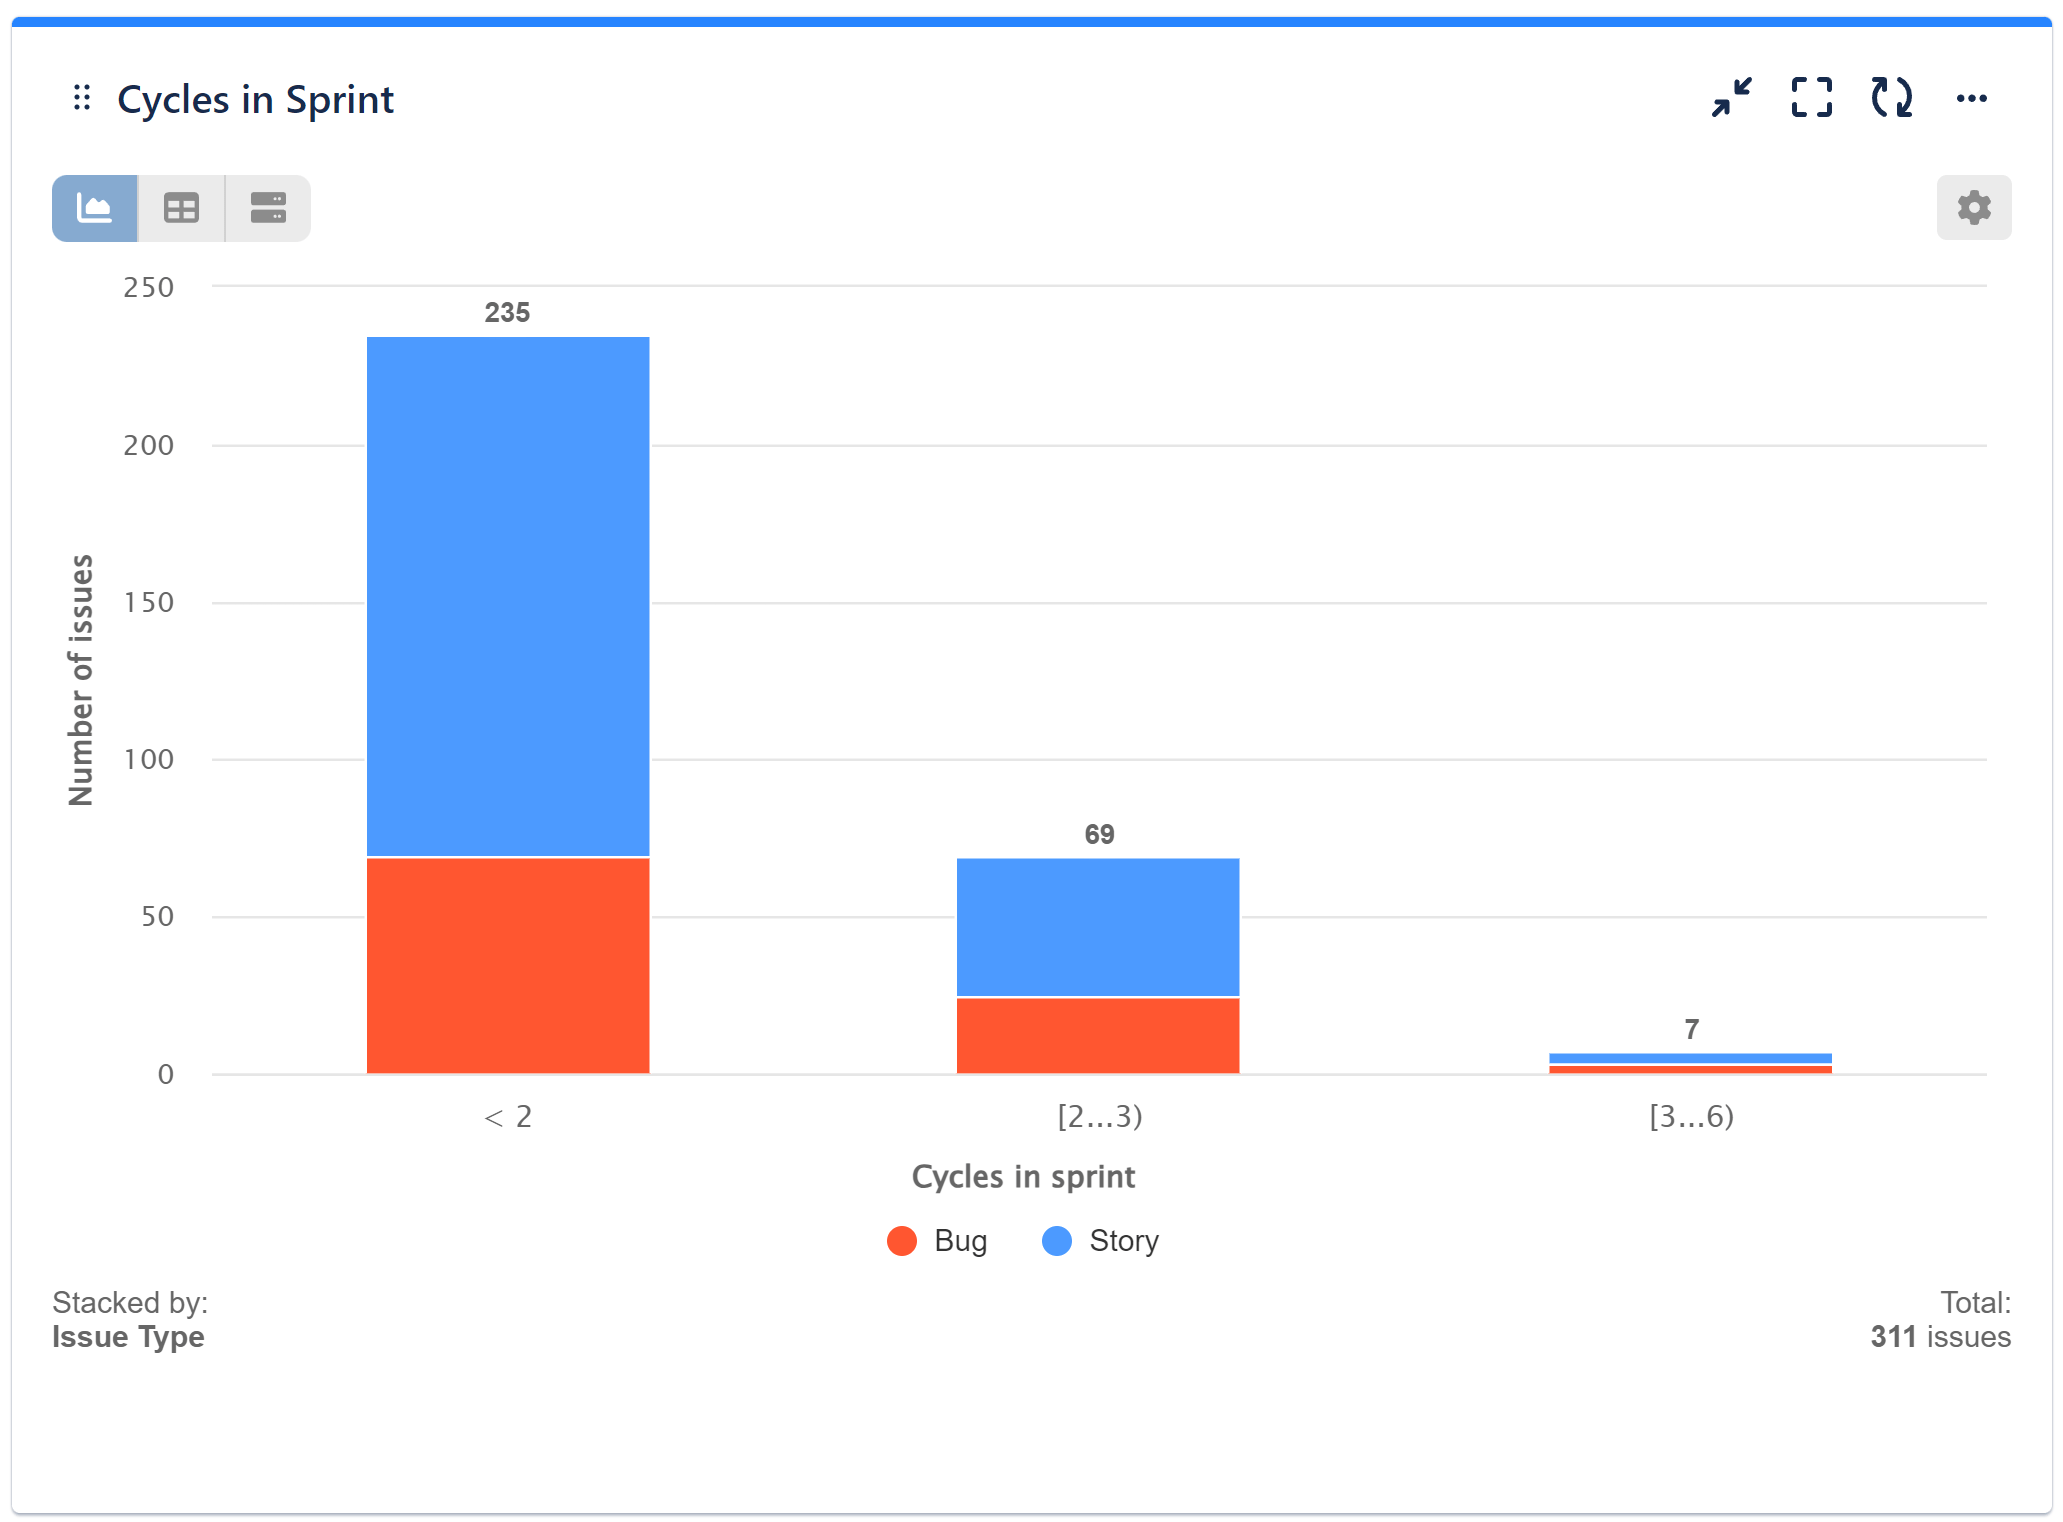
In this chart sample, we have calculated by Number of issues and used ‘Cycles in sprint’ as the display by field. Customize your Slot Splitters to distinguish between issues that rolled once or twice between sprints and those needing immediate attention for excessive movement. Stacked by mode is applied with Issue type for further insightful analysis.
Step-by-step configuration guide for Cycles in Sprint report in Jira.
For a comprehensive list of metrics and fields supported by Performance Objectives – Charts for Jira app, please refer to our Configuration Overview.
Start your 30 days free trial of Performance Objectives: Charts for Jira from Atlassian Marketplace.