Skip to content
Performance Objectives: Charts for Jira
Powerful reporting app for Jira dashboards
  • Home
  • KPI Examples
  • User Guide
  • Blog
  • YouTube

Tag: Getting started

First steps

March 27, 2024 KPI Advisor
FirstSteps1

Take a closer look at each of the available gadgets in the Performance Objectives: Charts for Jira app and explore the best ways to use them.

Continue Reading →

Posted in: Getting Started Filed under: All, Getting started

Chart types overview

March 26, 2024 KPI Advisor
chart types2

Performance Objectives: Charts for Jira app provides a wide range of chart types through its gadgets, allowing you to effectively…

Continue Reading →

Posted in: Getting Started Filed under: All, Getting started

Configuration Overview

March 25, 2024 KPI Advisor
Configuration Overview - Performance Objectives for Jira

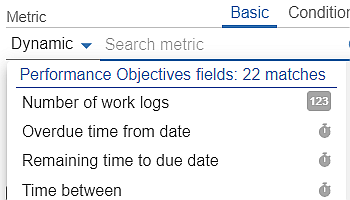
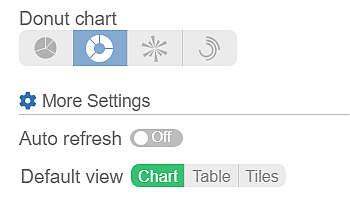
Configuration overview of the app’s robust features and a comprehensive list of Standard and Custom metrics and fields supported by the app, enabling powerful Jira reporting.

Continue Reading →

Posted in: Getting Started Filed under: All, Getting started

Stack by

September 14, 2023 KPI Advisor
StackBy 5

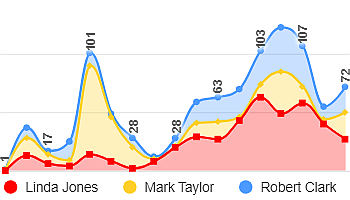
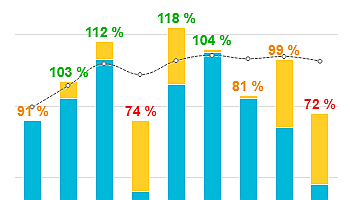
Use Performance Objectives gadgets to create Stacked Area or Stacked Bar charts. Compare data sets within one chart, analyze relationships, and assess relative proportions across categories or dimensions.

Continue Reading →

Posted in: Data Grouping Filed under: All, Data Analysis, Getting started, Metrics

Group by

KPI Advisor
GroupBy1

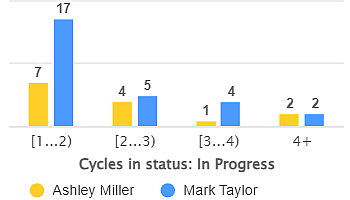
Use ‘Group by’ in Performance Objectives app to break down data by a second dimension, that can be any Jira field, metric, or custom segment.

Continue Reading →

Posted in: Data Grouping, Metrics Filed under: All, Data Analysis, Getting started, Metrics

Data Segmentation & Dimensions

September 10, 2023 KPI Advisor
DataSegmentation

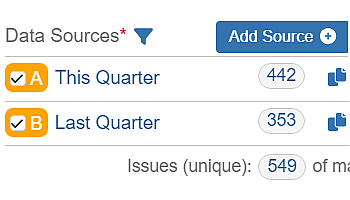
Use Multiple Data Sources for Enhanced Data Segmentation Performance Objectives: Charts for Jira app offers powerful capabilities to segment your…

Continue Reading →

Posted in: Data Segmentation, Getting Started, Metrics, Targets Filed under: All, Data Analysis, Getting started, Metrics

BY CATEGORY

  • expandBlog
  • expandGetting Started
  • expandKPI Reports
  • expandSettings
    • expandCustomization
    • expandDashboard Gadgets
    • expandData Grouping
    • expandData Segmentation
    • expandMetrics
    • expandTargets

BY TAG

  • expandAll
  • expandAll KPIs
  • expandData Analysis
  • expandDevelopment KPIs
  • expandGadgets
  • expandGetting started
  • expandGoals
  • expandMetrics
  • expandOperations KPIs
  • expandProject Delivery KPIs
  • expandQA KPIs
  • expandStyling
LEGEND
pin
Number
calendar_month
Date
timer
Time
abc
Text
people
User
M
Metric
F
Field
lock_open
Dependent Field
check
Supported
horizontal_rule
Not Supported
stacked_bar_chart
Performance Objectives Gadget
area_chart
Performance Trend Gadget
donut_small
Circular Chart Gadget
ssid_chart
Multi Metric Trend Gadget
shape_line
Multi Metric Combined Gadget
scatter_plot
Scatter & Bubble Chart Gadget
space_dashboard
Tree Map Gadget
join_full
Venn Diagramm Gadget
blur_on
Heat Map Gadget
history
Change History Gadget
  • Privacy
  • Support
  • Marketplace
  • SLA
  • EULA
  • Security
  • Status
COOKIE AND PRIVACY POLICY
Copyright © 2024 DevAcrobats Ltd. All rights reserved.