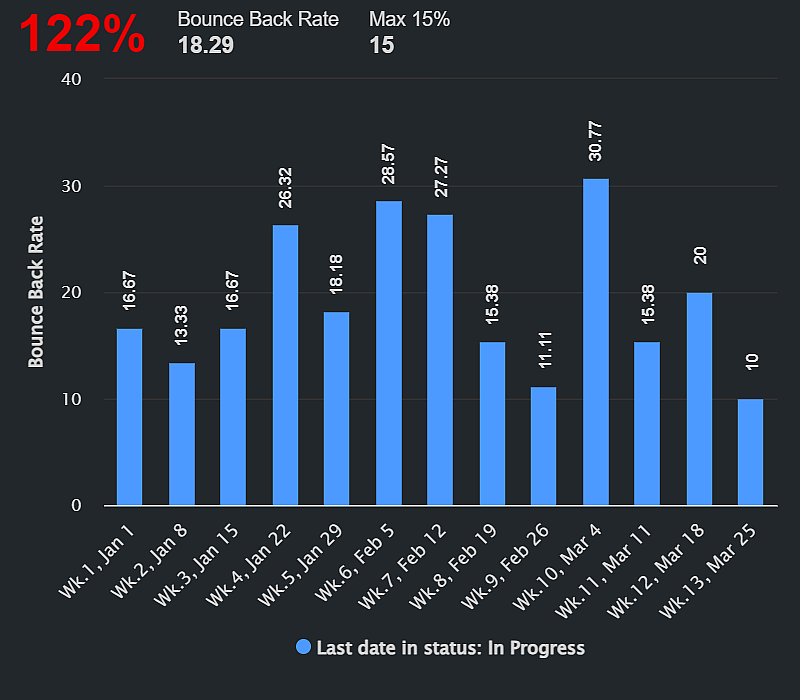
Bounce Back Rate: Why It Matters In agile project management, the Bounce Back Rate is a vital key performance indicator…
Bounce Back Rate: Why It Matters In agile project management, the Bounce Back Rate is a vital key performance indicator…
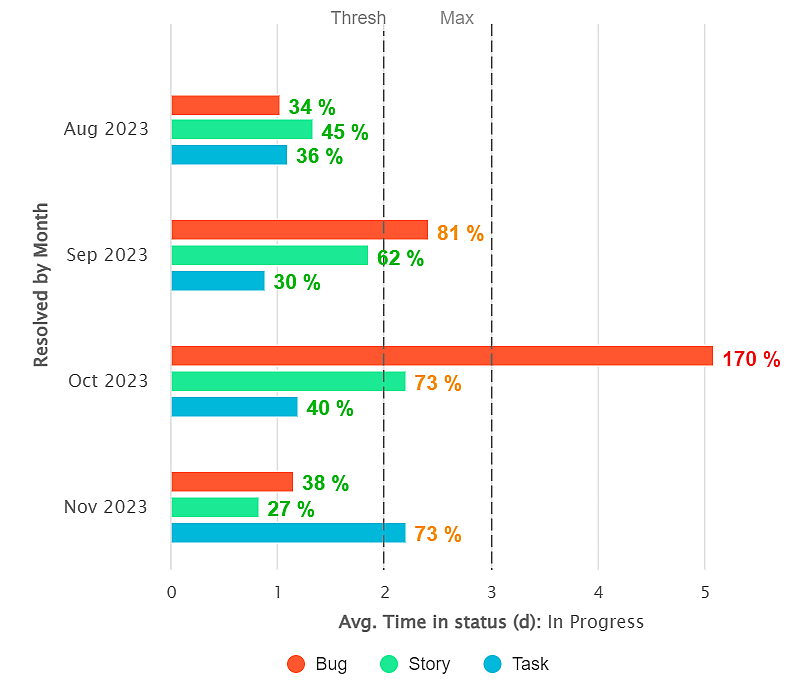
Cycle Time is defined as the time spent working on an issue and is calculated as the time between the…
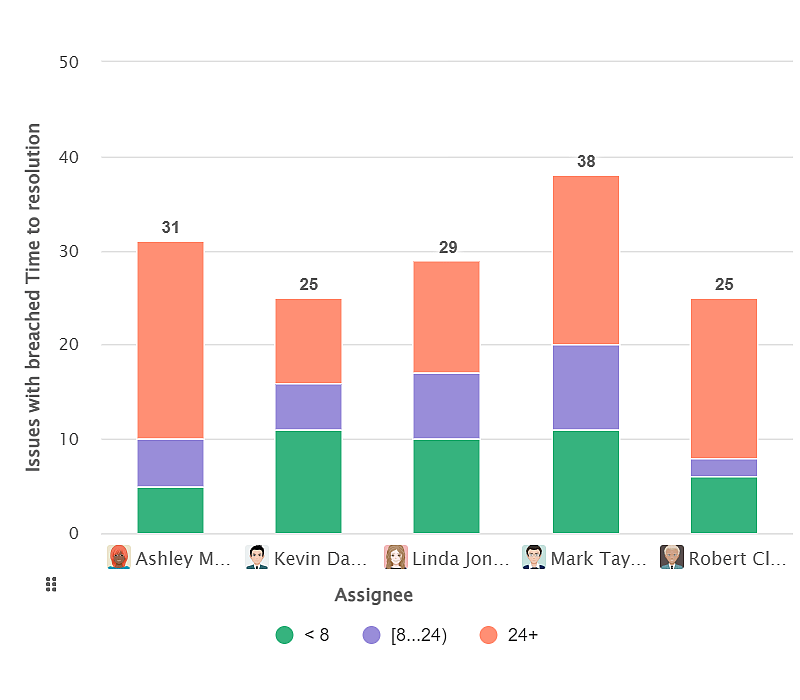
Enhance SLA metrics by calculating mean time to resolve issues using Performance Objectives app.
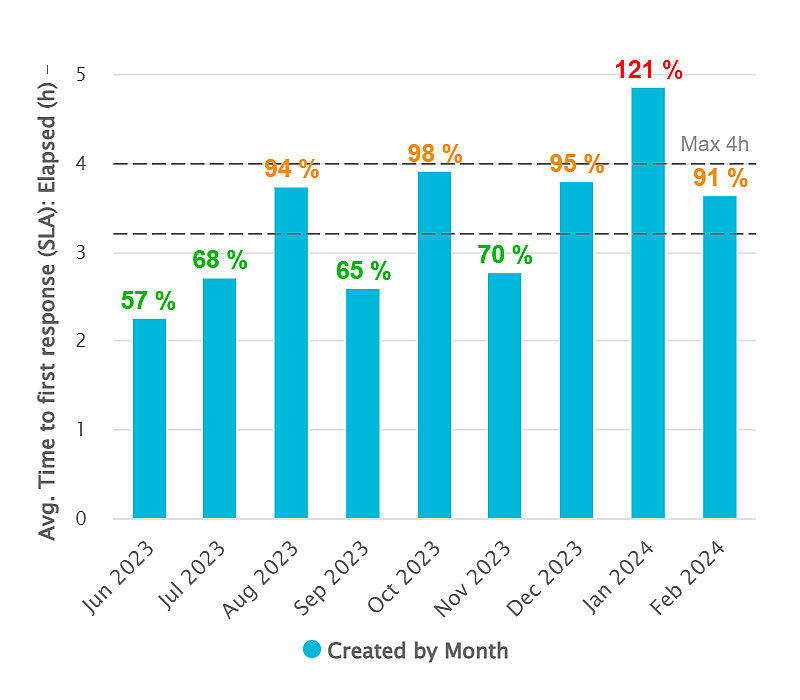
If you operate within a support center or help desk, monitoring the Time to First Response is crucial for evaluating…
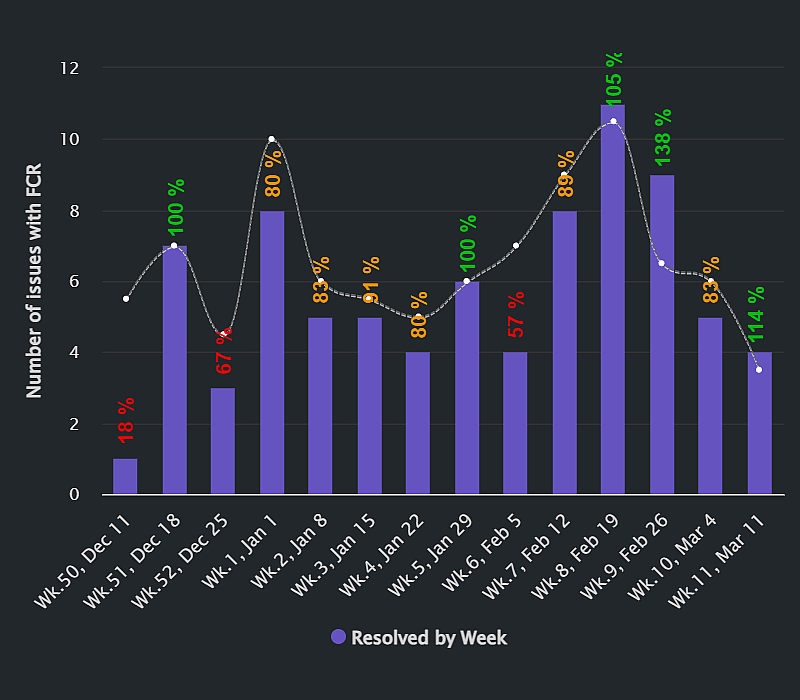
Create report and set target for % of requests resolved on first interaction.
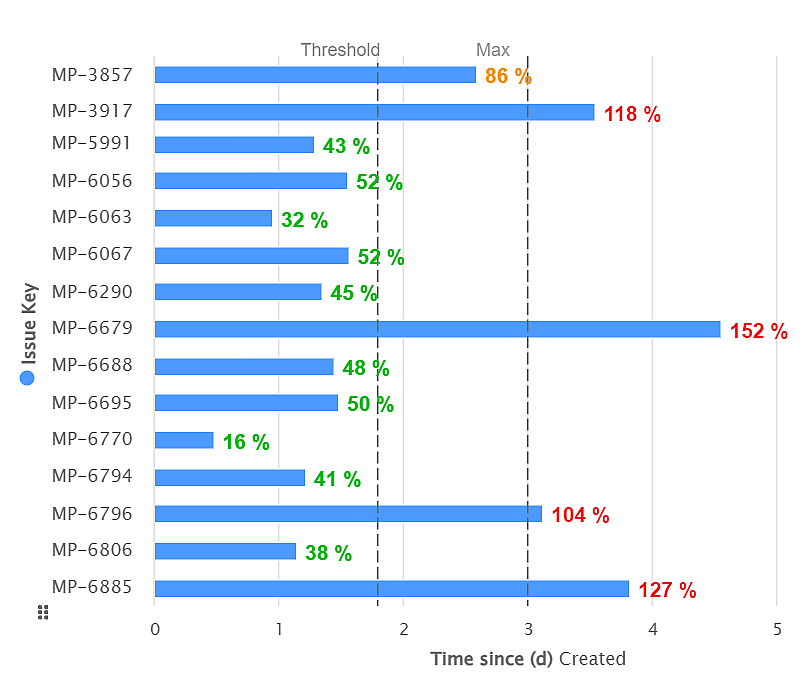
Use ‘Time since’ metric to track time since any standard or custom Jira date field.
Gain insights via Status Count analysis for enhanced team performance.
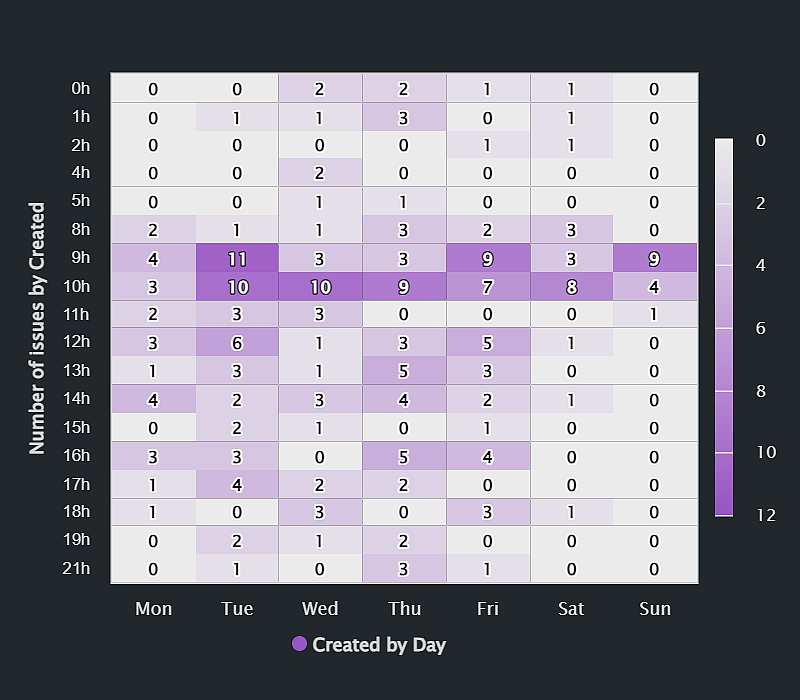
Create comprehensive reports based on timeframes like day, week, or month. Identify busy periods, plan shift coverage, and enhance support operations. Gain valuable insights and make informed decisions in Jira and Jira Service Management (JSM).
In this guide, we present various configurations to effectively track and visualize SLA breaches on your Jira Service Management dashboard.…
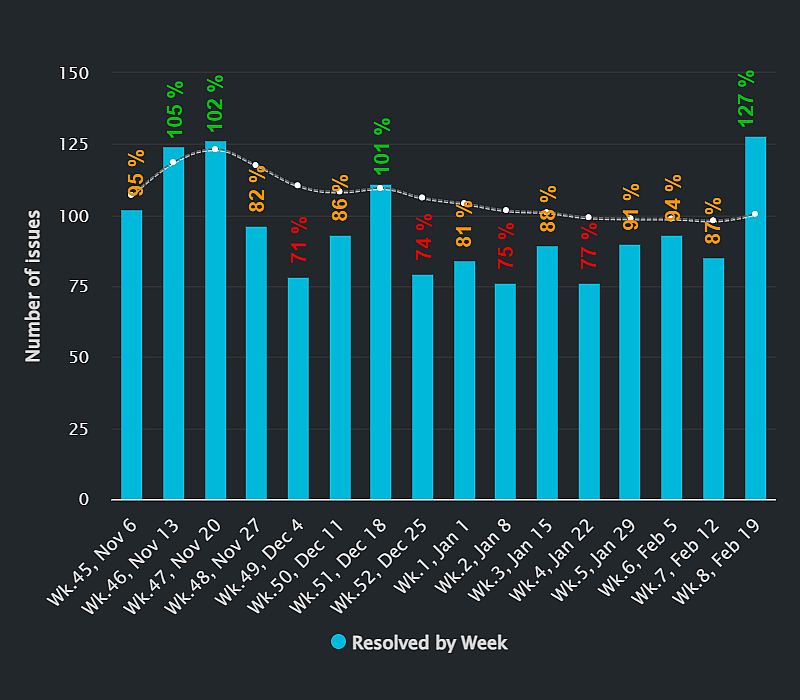
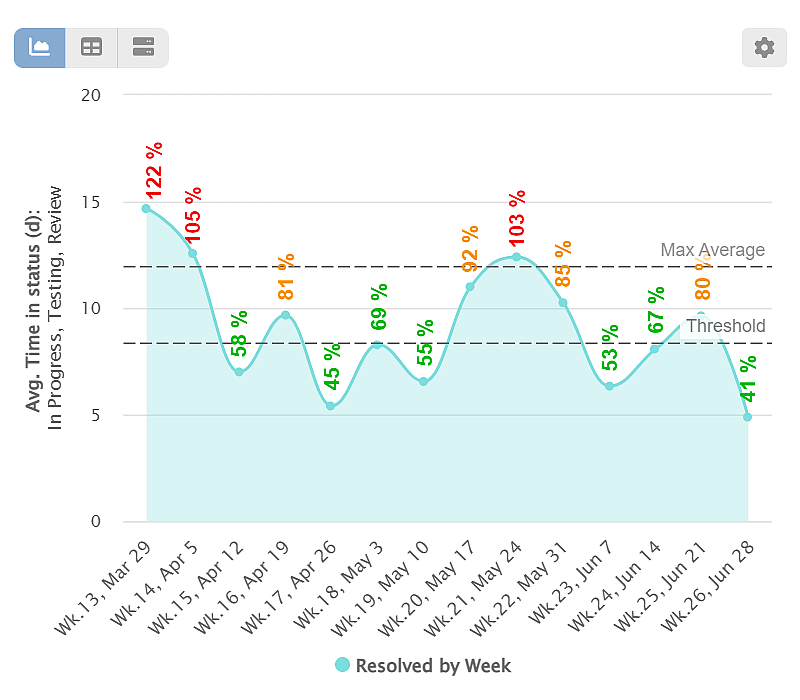
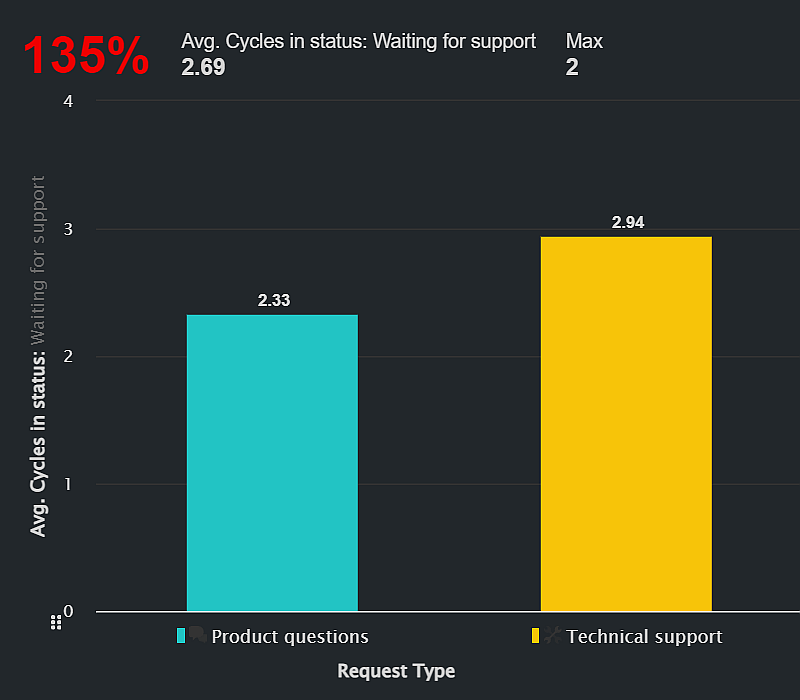
Set dynamic targets using Moving Average as a percentage with Performance Objectives app.