Table of Contents
In this guide, we present various configurations to effectively track and visualize SLA breaches on your Jira Service Management dashboard. Whether you’re focused on individual performance or team-wide metrics, these setups offer rich data visualization options.
In the following examples we are using JSM SLA metric ‘Time to resolution’, you can use any other SLA Metric you track in your JSM instance, e.g., ‘Time to first response’, ‘Time of comment’, etc.
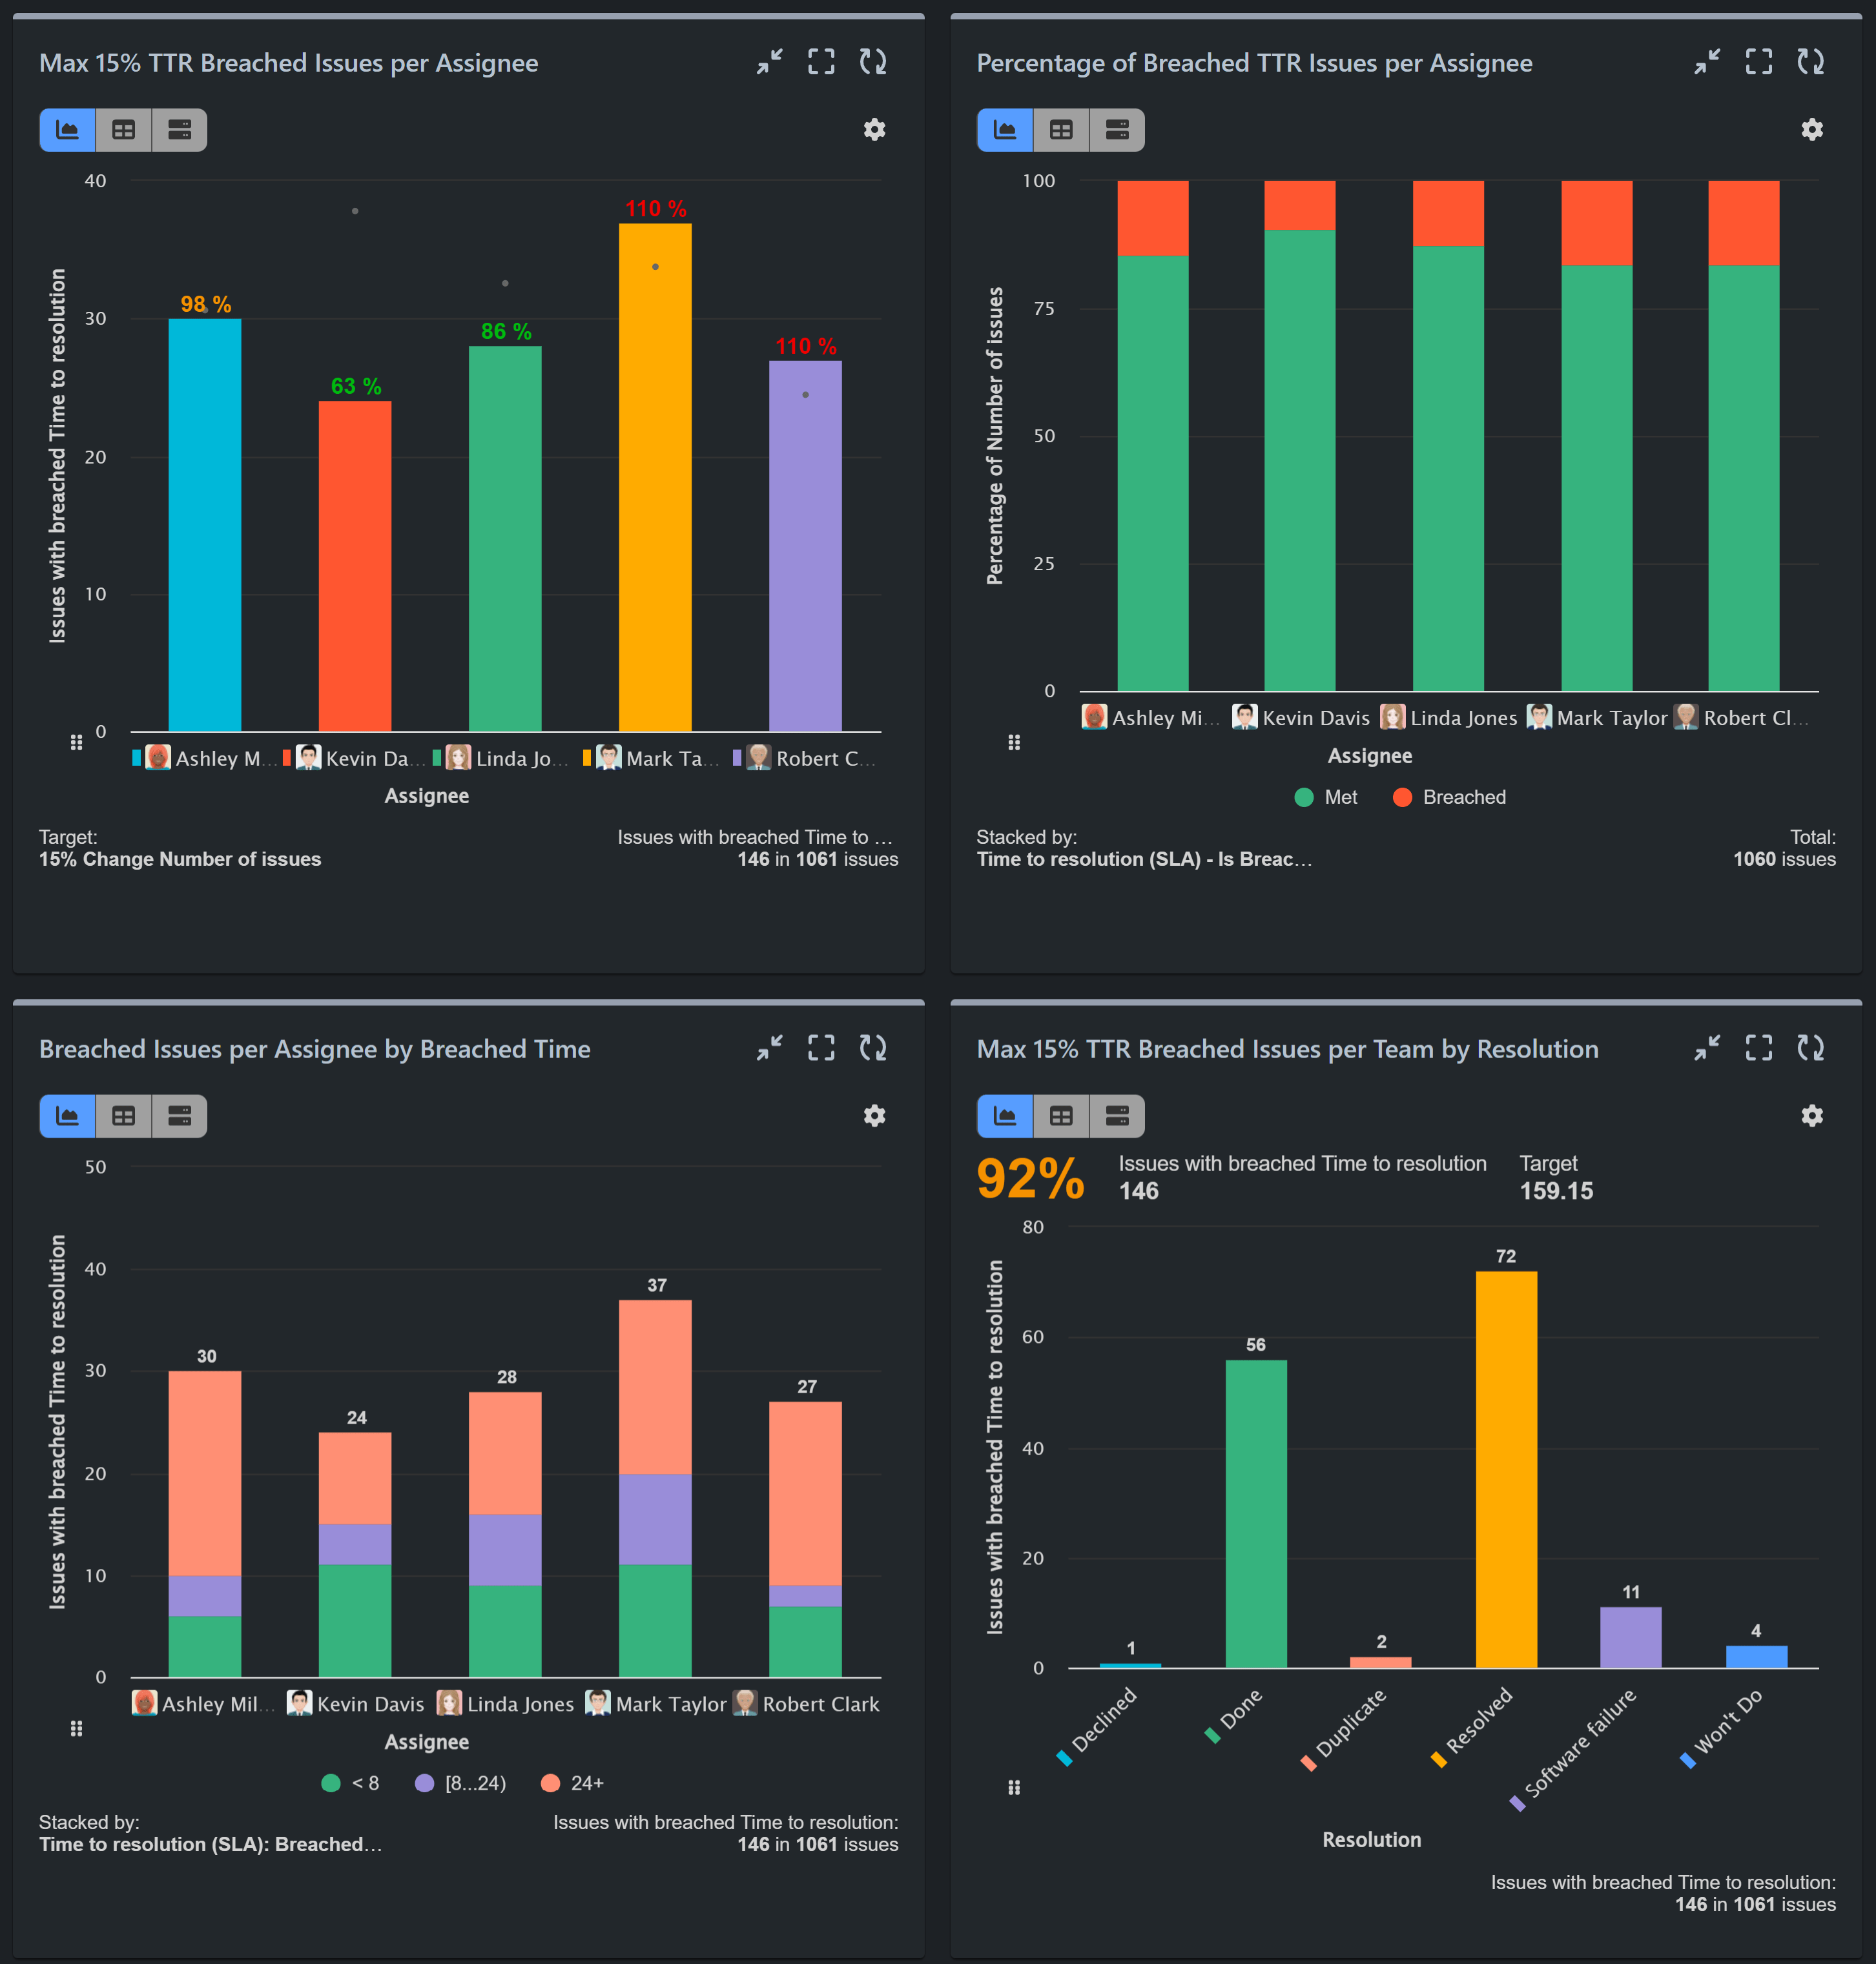
Display Percentage of Issues with SLA Breached Time to Resolution per Assignee
Utilize the ‘Performance Objectives’ Dashboard gadget for a straightforward setup. This chart provides a clear visualization while offering comprehensive insights into breached issues per assignee. Refer to the accompanying video for step-by-step configuration instructions.
Track Target for Max % of SLA Breached Issues by Assignee
For a more granular view of individual performance against targets, follow this configuration. Set a target using the ‘% Change’ section to calculate the percentage of completion per assignee based on their respective number of issues.
You can further refine this visualization by stacking the data by issue type, priority, or other relevant fields.
Set Overall Target for Max % of SLA Breached Issues by Team, displayed by Resolution
In this section, we embark on creating a comprehensive report to evaluate and monitor the collective performance of the entire team in adhering to the Time to Resolution SLA. This involves setting an overall target for the maximum percentage of breached issues relative to all resolved issues.
In our previous configuration, we employed the conditional metric feature available in the Performance Objectives app to filter breached issues effectively.
Alternatively, users can utilize Jira Query Language (JQL) within the data source to filter specifically for breached issues. Use one of the following queries:
- “Time to resolution” = breached() filters out issues that failed to meet their target goal during their last SLA cycle.
- “Time to resolution” = everBreached() filters out issues that have ever failed to meet their target goal.
To effectively track these filtered issues against all resolved ones, it’s necessary to configure two distinct data sources: one containing all resolved issues and another solely comprising breached issues.
This approach allows for further exploration of the breached issue list through the Jira navigator.
We are showcasing this approach in the following video configuration:
Report on Breached Issues by Assignee by Breached Time
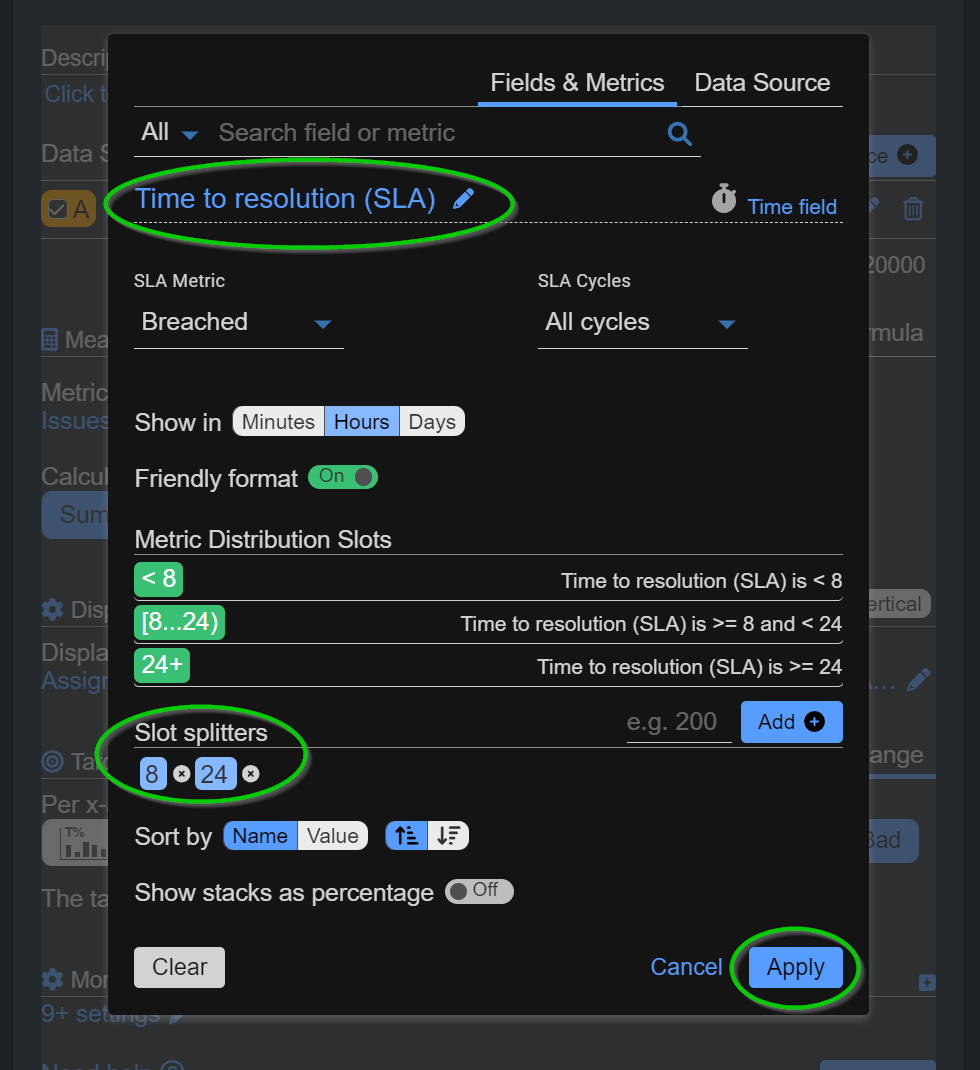
The Performance Objectives: Charts for Jira app offers an advanced Metric distribution feature, empowering users to leverage SLA metrics as fields and segment them into customized distribution slots through the ‘Slot Splitters’ functionality. This feature significantly enhances SLA metric management by furnishing actionable insights into compliance and performance directly within Jira dashboards.
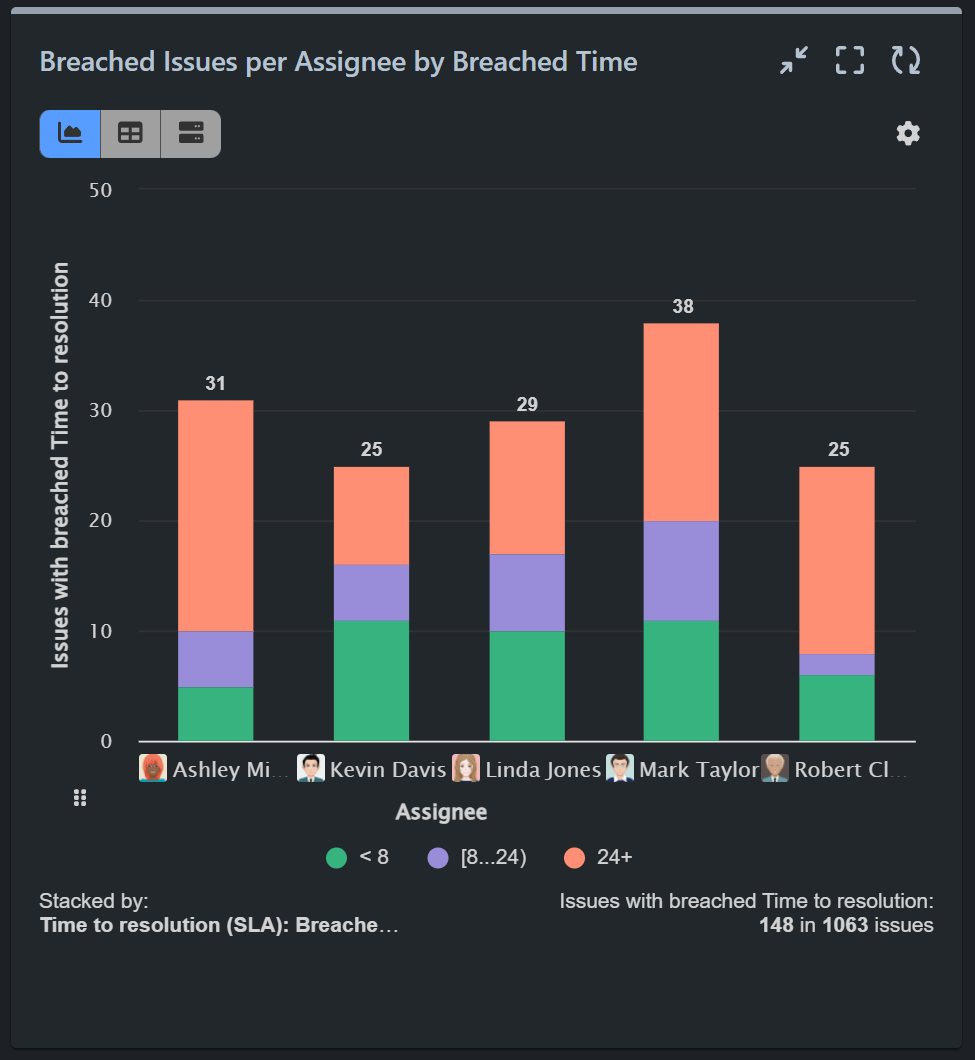
The last configuration in our SLA KPIs dedicated article introduces a comprehensive report that not only presents breached issues by assignee but also provides insights into the time duration of these breaches.
To generate this insightful report, utilize the configuration outlined earlier for tracking the maximum percentage of breached issues by assignee. Disable the target section, and add a ‘Stack by’ the ‘Time to Resolution SLA’ metric, as demonstrated in the left screen. The resulting chart, showcasing this configuration, is depicted on the right, offering a detailed visualization of breached issues alongside their corresponding breached time frames.
For a video guide on applying slot splitters, please refer to the SLA Metrics article.
These configurations offer versatile ways to monitor and analyze SLA KPIs within your Jira Service Management. Experiment with different setups utilizing the Performance Objectives app to find the one that best suits your needs.
Start your 30 days free trial of Performance Objectives: Charts for Jira from Atlassian Marketplace.