If you operate within a support center or help desk, monitoring the Time to First Response is crucial for evaluating service quality.
First Response Time (FRT) represents the elapsed time between a customer raising an issue (such as a support ticket) and the moment an agent provides the first interaction or response. Companies often include a baseline FRT in their Service Level Agreements (SLAs), which means they commit to responding to customers within a specified timeframe.
Key points about FRT:
- Efficiency Indicator: FRT reflects the efficiency of your customer service department in addressing newly created support tickets.
- Business Hours: Unless your support coverage is 24/7, it’s best to measure First Response Time during business hours. This ensures that requests received during nights or weekends don’t skew the results.
- Positive First Impression: A fast initial response sets a positive tone for customer interactions. Even a brief acknowledgment that their issue is being looked into can make a difference.
Our app provides versatile methods to configure and track this KPI on your Jira dashboard using your existing Jira data. Here’s how you can set it up:
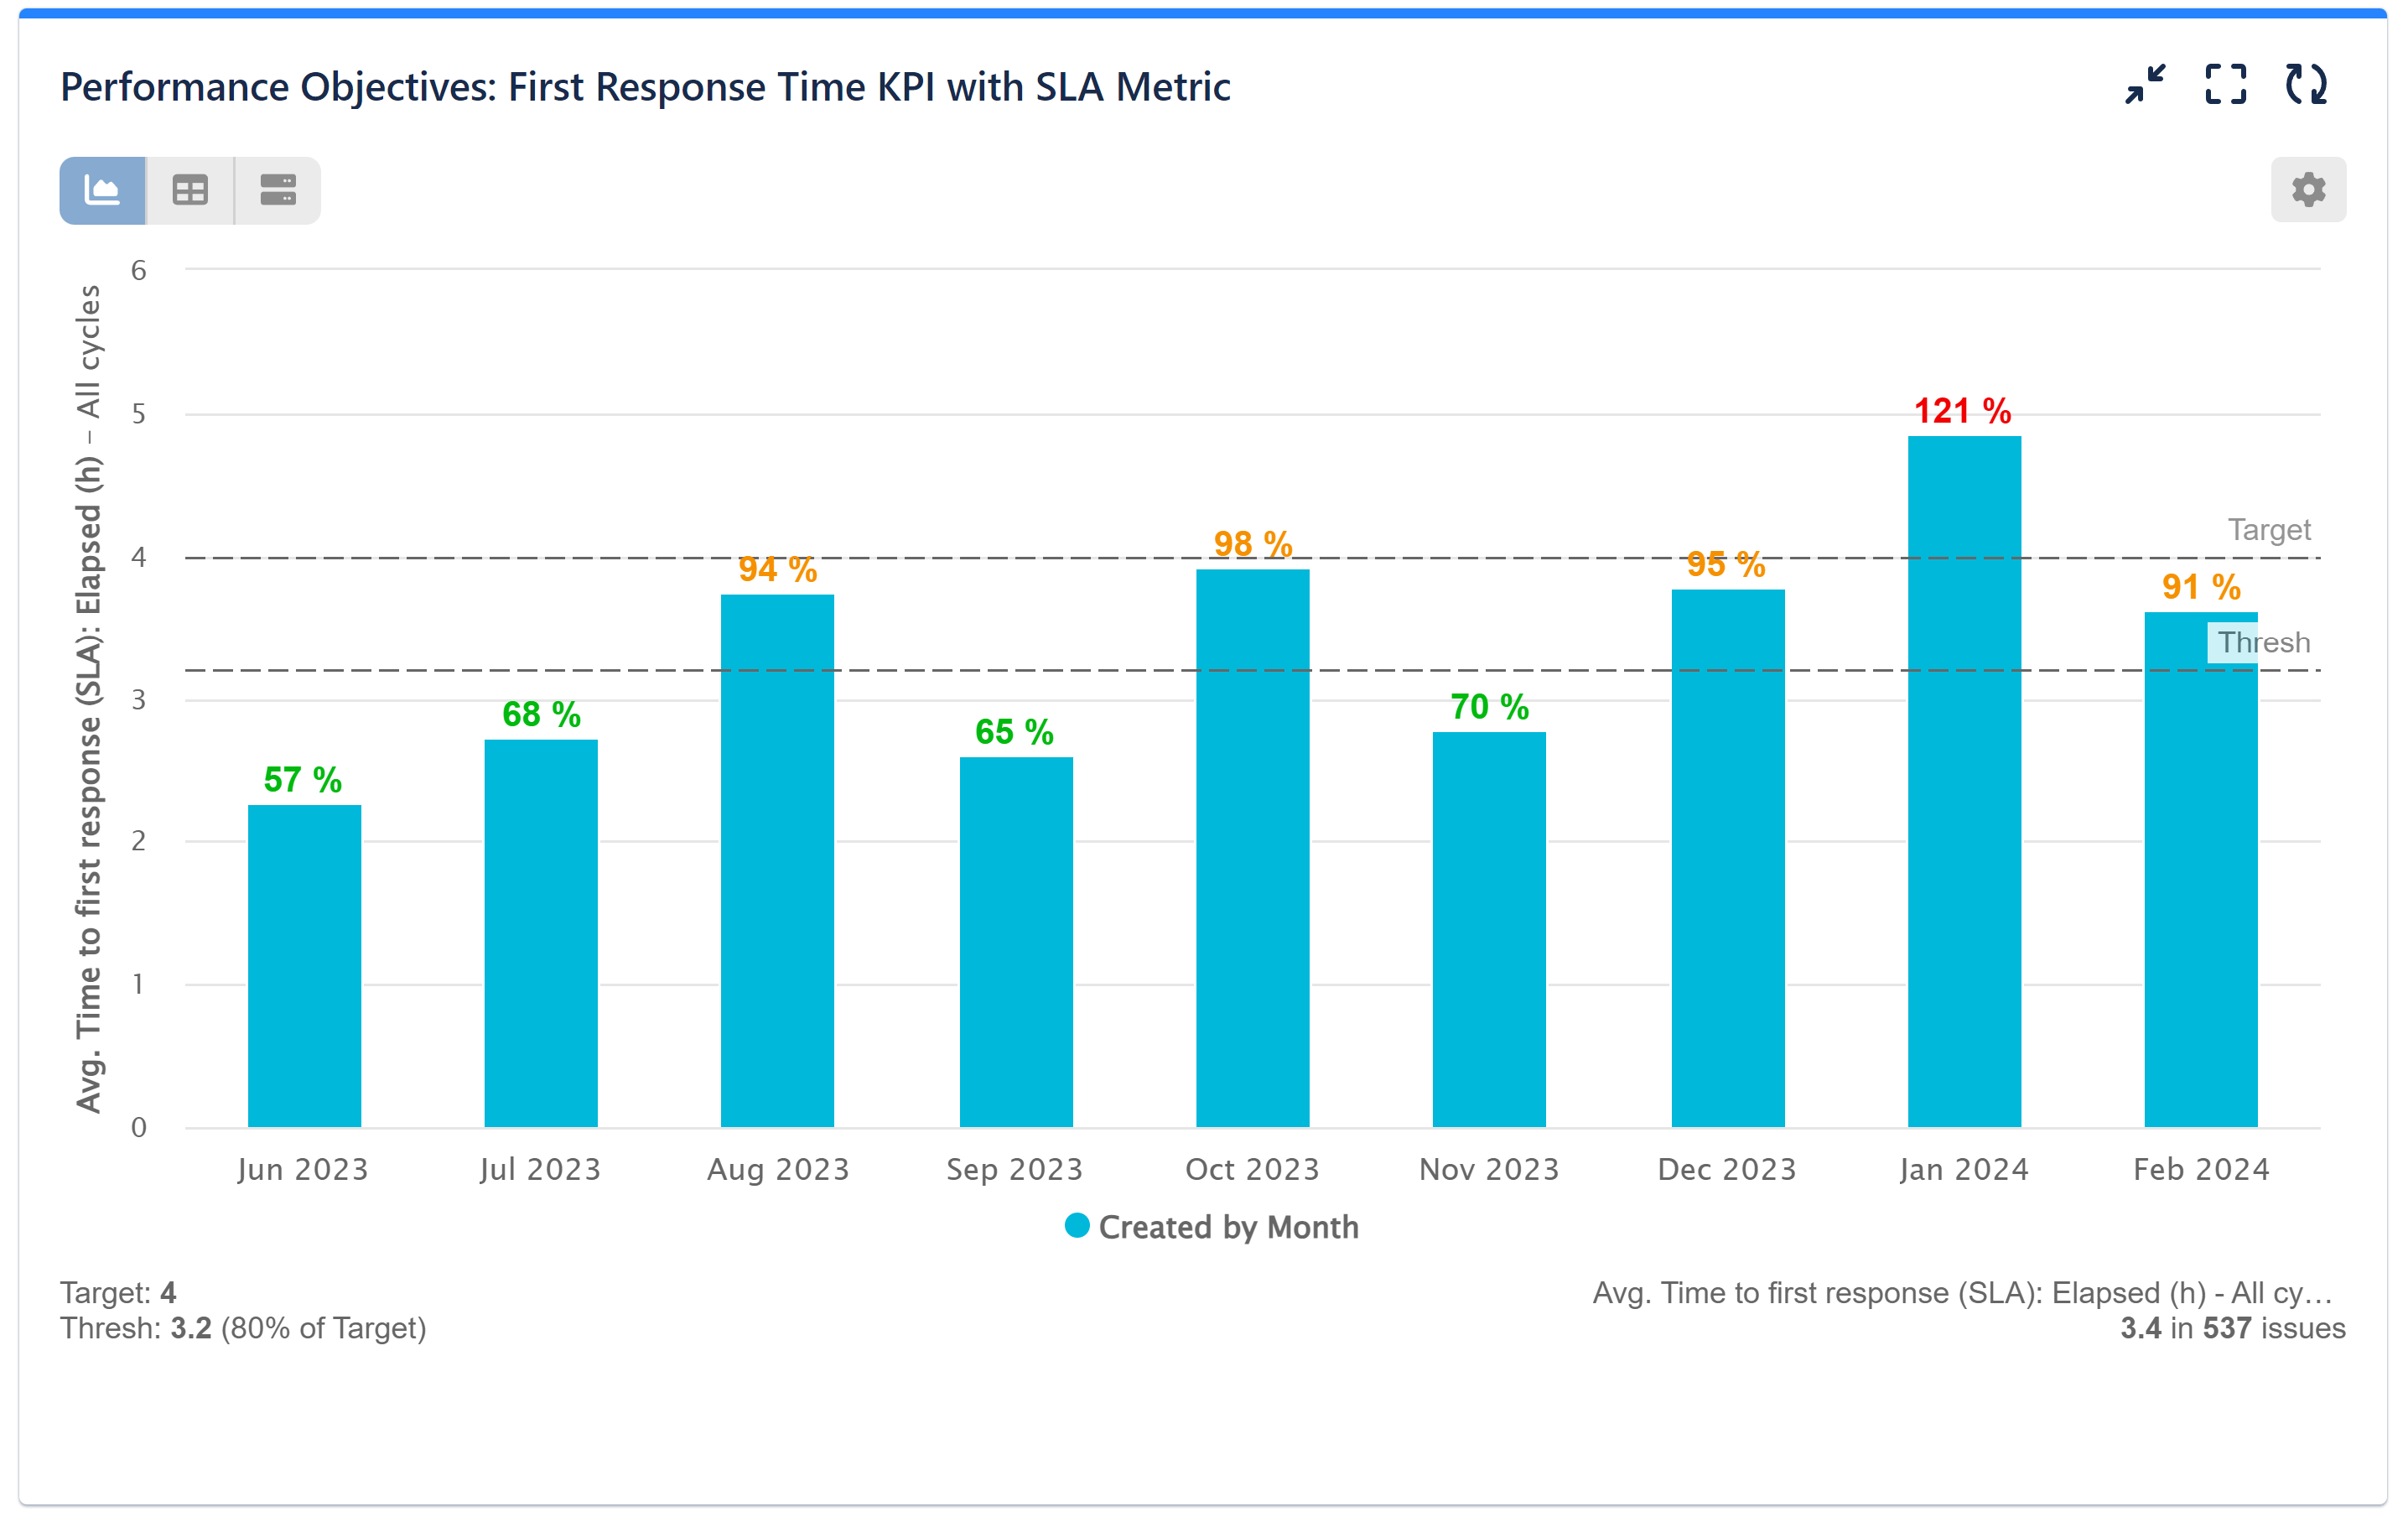
1. First Response Time using Jira Service Management Metrics for SLA analyses
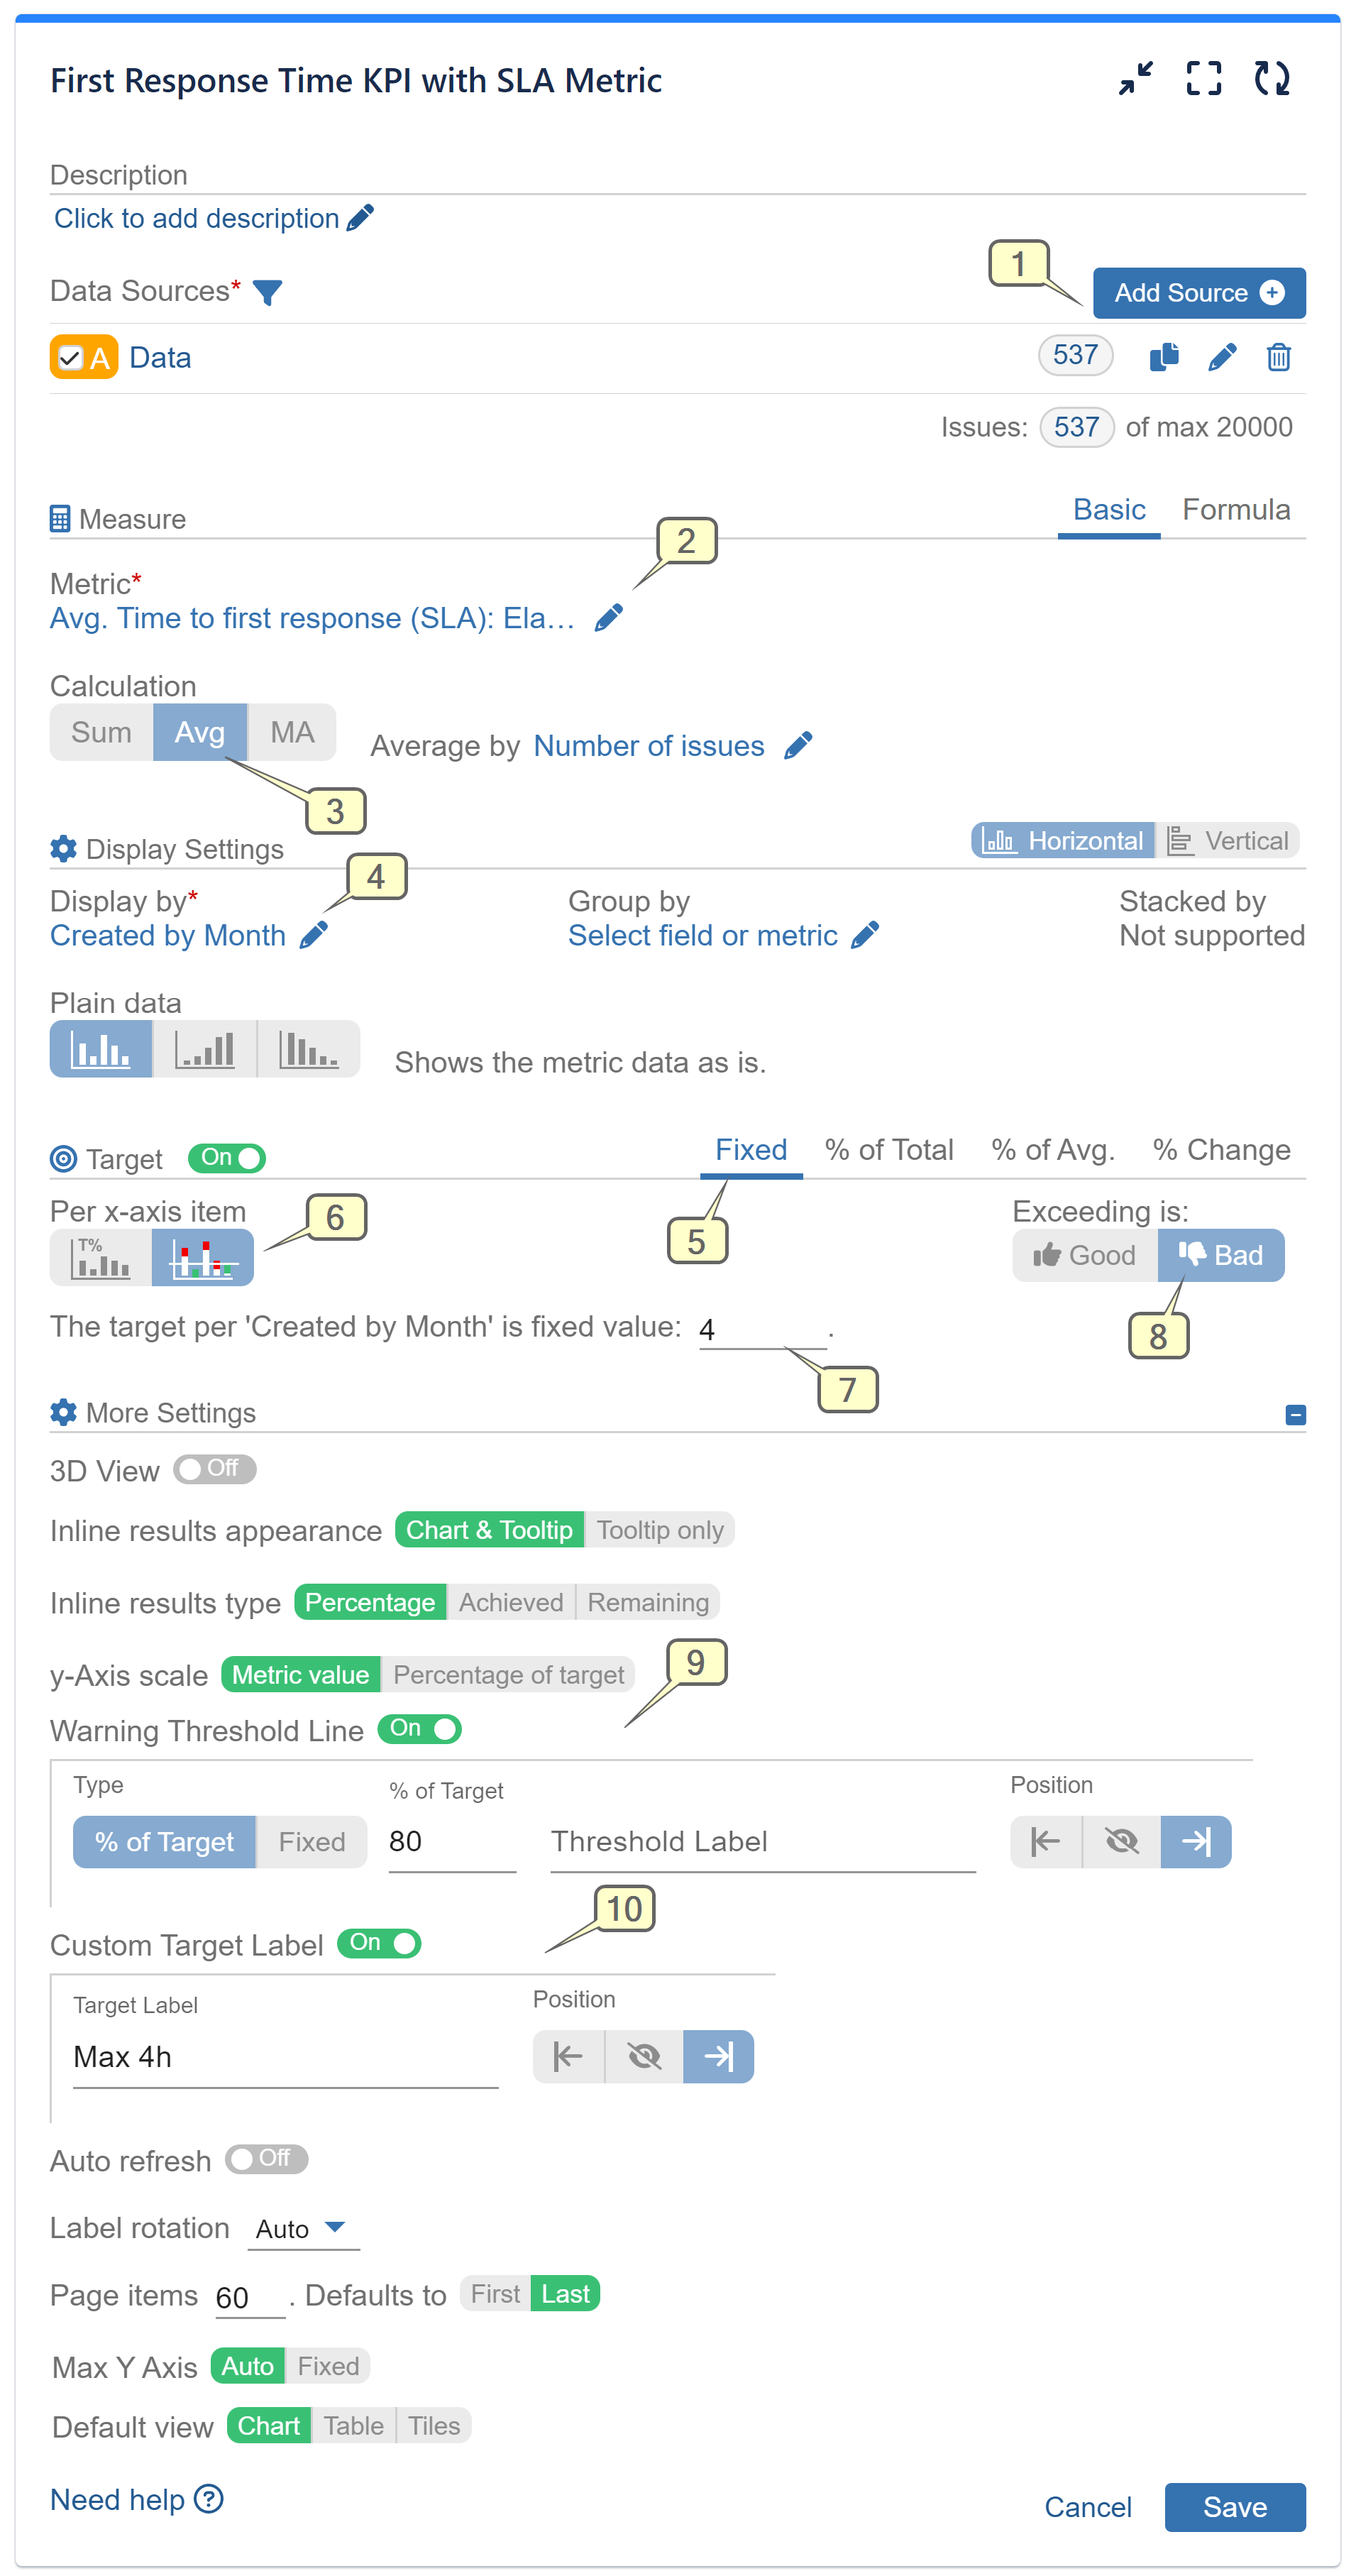
Follow the steps below for configuration:
Step 1: Identify the issues for analysis and set them into the Data Source. Here you have multiple options to select filter/s, projects, issue types, etc. (for more information, please check the Configuration overview page).
Step 2: Choose the ‘Time to First Response’ field from the Metric Group ‘JSM’. Then, opt for the SLA metric ‘Elapsed (h)’ and SLA Cycles ‘All cycles’.
Step 3: Select the Average calculation based on the total number of issues.
Step 4: Display data by ‘Created’ field. Adjust the granularity of the ‘Created’ date according to your preference. For instance, setting it to monthly intervals enhances chart readability.
(Optional) You may also group data by field of your choice, e.g., issue type, assignee, components, priority, etc.
Step 5: Activate the Target section and keep the ‘Fixed’ tab selected.
Step 6: Configure target results to be calculated per x-axis item.
Step 7: Set target level. In our example, it is set to 4 hours.
Step 8: Define the target as negative by setting ‘Exceeding is’ to ‘Bad’. This causes results exceeding the target to be highlighted in red.
Step 9: Establish a ‘Warning threshold’ level, which will highlight results above this threshold and below the target in amber.
Step 10: Customize the ‘Custom Target Label’ with a descriptor of your choice, such as “Max 4 hours”.
Refer to the detailed settings in the recording provided with the ‘Performance Objectives’ dashboard gadget, utilizing the ‘Time to First Response’ SLA metric:
2. First Response Time using ‘Time between events‘
You can track the time to first response even without setting up SLAs or having a Jira Service Management instance. The approach we will show you here is also applicable in Jira Work Management or Jira Software. Depending on your team’s process workflow, you can measure FRT with the ‘Time between events‘ metric available in the app. These events could include transitions from ‘Created’ to ‘First date in status’ (Progress Started), or from ‘Created’ to ‘Last date in Assignee (unassigned)’. Additionally, consider utilizing other metrics such as ‘Time in assignee‘ (unassigned).
Refer to the recording with the ‘Performance Objectives’ dashboard gadget, which focuses on the time between events ‘Created’ and ‘First date in status’ (‘Waiting for customer’).
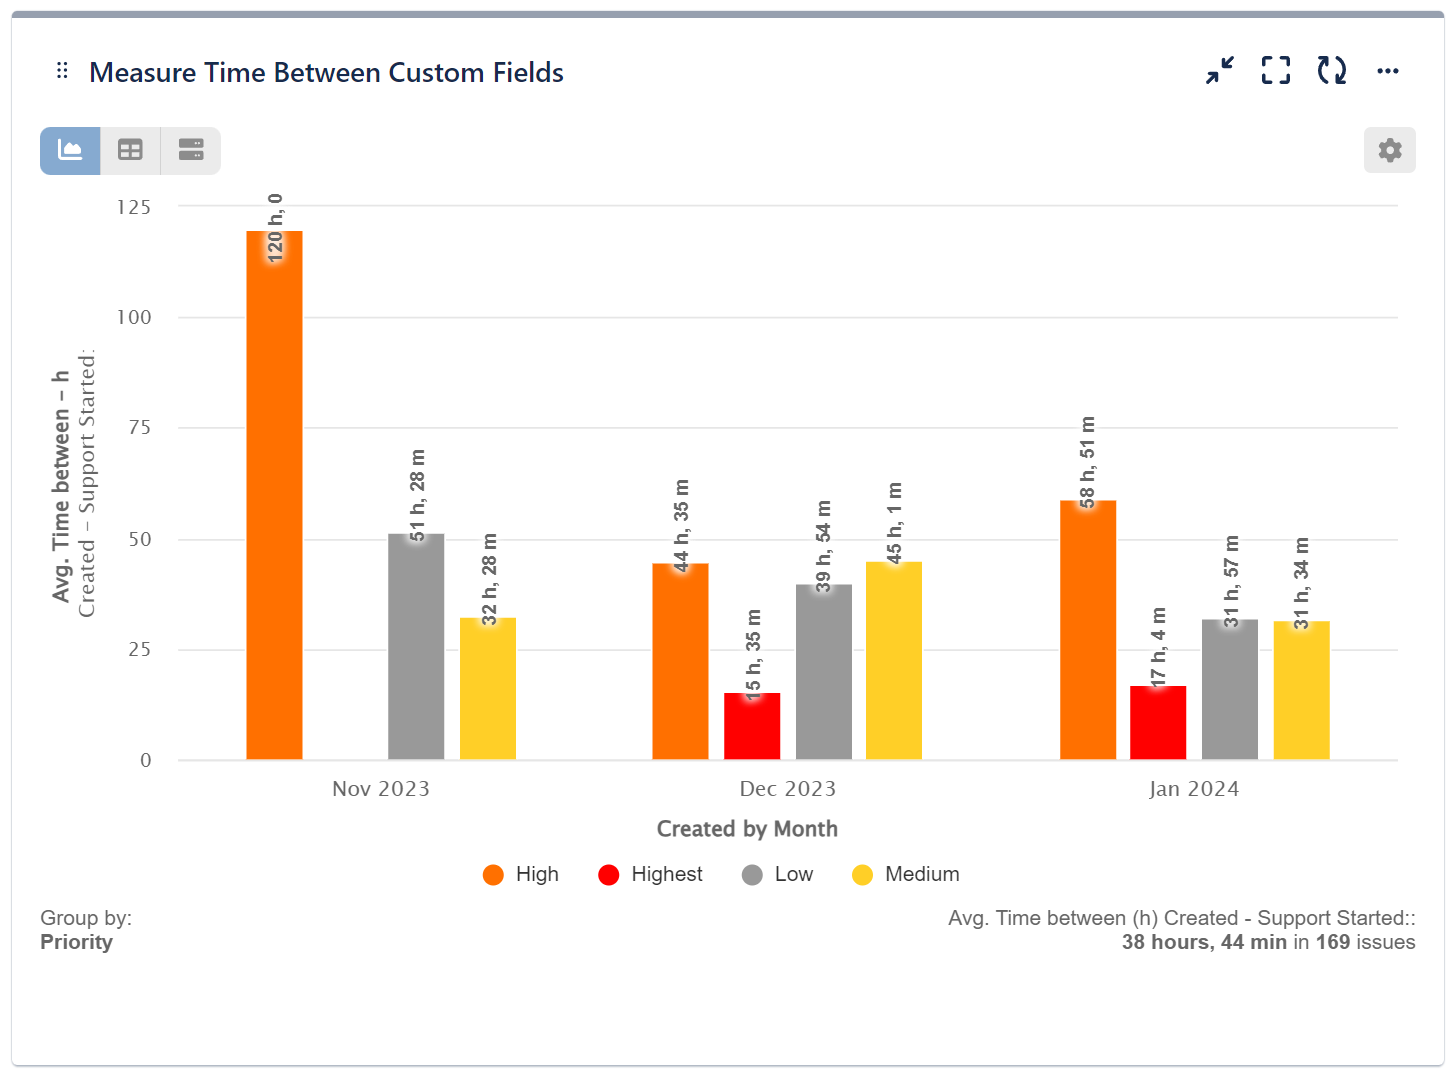
3. First Response Time using Jira custom fields:
If you need to calculate First Response Time (FRT) for specific scenarios beyond what can be captured by statuses, consider creating a custom field and implementing automation with customized conditions. With this custom field, you can generate a tailored report using the Performance Objectives app. To demonstrate the capabilities of Jira automation in capturing various specific cases, we’ve created a field named ‘Support Started.’ It is configured to record the moment when a maintenance request transitions to ‘In Progress,’ but only if an additional form is attached.
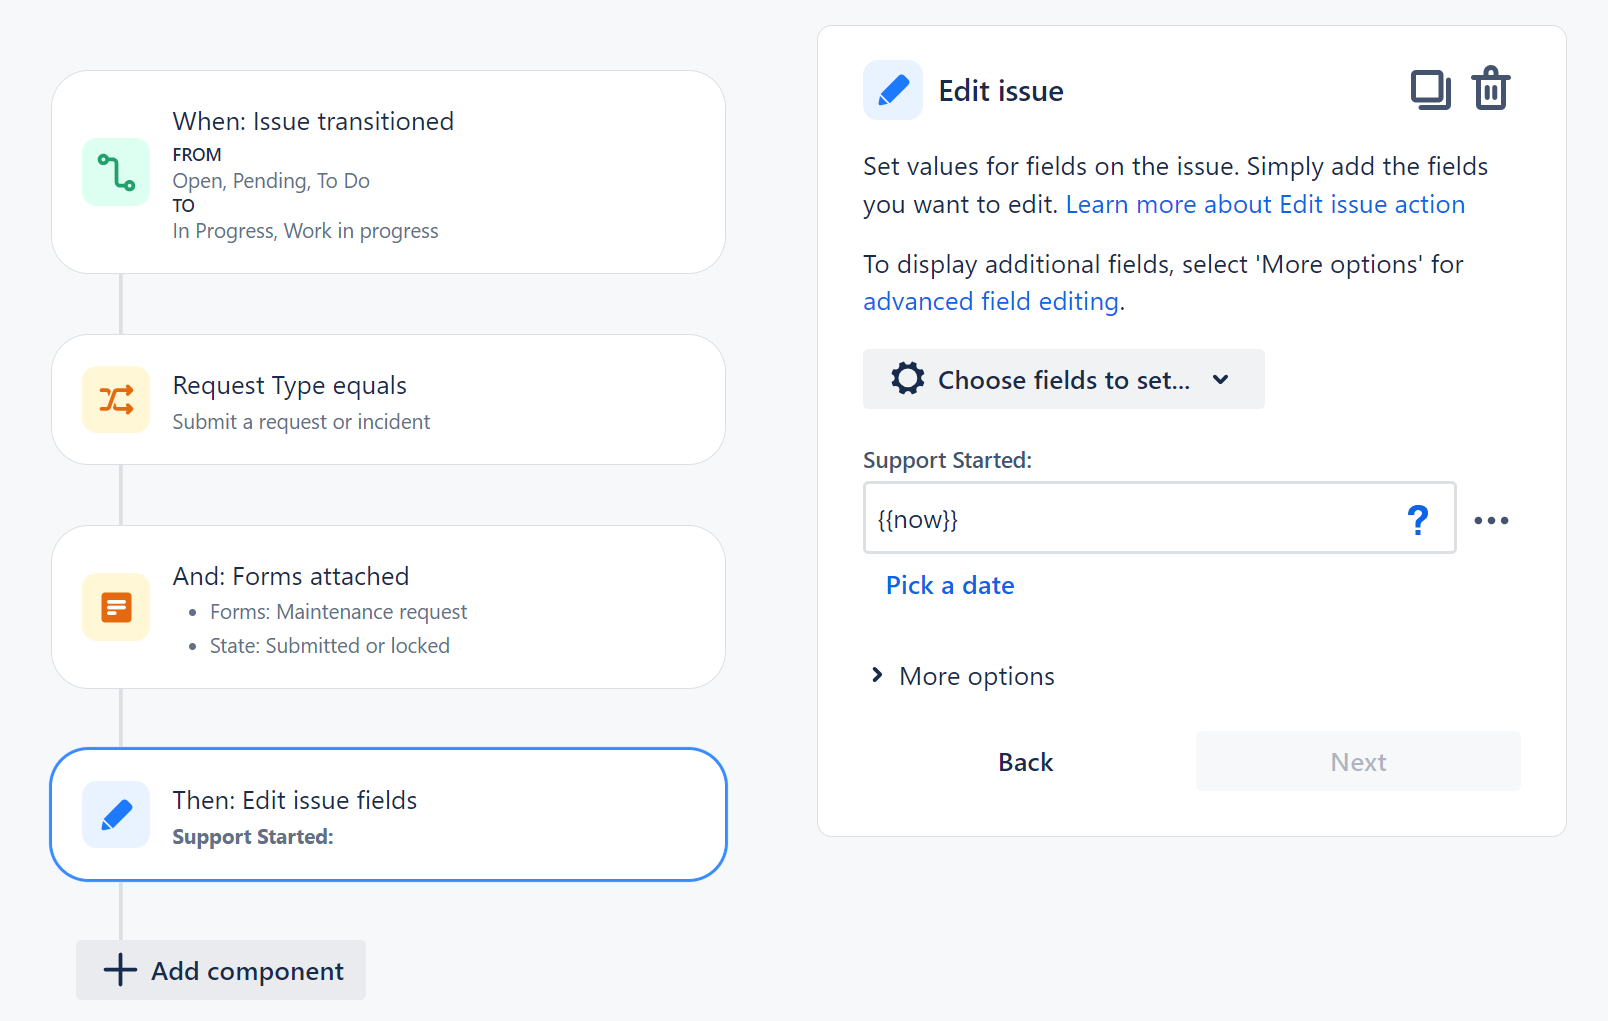
For more information on creating and applying automation to Jira custom fields, check out our dedicated article.
Make the most of your Jira custom fields and build a neat, highly customizable Jira First Response Time report – just like the one showcased here with our app:
If you need further help with configuring your reports and KPIs, please contact our Support team.
Start your 30 days free trial of Performance Objectives: Charts for Jira from Atlassian Marketplace.