Table of Contents
Managing Sprint Rollover: New Filtering Options with the Performance Objectives App
The Performance Objectives app revolutionizes how Jira users create sprint performance reports. With its newly introduced advanced filtering options designed for sprint metrics such as ‘Story points’ and ‘Number of issues in Sprint’, teams can now easily analyze sprint progress, pinpoint bottlenecks, and make informed decisions to enhance workflow efficiency. Furthermore, by harnessing the Target feature of the app, you can generate insightful KPI reports, such as “Number of issues in Sprint: Rolling vs All”. In this article, we will guide you through the steps to track and manage Sprint rollover by configuring this report.
Configuring the “Rolling Issues vs All” Report in Jira
Are your committed issues consistently not completed sprint after sprint, resulting in persistent sprint rollover?
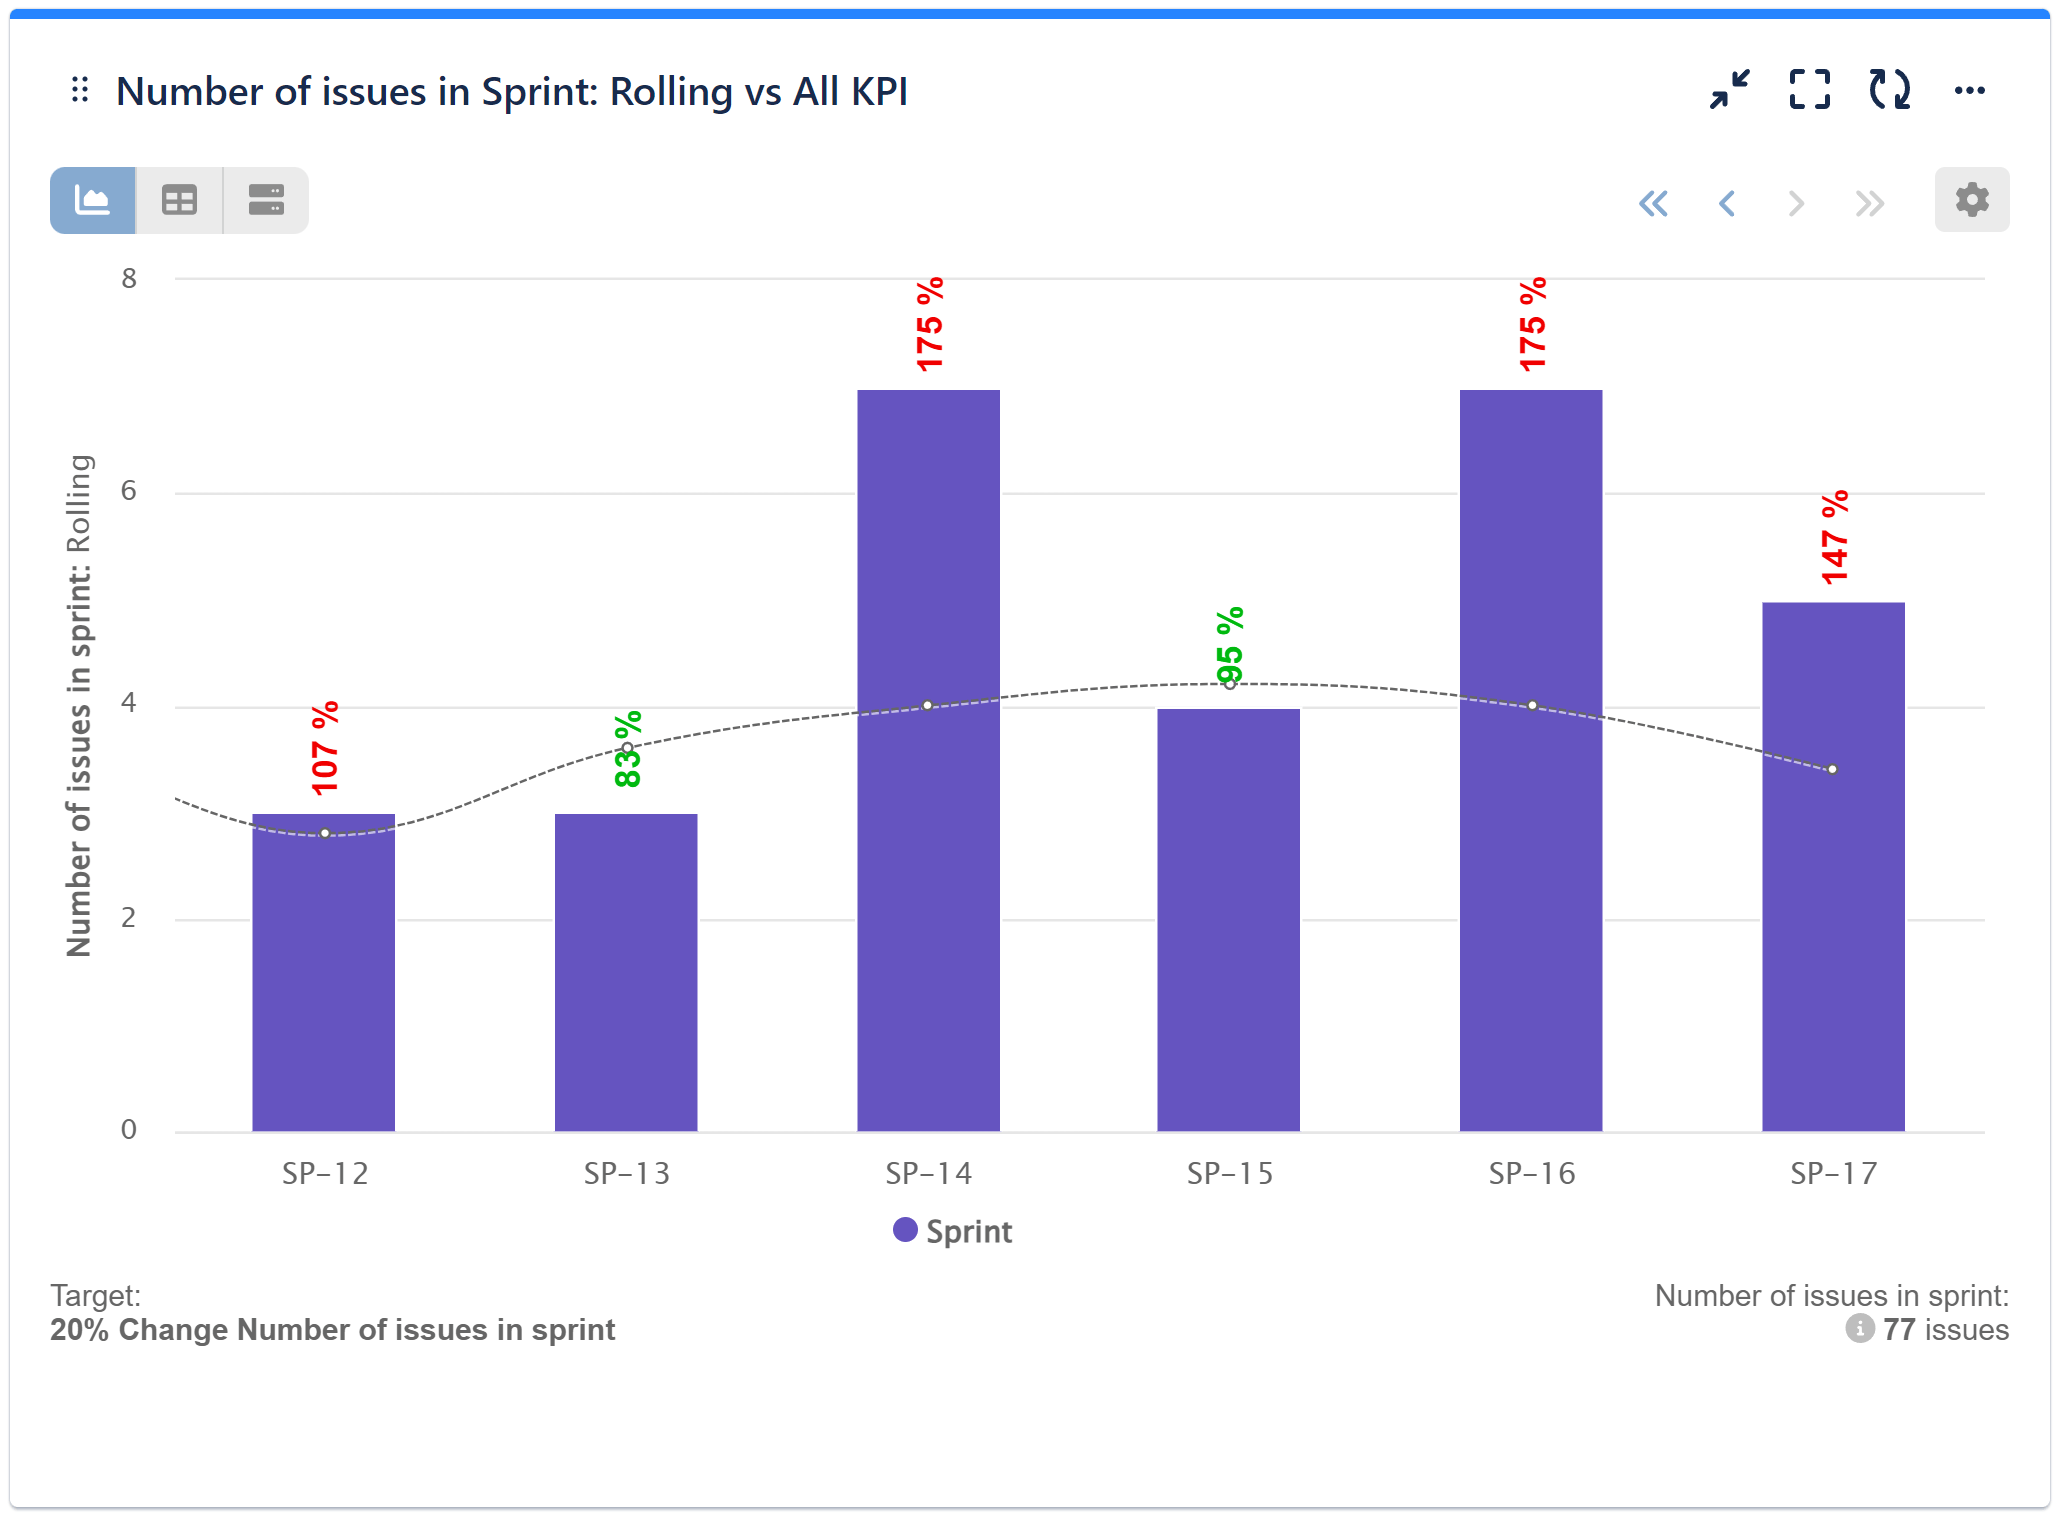
Tracking the number of issues considered “rolling” from sprint to sprint can provide valuable insights. This metric allows teams to monitor the persistence of unresolved issues, identify recurring challenges or blockers, and assess the effectiveness of sprint planning and execution over time.

Adding a target, which represents the maximum number of issues rolling from sprint to sprint, serves as a benchmark for teams to strive towards improved sprint efficiency and effectiveness. By setting a target, teams establish a clear objective to minimize the number of unresolved issues carried over from one sprint to another. This is a “Rolling Issues vs All” report for Jira configured with the Performance Objectives gadget. However, you can also configure the same report using the ‘Story Points’ metric and specify “Rolling”, significantly enhancing your sprint planning based on these insights.
Here are the steps to configure this report.
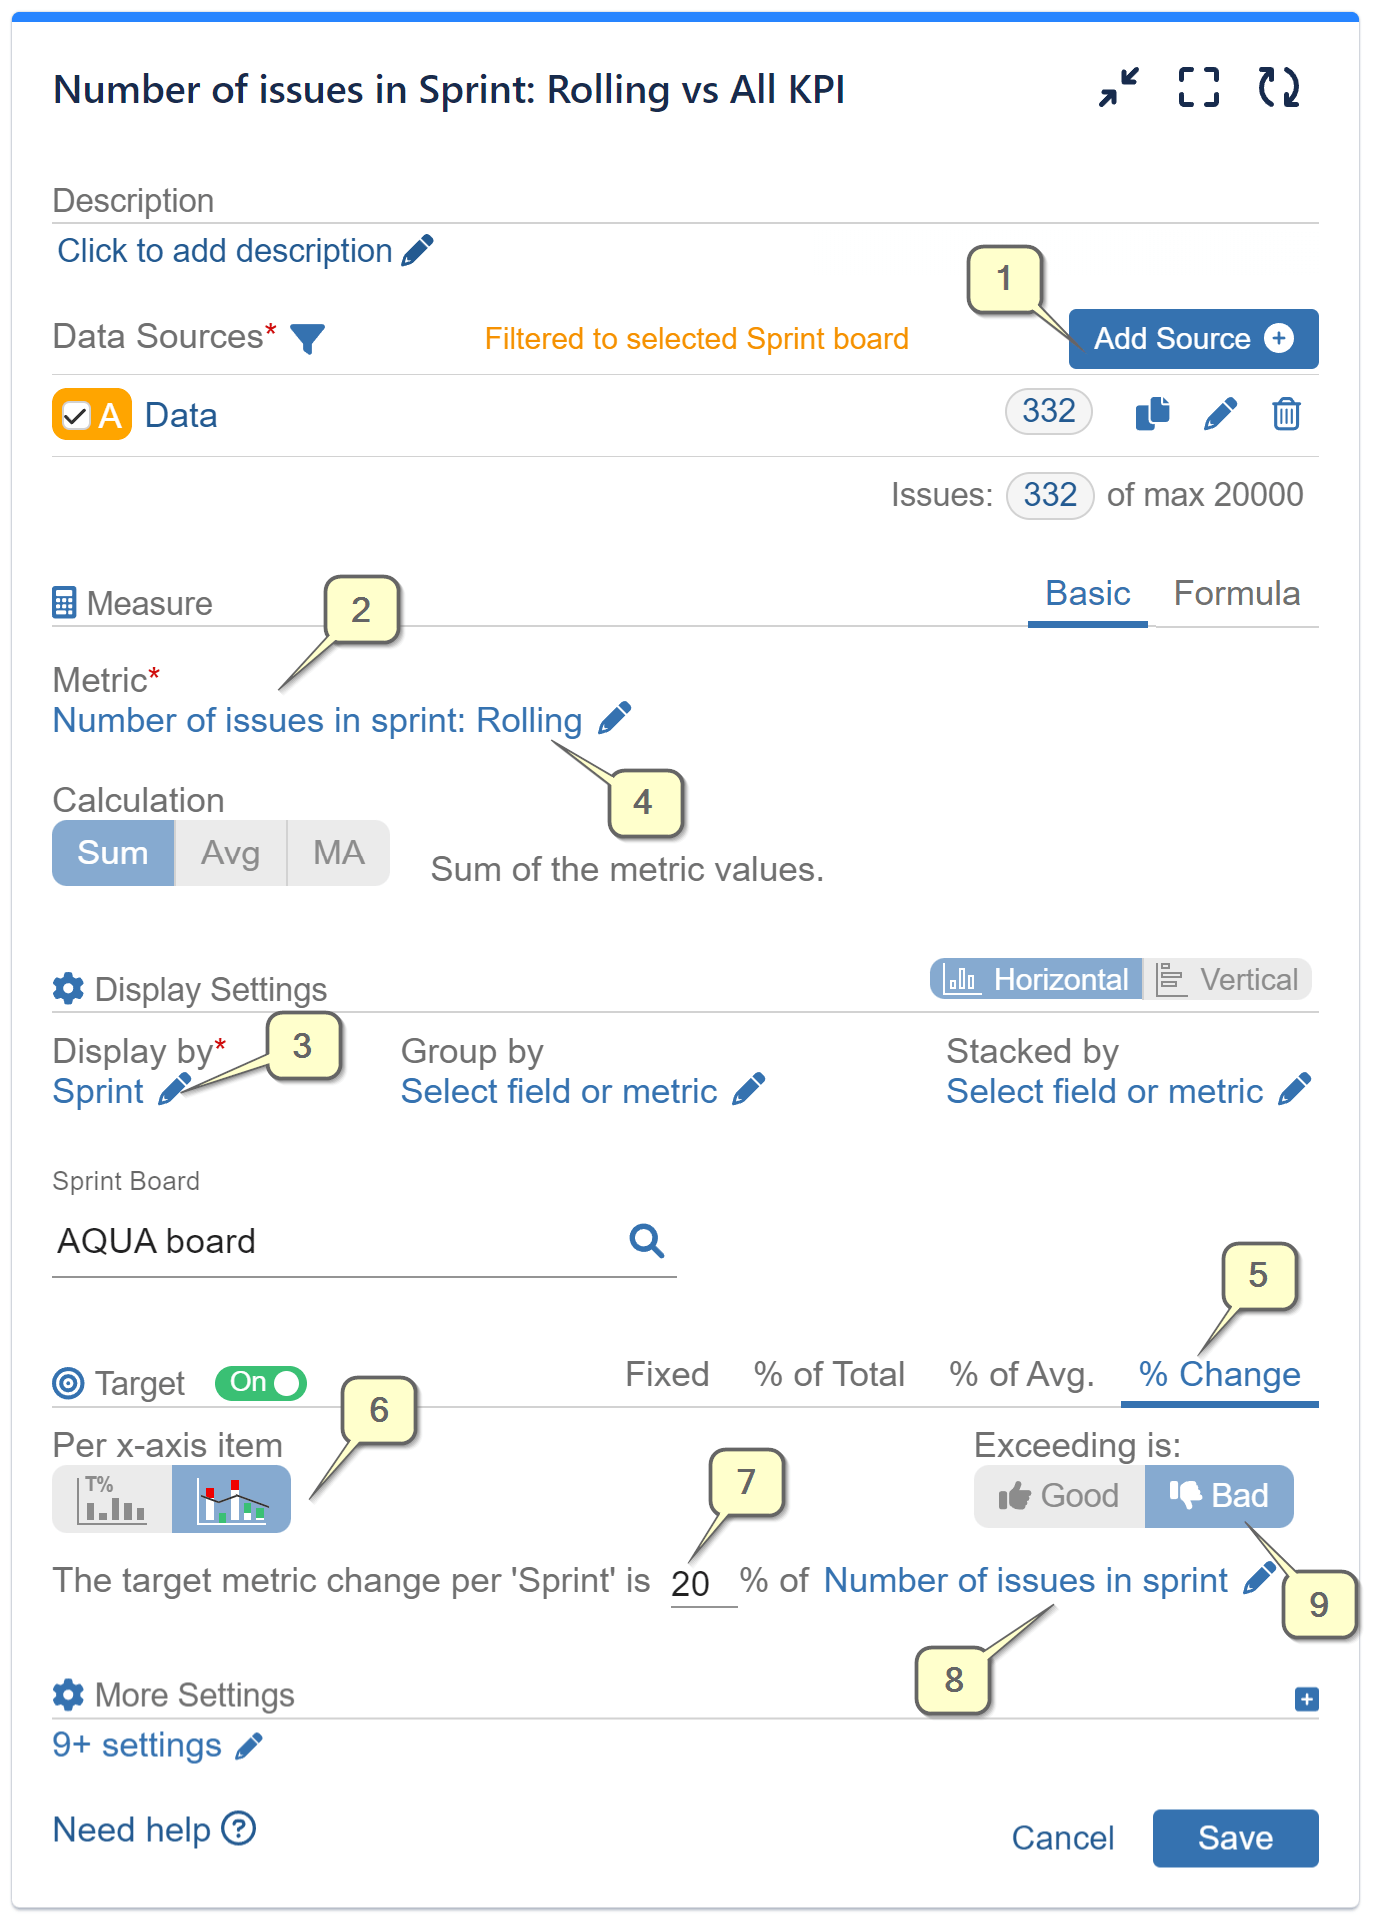
Step 1: Add a Data Source. In our example, we’ve filtered our demo project ‘Aqua’ and disabled the date range to view all previous sprints.
Step 2: Select the ‘Number of Issues in Sprint’ metric.
Step 3: Choose ‘Sprint’ for the ‘Display by’ field to unlock additional filtering options for your ‘Number of Issues in Sprint’ metric and specify the Sprint Board you want to analyze.
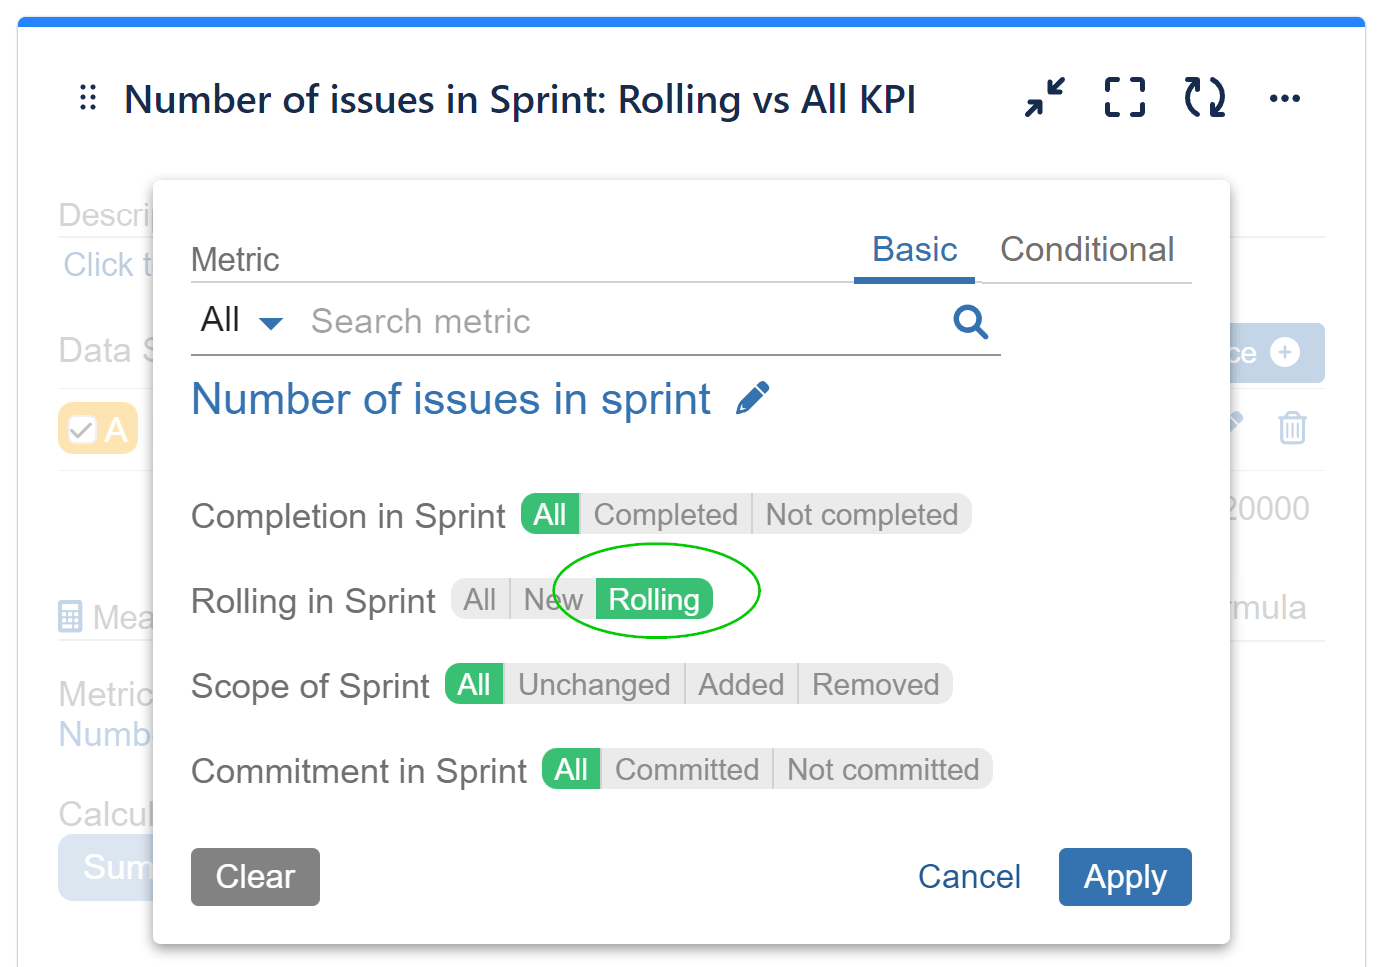
Step 4: Return to the ‘Number of Issues in Sprint’ metric and choose criteria “Rolling”.
Step 5: Enable the Target section and select the “% Change” type.
Step 6: Choose the “Per x-axis” item target.
Step 7: Set the target to the desired percentage. In our example, this is 20%.
Step 8: Select “Number of Issues in Sprint” – “All” as the target metric.
Step 9: Specify that exceeding the target is considered “Bad”.

Here’s Step 4 in detail:

Here’s a video following the specified configuration:
To explore more about our app’s features, refer to the User Guide, gain inspiration from our KPI Examples or contact our Support team for demo or assistance!
Start your 30 days free trial of Performance Objectives: Charts for Jira from Atlassian Marketplace.