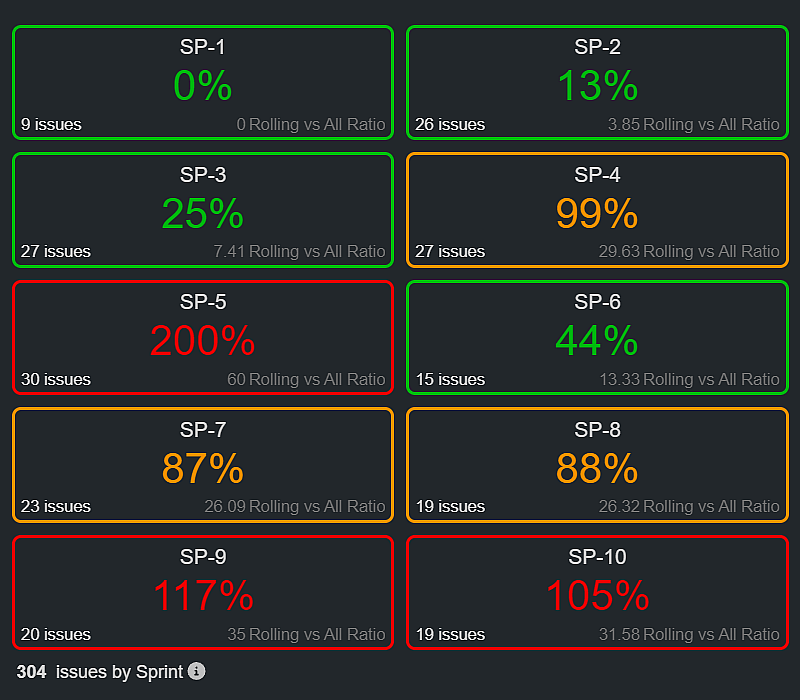
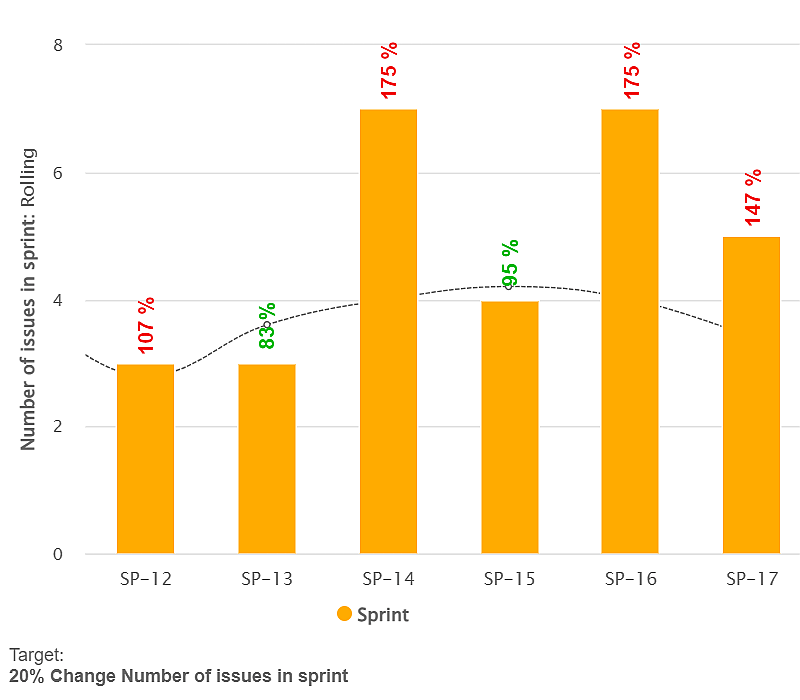
Why Tracking the Sprint Rollover Ratio? In Agile project management, keeping track of sprint efficiency is vital for continuous improvement.…
Why Tracking the Sprint Rollover Ratio? In Agile project management, keeping track of sprint efficiency is vital for continuous improvement.…
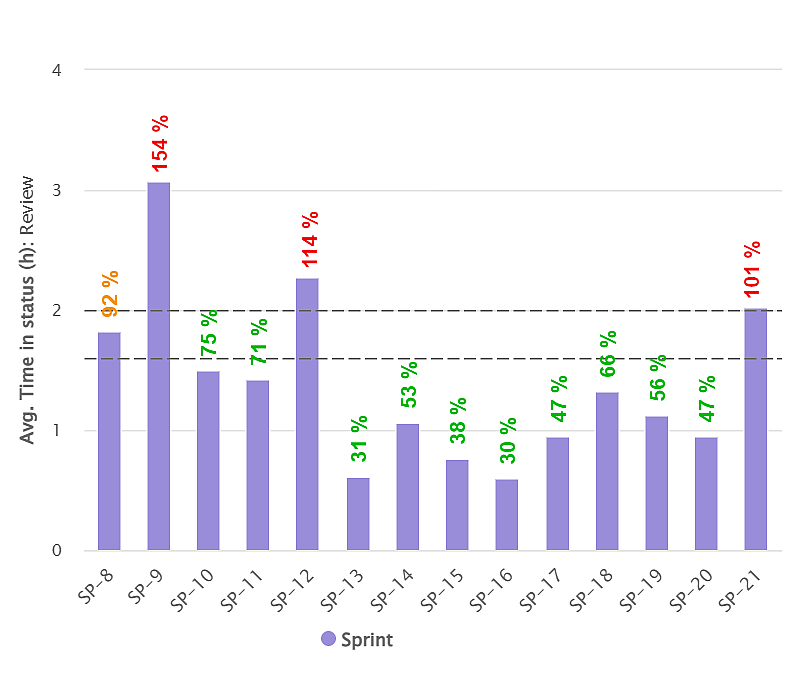
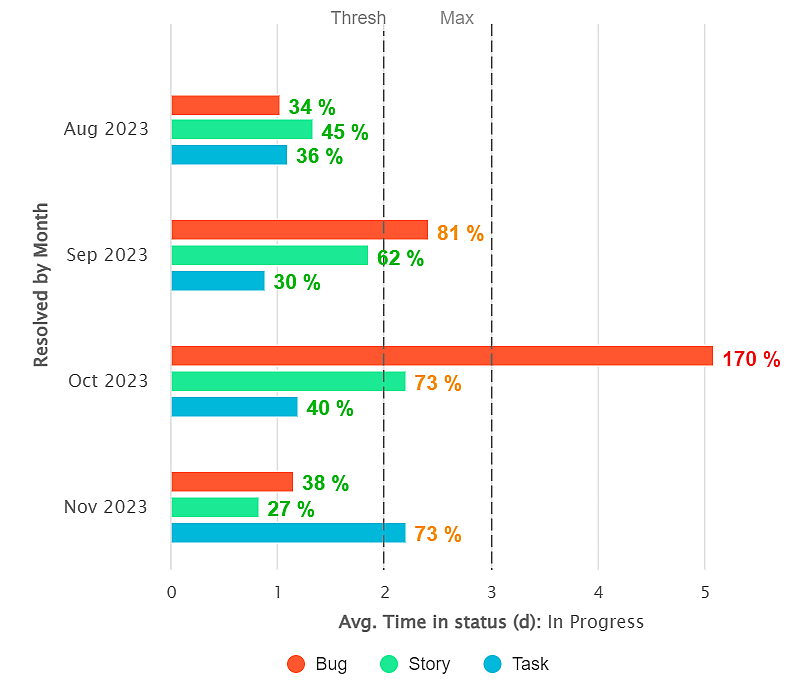
Optimizing Sprint Performance with Average ‘Time in Status’ Metric in Jira In the dynamic world of Agile project management, tracking…
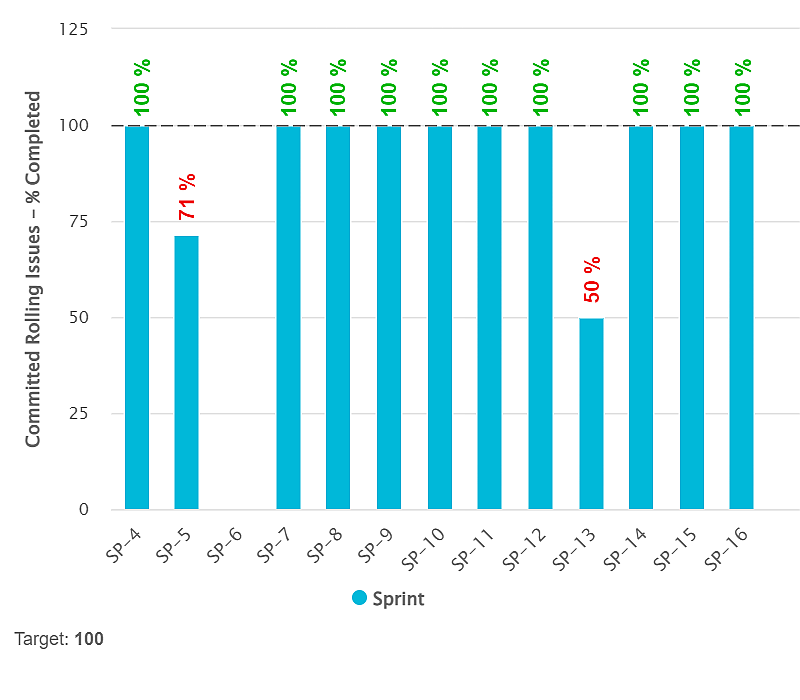
Task prioritization can sometimes be challenging, as every issue may seem important. Despite teams committing to completing issues in specific…
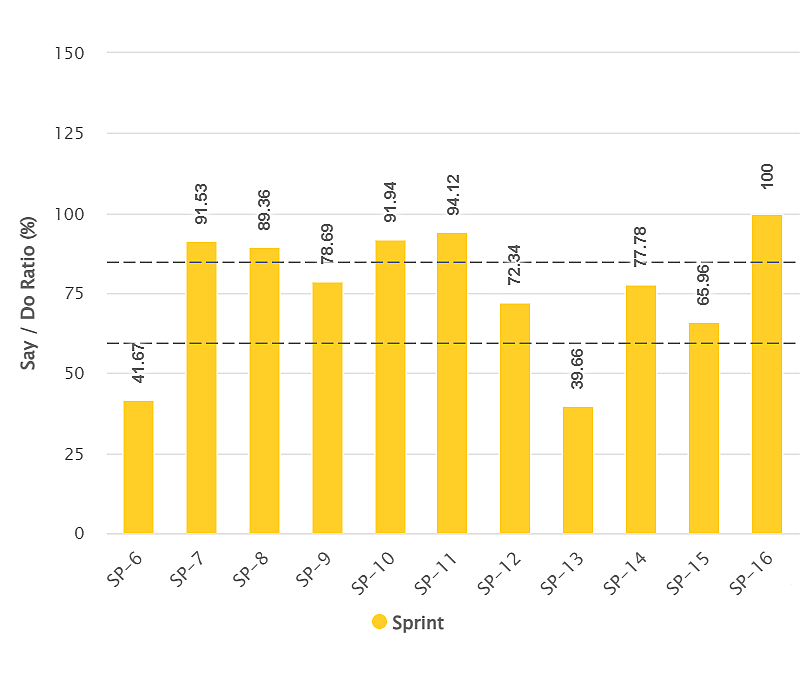
We’re excited to introduce new reporting options that enhance Sprint analysis through our updated filtering features and metrics. This article…
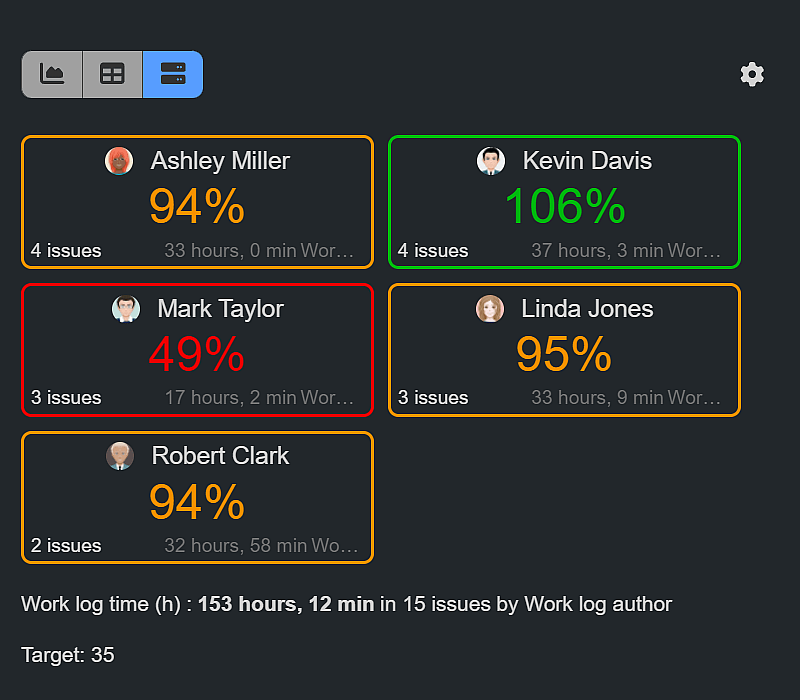
Accurate Tracking of Work Log Time by Work Log Author with Performance Objectives App As highlighted in our blog post,…
Cycle Time is defined as the time spent working on an issue and is calculated as the time between the…
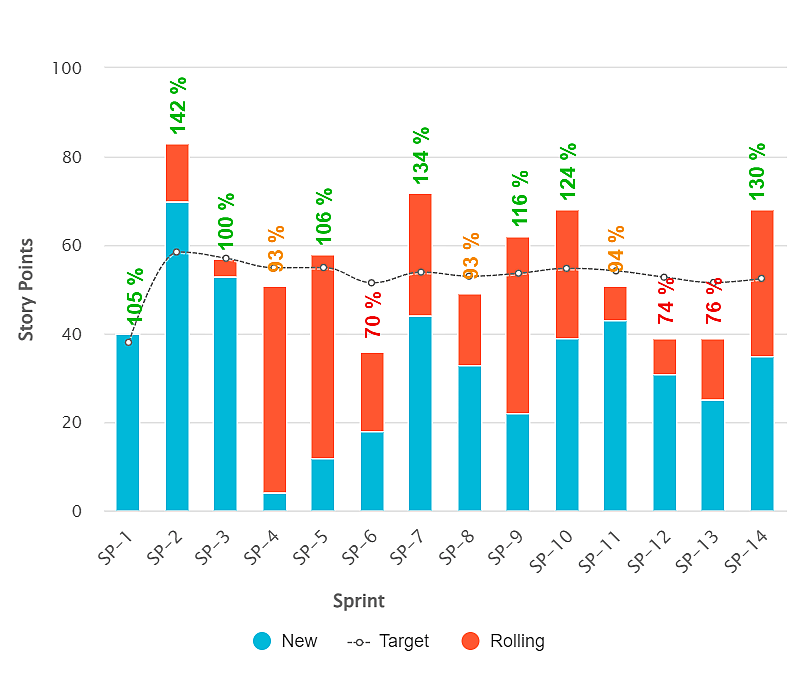
Analyze team velocity in Jira and set Target as a % of Moving Average Story Points.
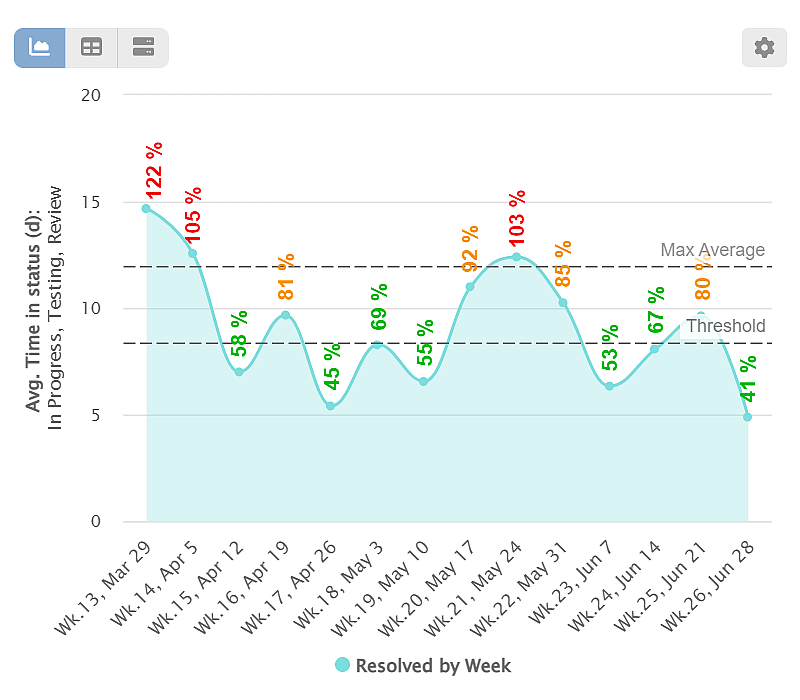
Enhance SLA metrics by calculating mean time to resolve issues using Performance Objectives app.
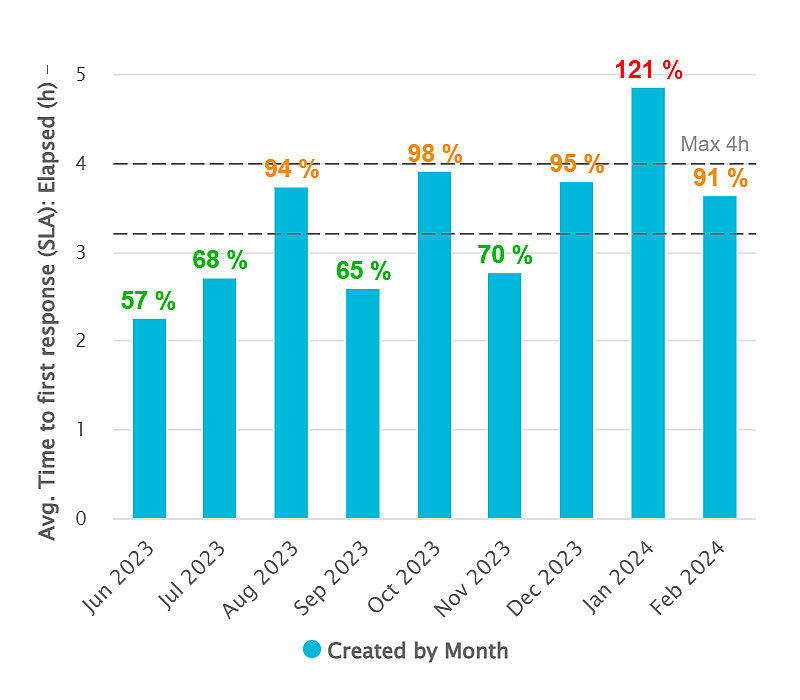
If you operate within a support center or help desk, monitoring the Time to First Response is crucial for evaluating…
Managing Sprint Rollover: New Filtering Options with the Performance Objectives App The Performance Objectives app revolutionizes how Jira users create…