Table of Contents
The ‘Cycles in Status’ metric, available in the Performance Objectives: Charts for Jira app, is a powerful tool that enhances workflow efficiency and provides valuable insights into your team’s performance. By utilizing this metric, you can identify areas for improvement and optimize your processes, driving better outcomes.
One of the standout features of Performance Objectives app is its ability to set custom targets, such as for the average number of cycles in status, directly on your Jira dashboard. This powerful feature empowers you to establish clear performance goals and benchmarks for your team, promoting transparency and accountability.
Monitoring the average number of cycles in status also helps you identify inefficiencies and bottlenecks in your workflow. By comparing the actual cycles against the target, you can pinpoint areas that require improvement and take appropriate actions to streamline your processes.
Another significant advantage of the Performance Objectives gadget is its capability to measure the effectiveness of your workflow optimizations over time. By consistently tracking and analyzing ‘Cycles in Status’ metric, you can observe trends, patterns, and make data-driven decisions to continuously enhance your team’s efficiency and productivity.
Exploring Different KPIs
With ‘Cycles in Status’ metric, you can create a variety of Key Performance Indicators (KPIs) on your Jira dashboard, tailored to meet your specific needs for status count reporting. Here are some examples of KPIs that can be configured using this powerful metric:
- Status count ‘Reopened’: Monitor the number of times an issue is reopened by the QA team responsible for issue verification.
- Status count ‘Review’: Track the number of times the Dev team engages in code review, contributing to the overall quality of the codebase.
- Cycles in status ‘Testing’: Evaluate the number of cycles that occur within the ‘Testing’ status, allowing both QA and Dev teams to focus on diligent feature verification.
- Cycles in status ‘In Progress’: Analyze the cycles within the ‘In Progress’ status to ensure project managers and product owners maintain high-quality requirements and detailed specifications.
Sample Configurations for Jira Service Management Teams
Reducing the number of cycles involved in the processing of support requests can significantly enhance the efficiency of your service desk operations. In this article, we will provide you with sample configurations specifically tailored for service desk teams, utilizing the Performance Objectives dashboard gadget. By implementing these configurations, you can streamline your support request cycles, leading to improved service delivery and increased customer satisfaction.
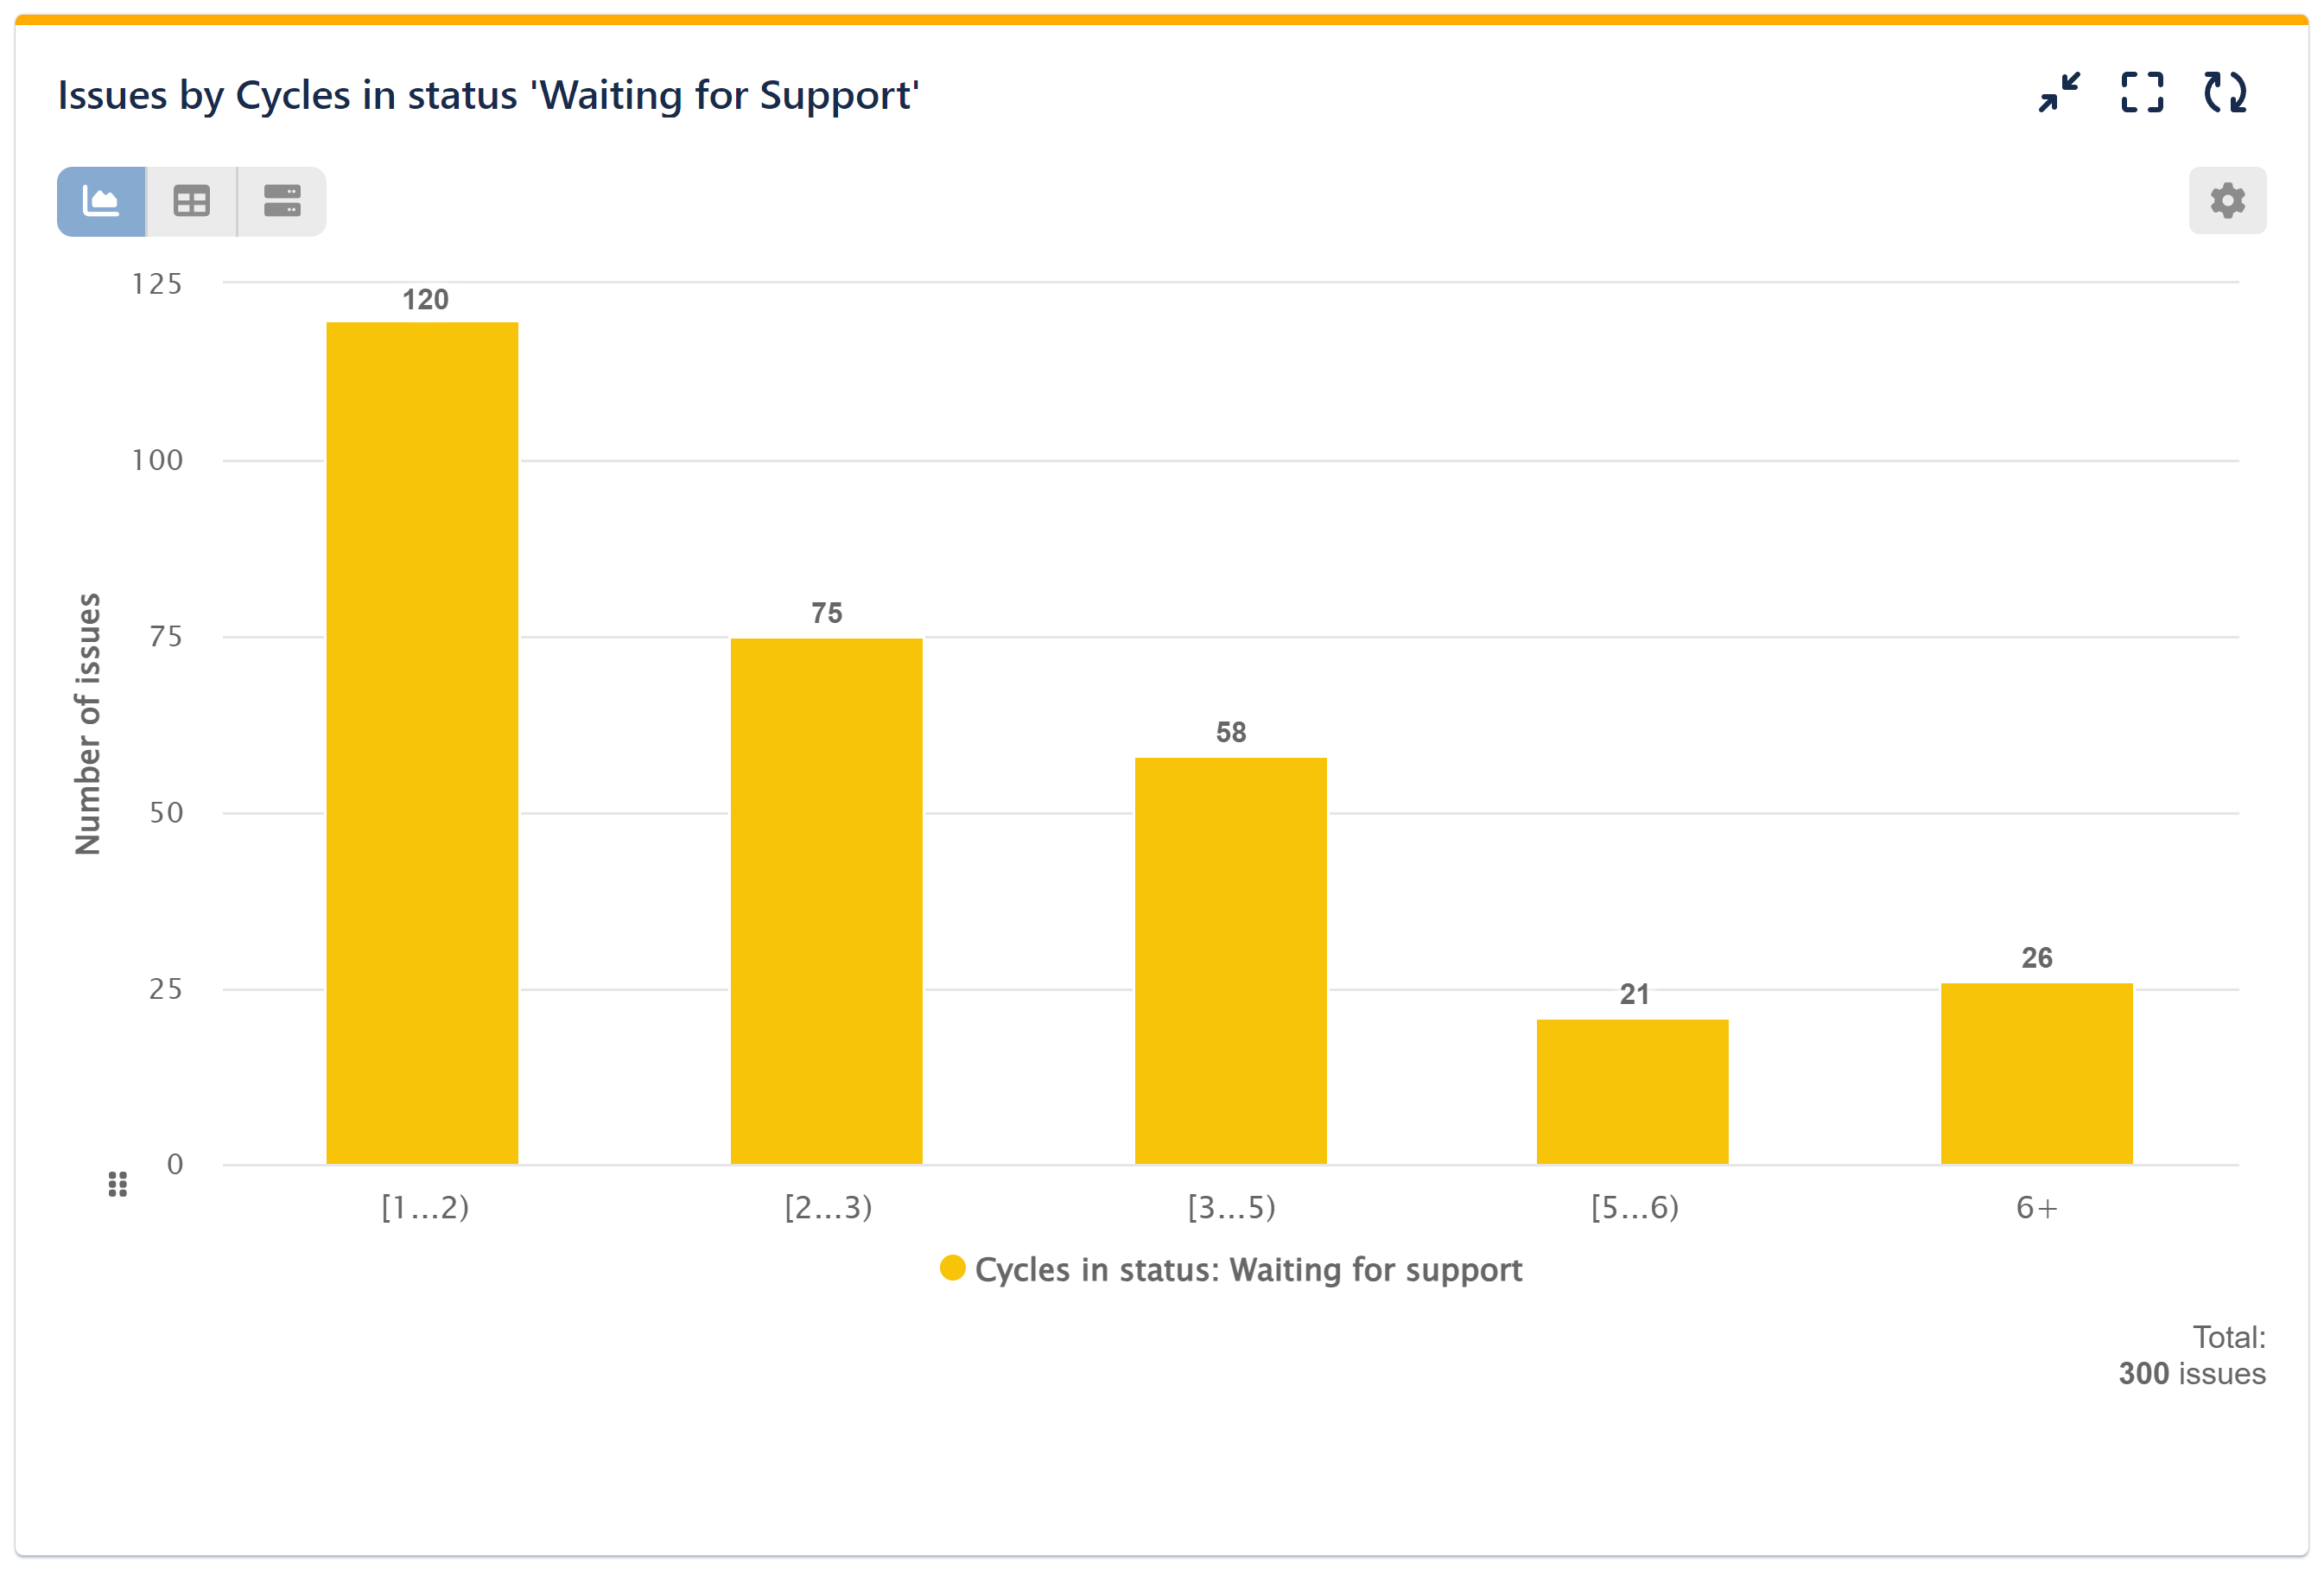
So, how can you analyze patterns and develop your improvement plan? To start filter out resolved issues within a specific timeframe using the “Cycles in status ‘Waiting for support’ ” metric, as displayed in the visualization below. Take a closer look at the issues that have undergone more back-and-forth cycles than anticipated.
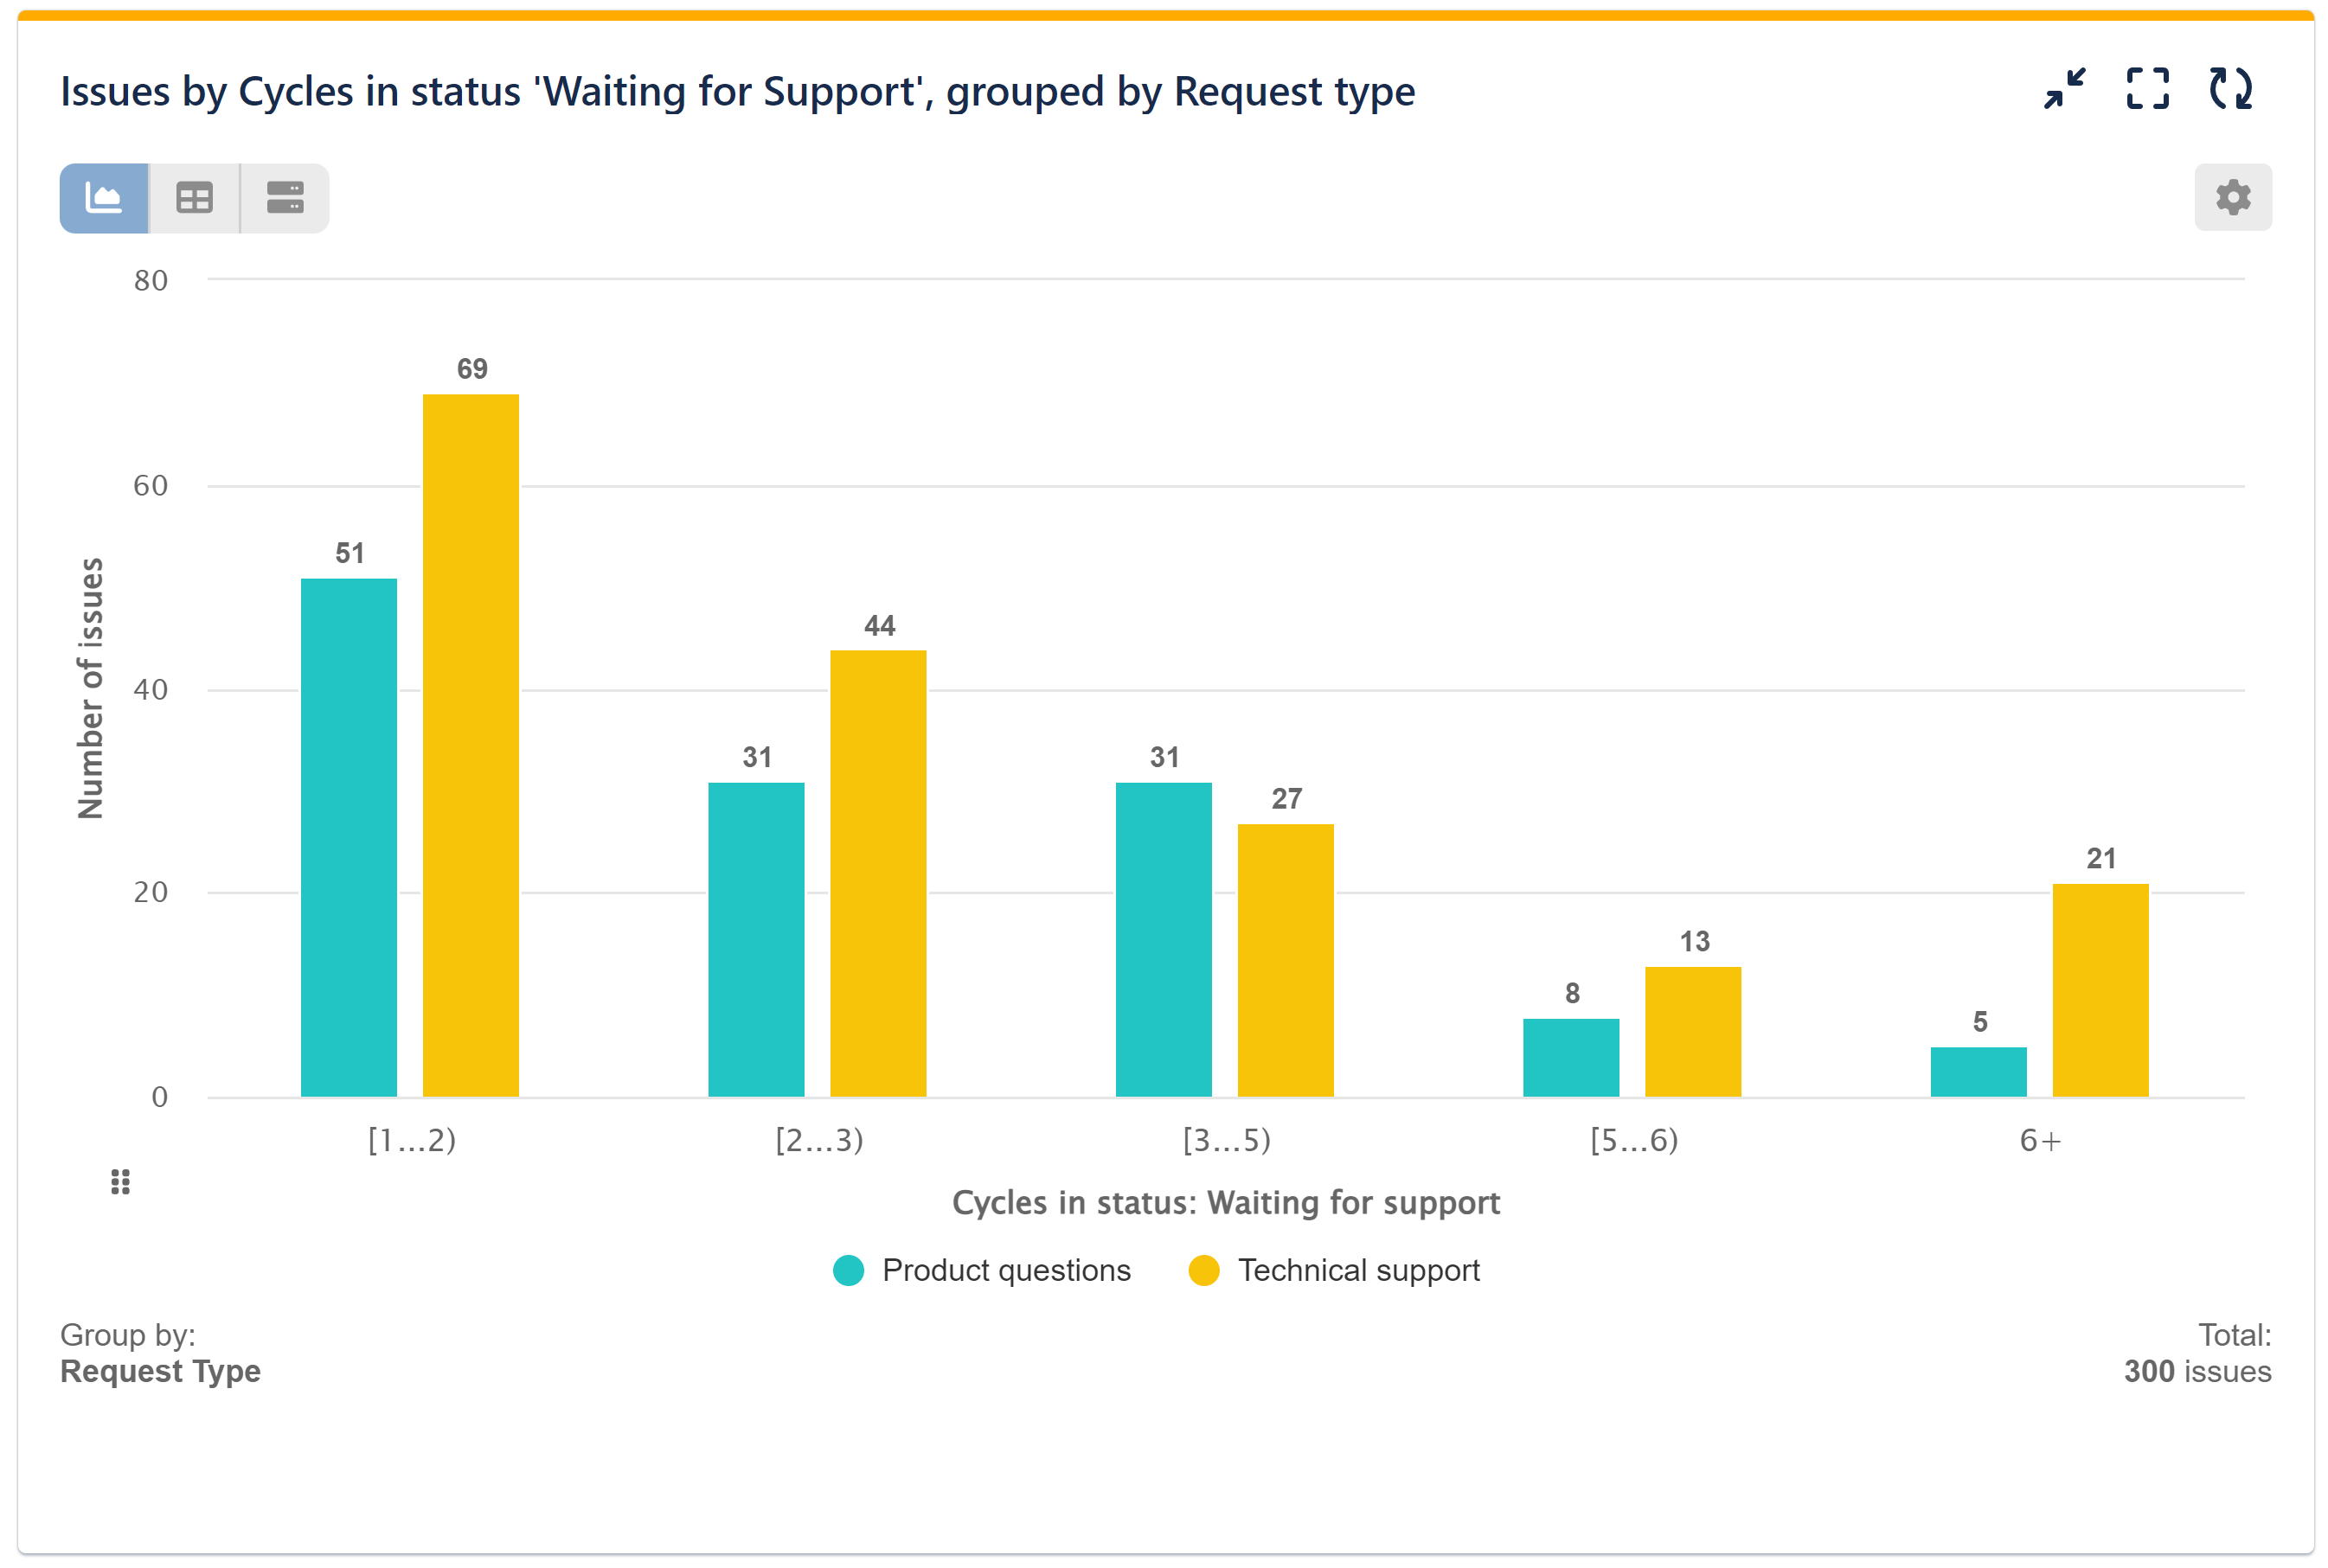
Additionally, you can track the number of cycles your requests go through based on the ‘Request Type’ as shown in the visualization below, ‘Assignee (History),’ or any other relevant field to gain a deeper understanding of the factors influencing these numbers.
As an additional step, consider creating another report to establish and monitor targets for the maximum average number of cycles for specific request types and/or assignees. This will allow you to track progress over the next period and ensure improvements are being made. For a more comprehensive understanding of Cycle Time and Lead Time, combine this analysis with the ‘Time in Status‘ and ‘Time in Assignee‘ metrics.
Configuration Steps: Utilizing ‘Cycles in Status’ Metric for Status ‘Waiting for Support’
Step 1: Define data source.
Step 2: Select metric Number of issues. Choose calculation ‘sum’.
Step 3: Set Display By to metric ‘Cycles in status’. Customize metric distribution slots to group issues.
Step 4: (Optional) Set Group by to ‘Request Type’ or ‘Assignee (History)’ or any other field you need to analyze.
Save the configuration. You may select datasets of issues directly from the chart for further investigation.
View the recorded video encompassing the provided configuration:
Configuration Steps: Setting and Tracking Target for Average Number of Cycles in Status on Your Dashboard
Step 1: Add data source, e.g., all issues created the past 3 months; Assignees A, B, and C; Issue Type ‘Support’.
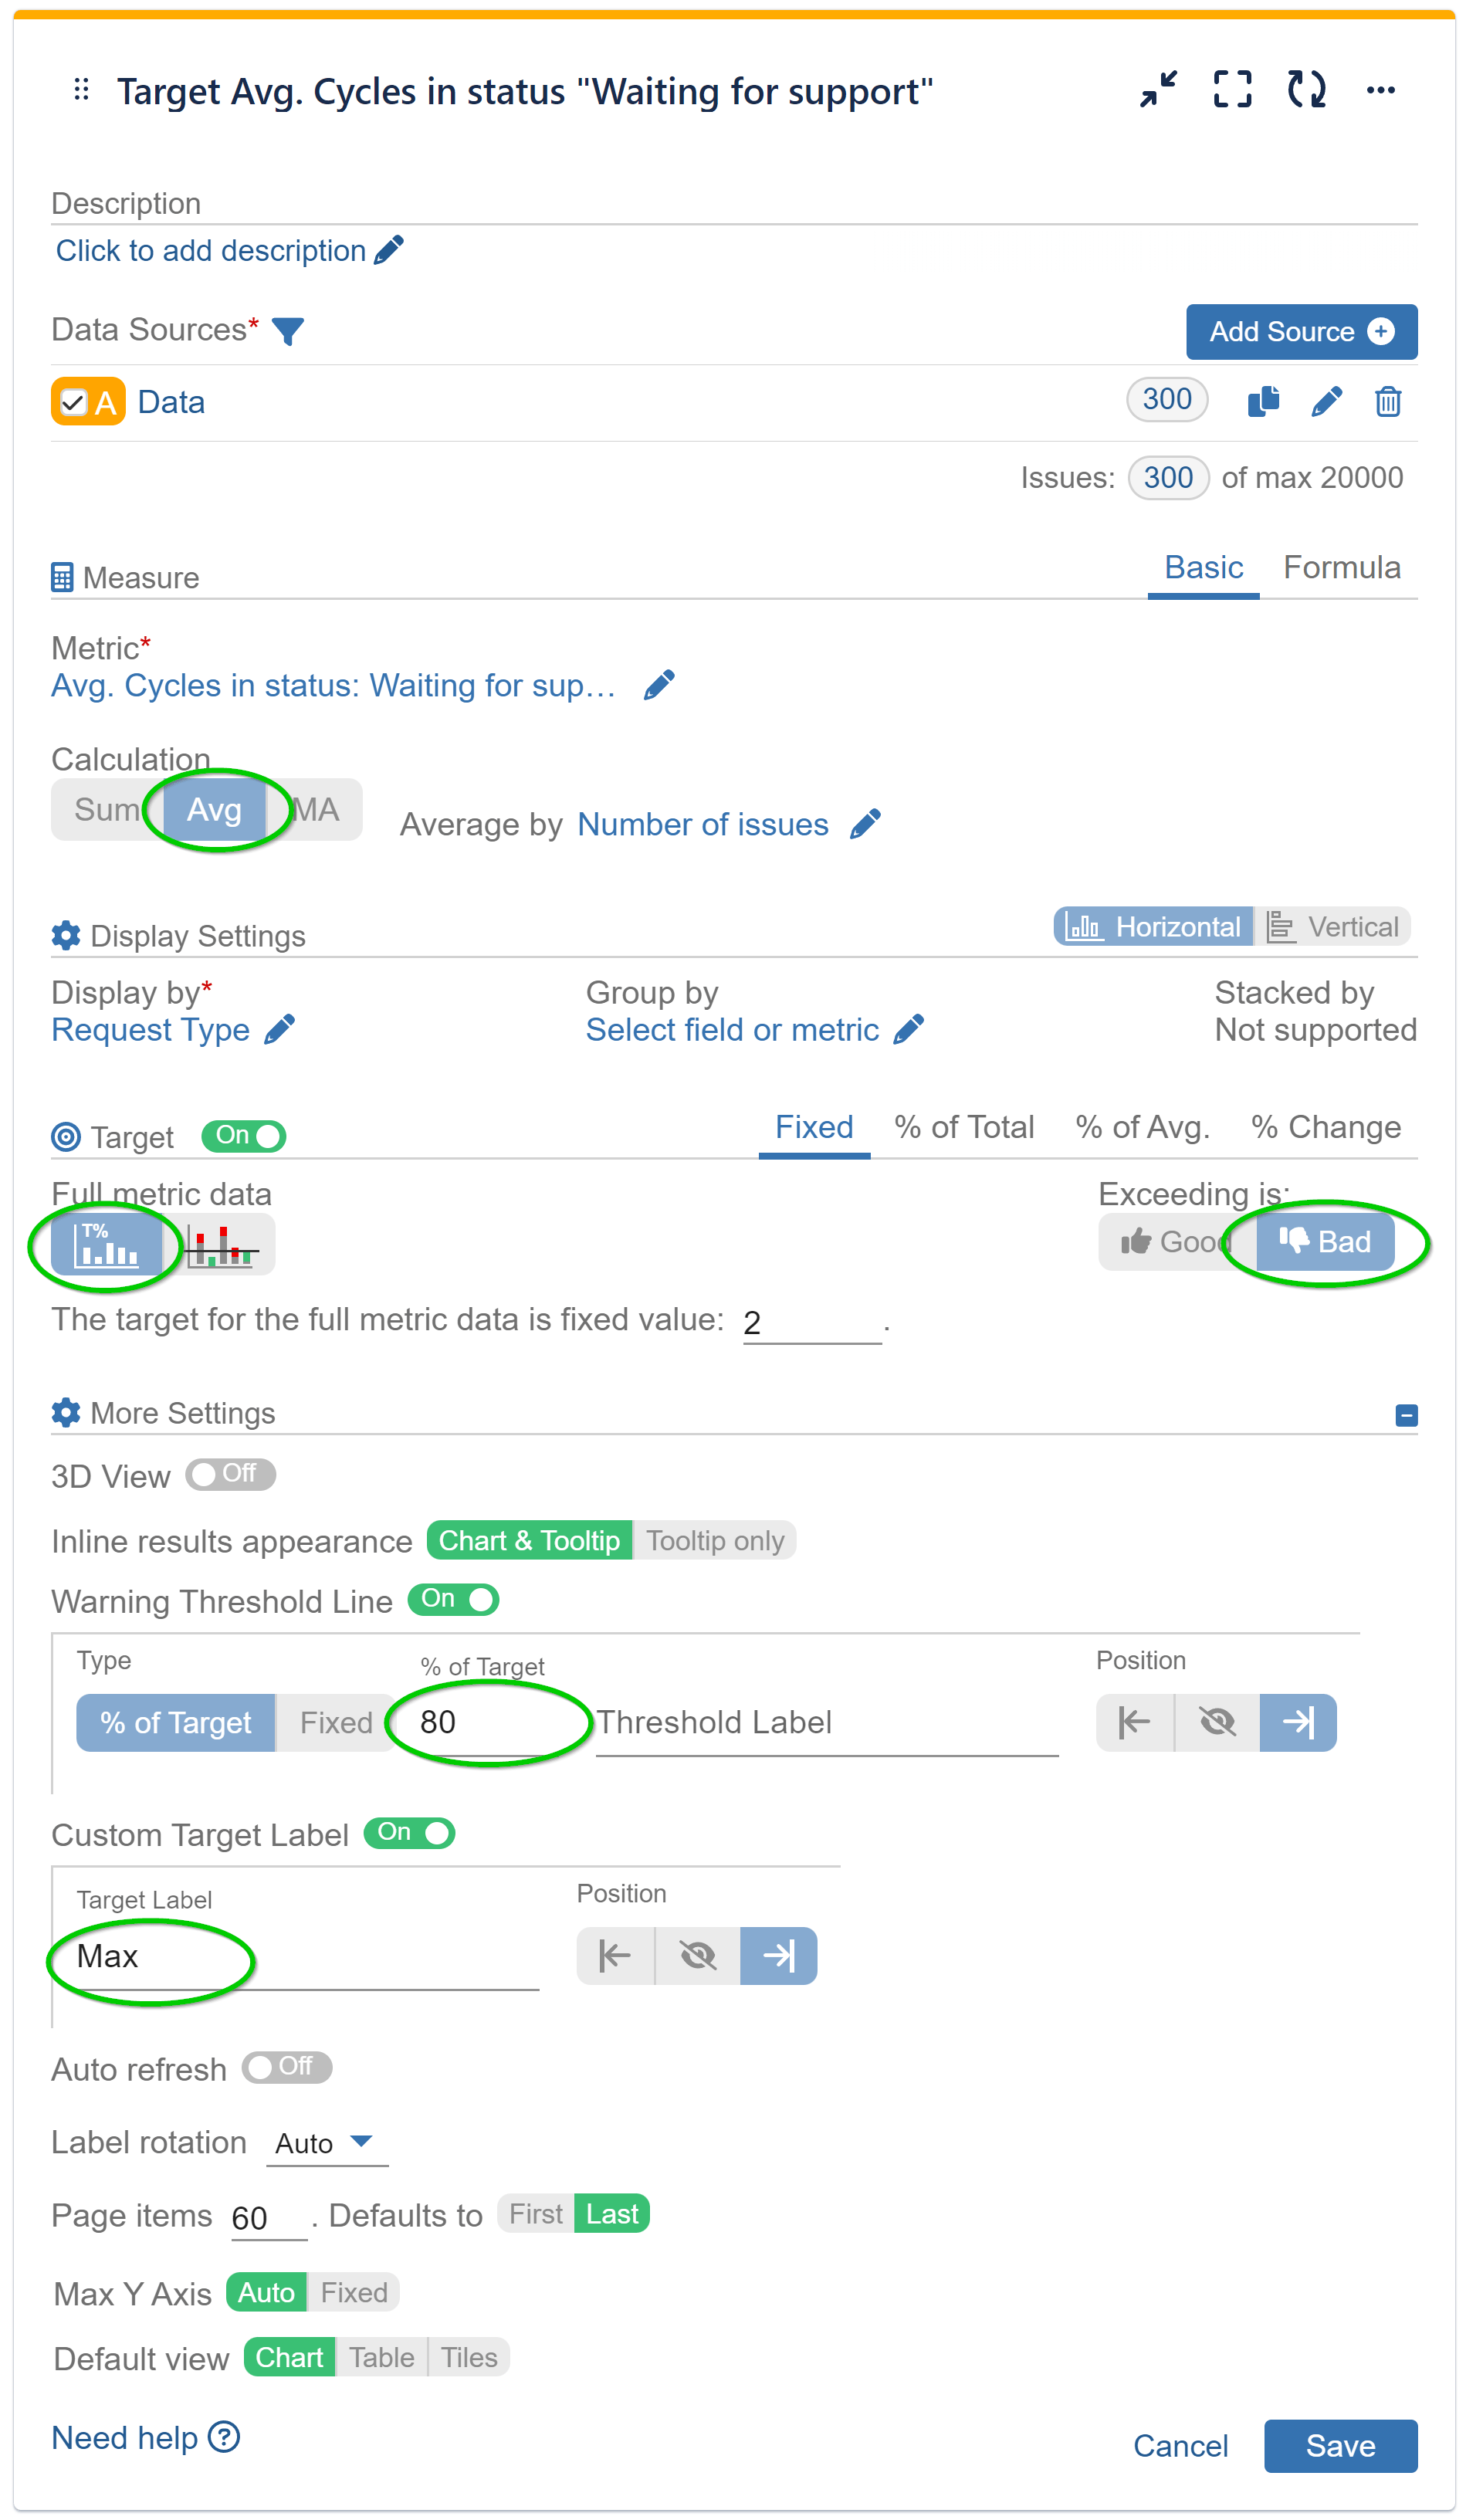
Step 2: Select Metric ‘Cycles in status’. Choose ‘Avg’ calculation.
Step 3: Select field ‘Request type’ or Assignee (history) for Display by.
Step 4: Switch-on Target section and select tab ‘Fixed’.
Step 5: Set fixed value target for the full metric data.
Step 6: Set target as negative. When ‘Exceeding is’ is set to Bad, the results above the target are considered negative.
Step 7: (Optional) Under ‘More Settings’ section enable ‘Warning threshold’ and select threshold as % of target or fixed number. Fill in label name.
Step 8: (Optional) Under ‘More Settings’ section enable ‘Custom Target Label’ and fill in label name.
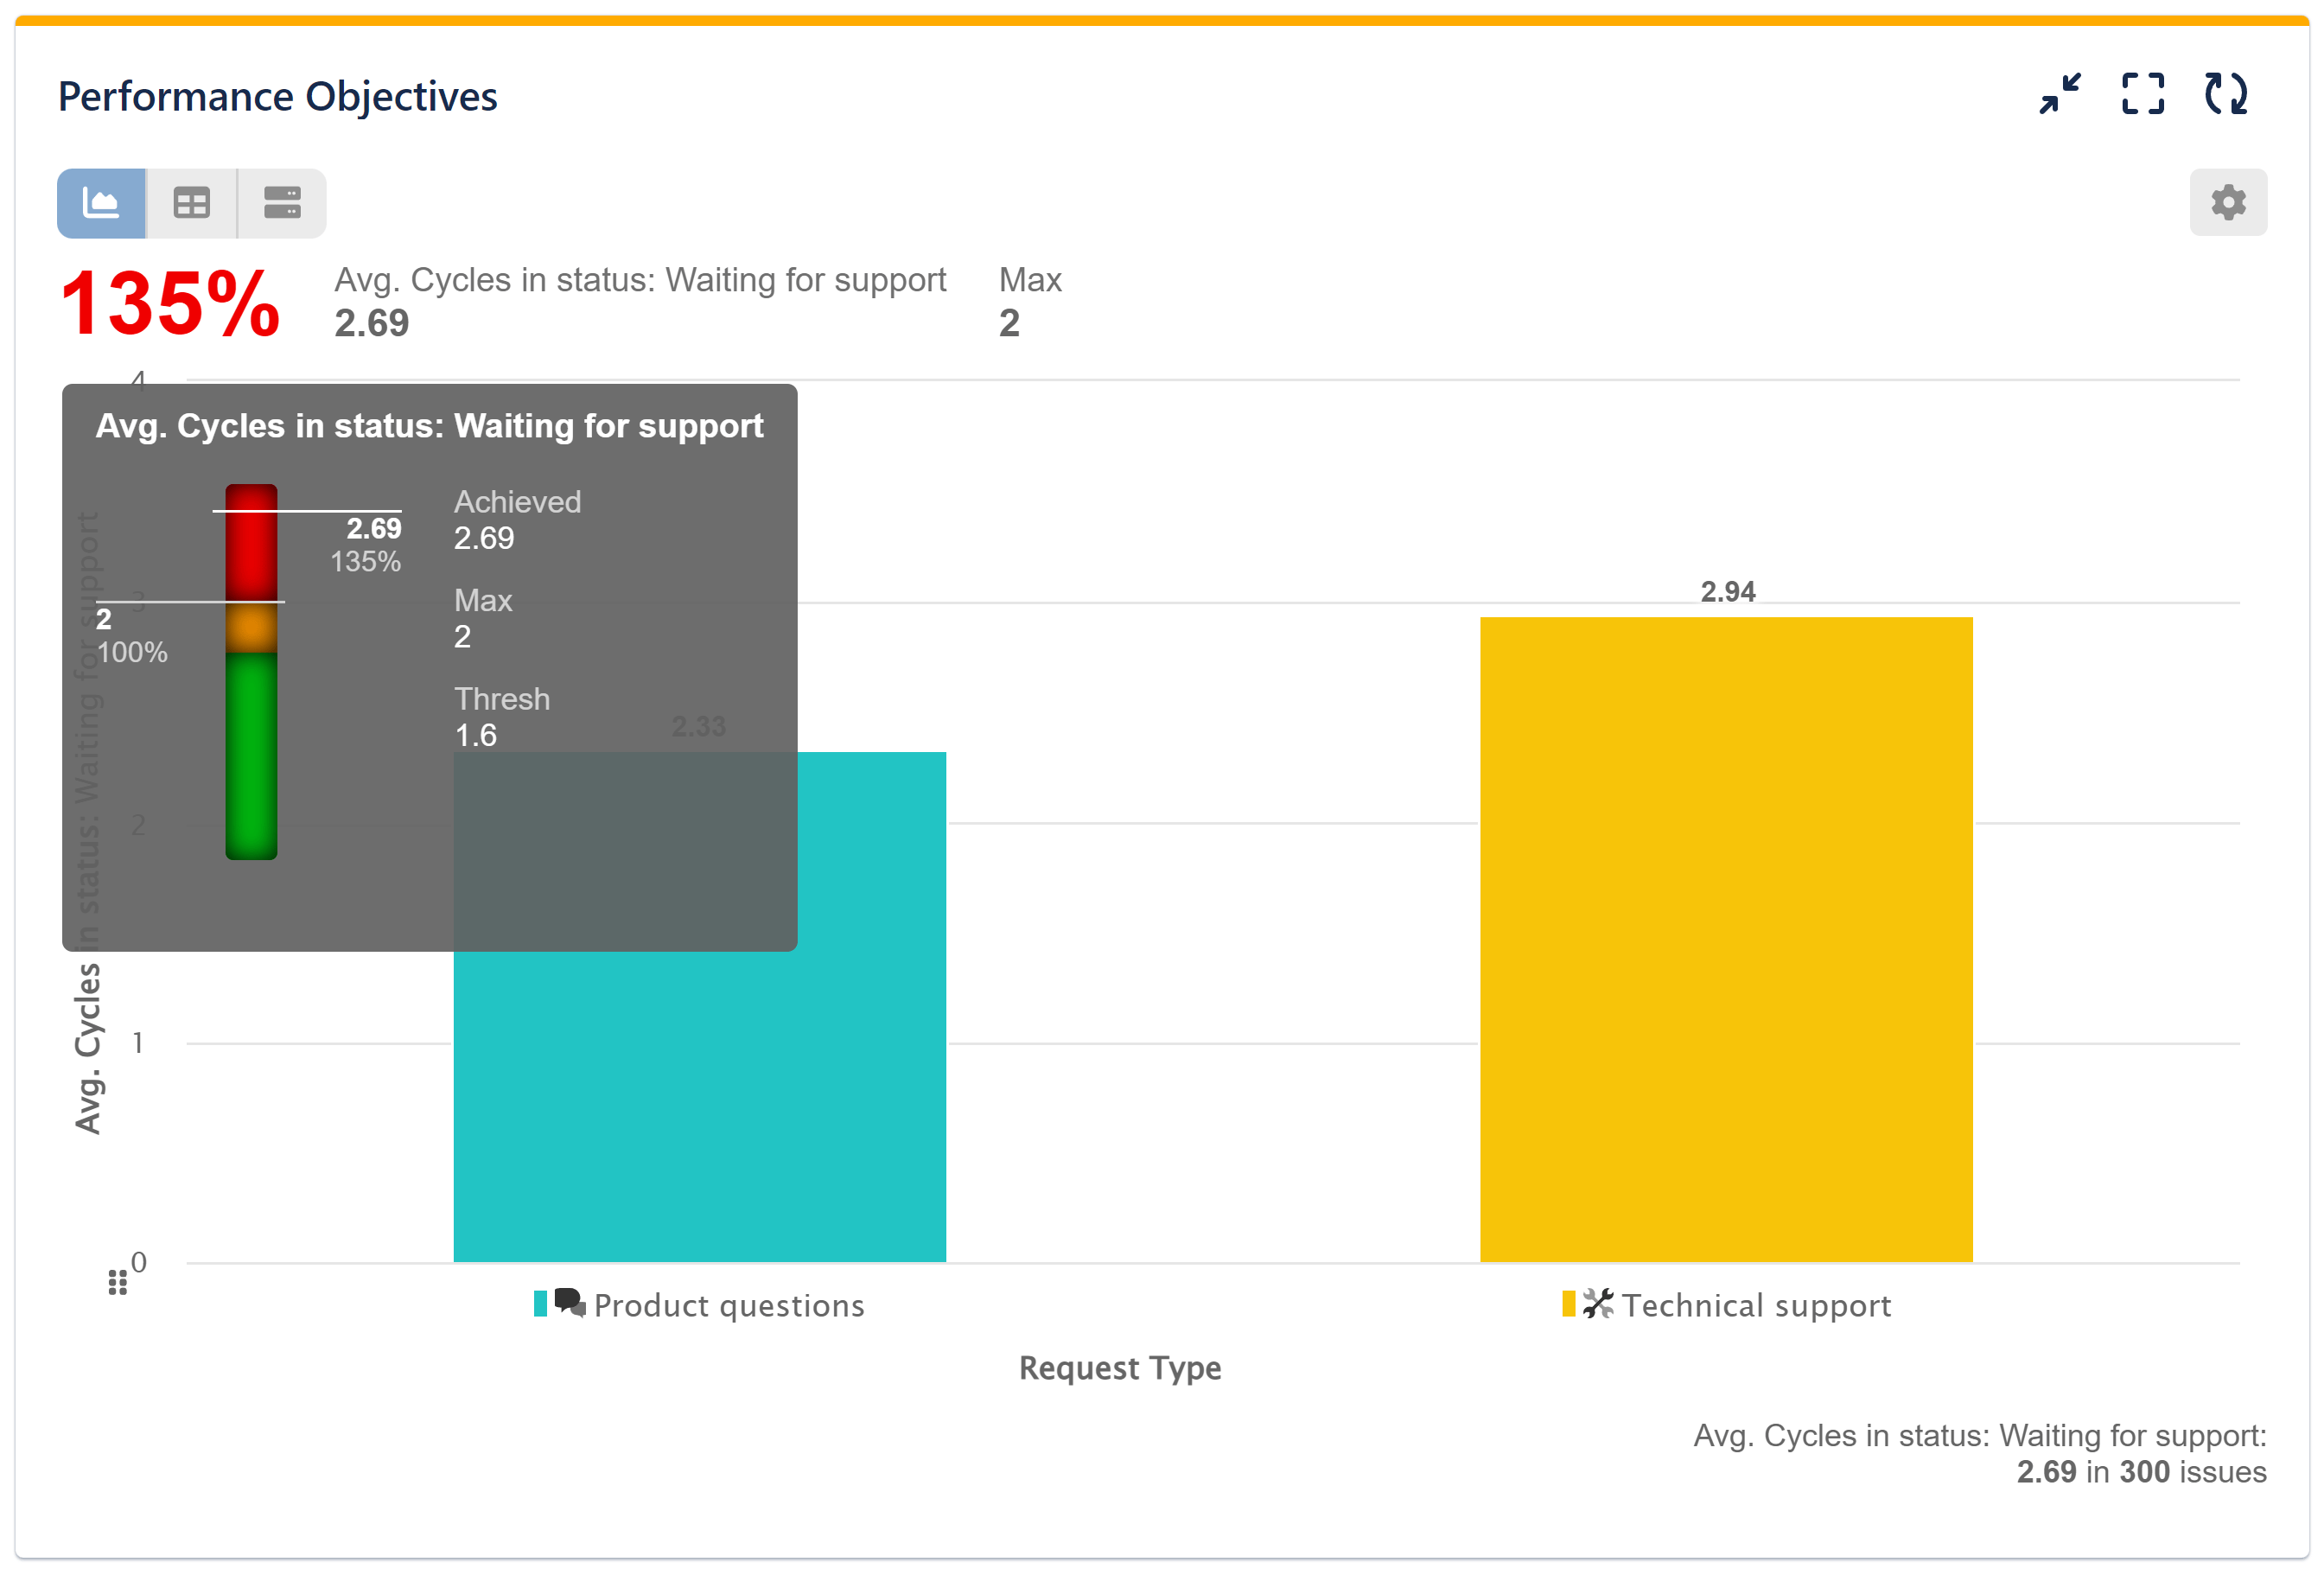
View the Configuration visualization with Tooltip Selected for Target Achievement:
If you need help with the configuration of this or any other KPI, please contact our support.
Start your 30 days free trial of Performance Objectives: Charts for Jira from Atlassian Marketplace.