Table of Contents
The Performance Objectives: Charts for Jira app provides a distinctive and valuable feature called Moving Average, which can serve as a powerful target calculation. With the ability to set targets as a percentage of the Moving Average, this feature allows for dynamic goal-setting based on current or other metrics. In this article, we will explore how Moving Average can be utilized as a key performance indicator (KPI) and its benefits in tracking long-term objectives and performance trends.
Utilizing Moving Average as a KPI:
The Moving Average feature for target calculation is available in both the Performance Objectives and Performance Trend dashboard gadgets. By setting targets as a percentage of the Moving Average, you can gain valuable insights into the overall trend and identify whether there is a consistent improvement or decline in productivity. This approach helps smooth out random or temporary fluctuations, allowing you to focus on the long-term progress.
By setting targets as a percentage of the Moving Average, you can assess whether the trend of improvement or decline is being maintained over time. This enables you to evaluate the effectiveness of various initiatives, such as training programs, marketing campaigns, or improvements in your products and services.
It is important to note that relying solely on one indicator may not provide a comprehensive view of your performance. Therefore, consider incorporating additional relevant metrics to track your progress and align with your goals. By utilizing a combination of KPIs and reports, you can obtain a holistic understanding of your performance and make informed decisions. Check out our KPI Examples page.
Sample Use Case: Target Percentage of Moving Average for Resolved Issues per Week
To effectively monitor and track your team’s performance in resolving issues, you can set a target as a percentage of the Moving Average for Resolved issues per week. This approach allows you to establish a relevant and achievable target based on the smoothed data, providing a more accurate representation of your team’s progress over time. By incorporating this target into your Jira Dashboard, you can easily monitor changes and deviations from the moving average, enabling proactive decision-making and performance improvement.
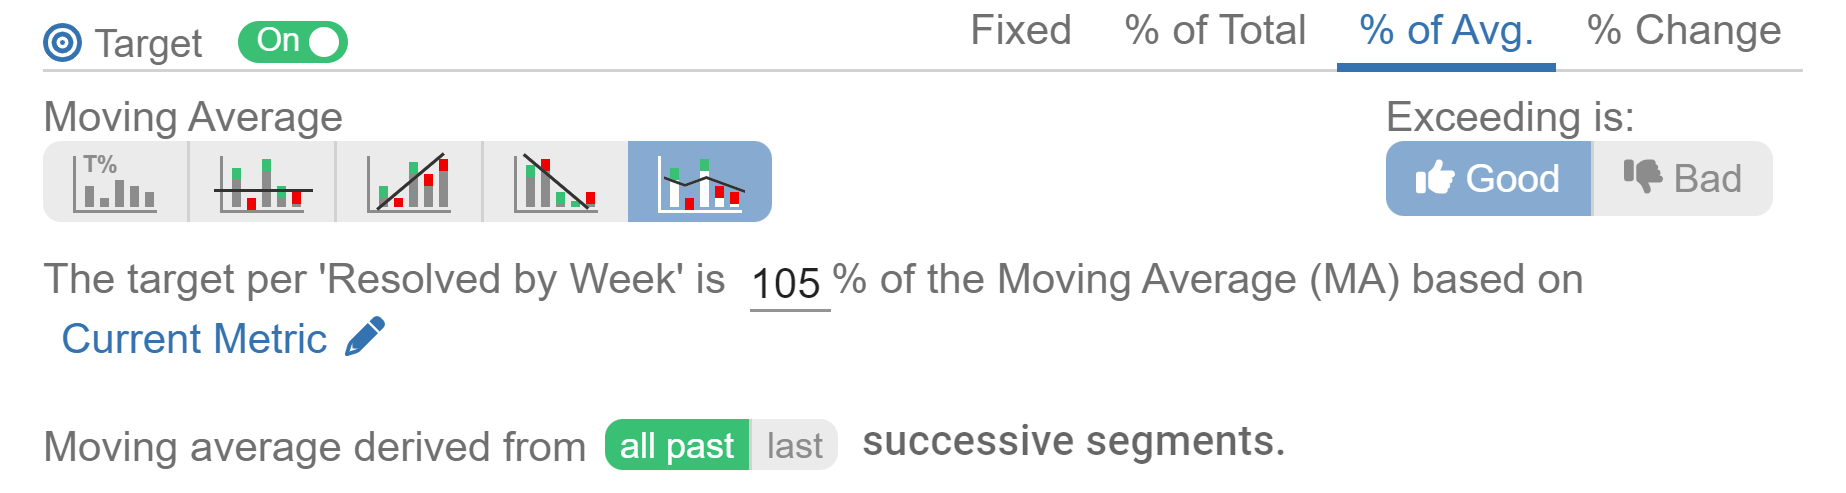
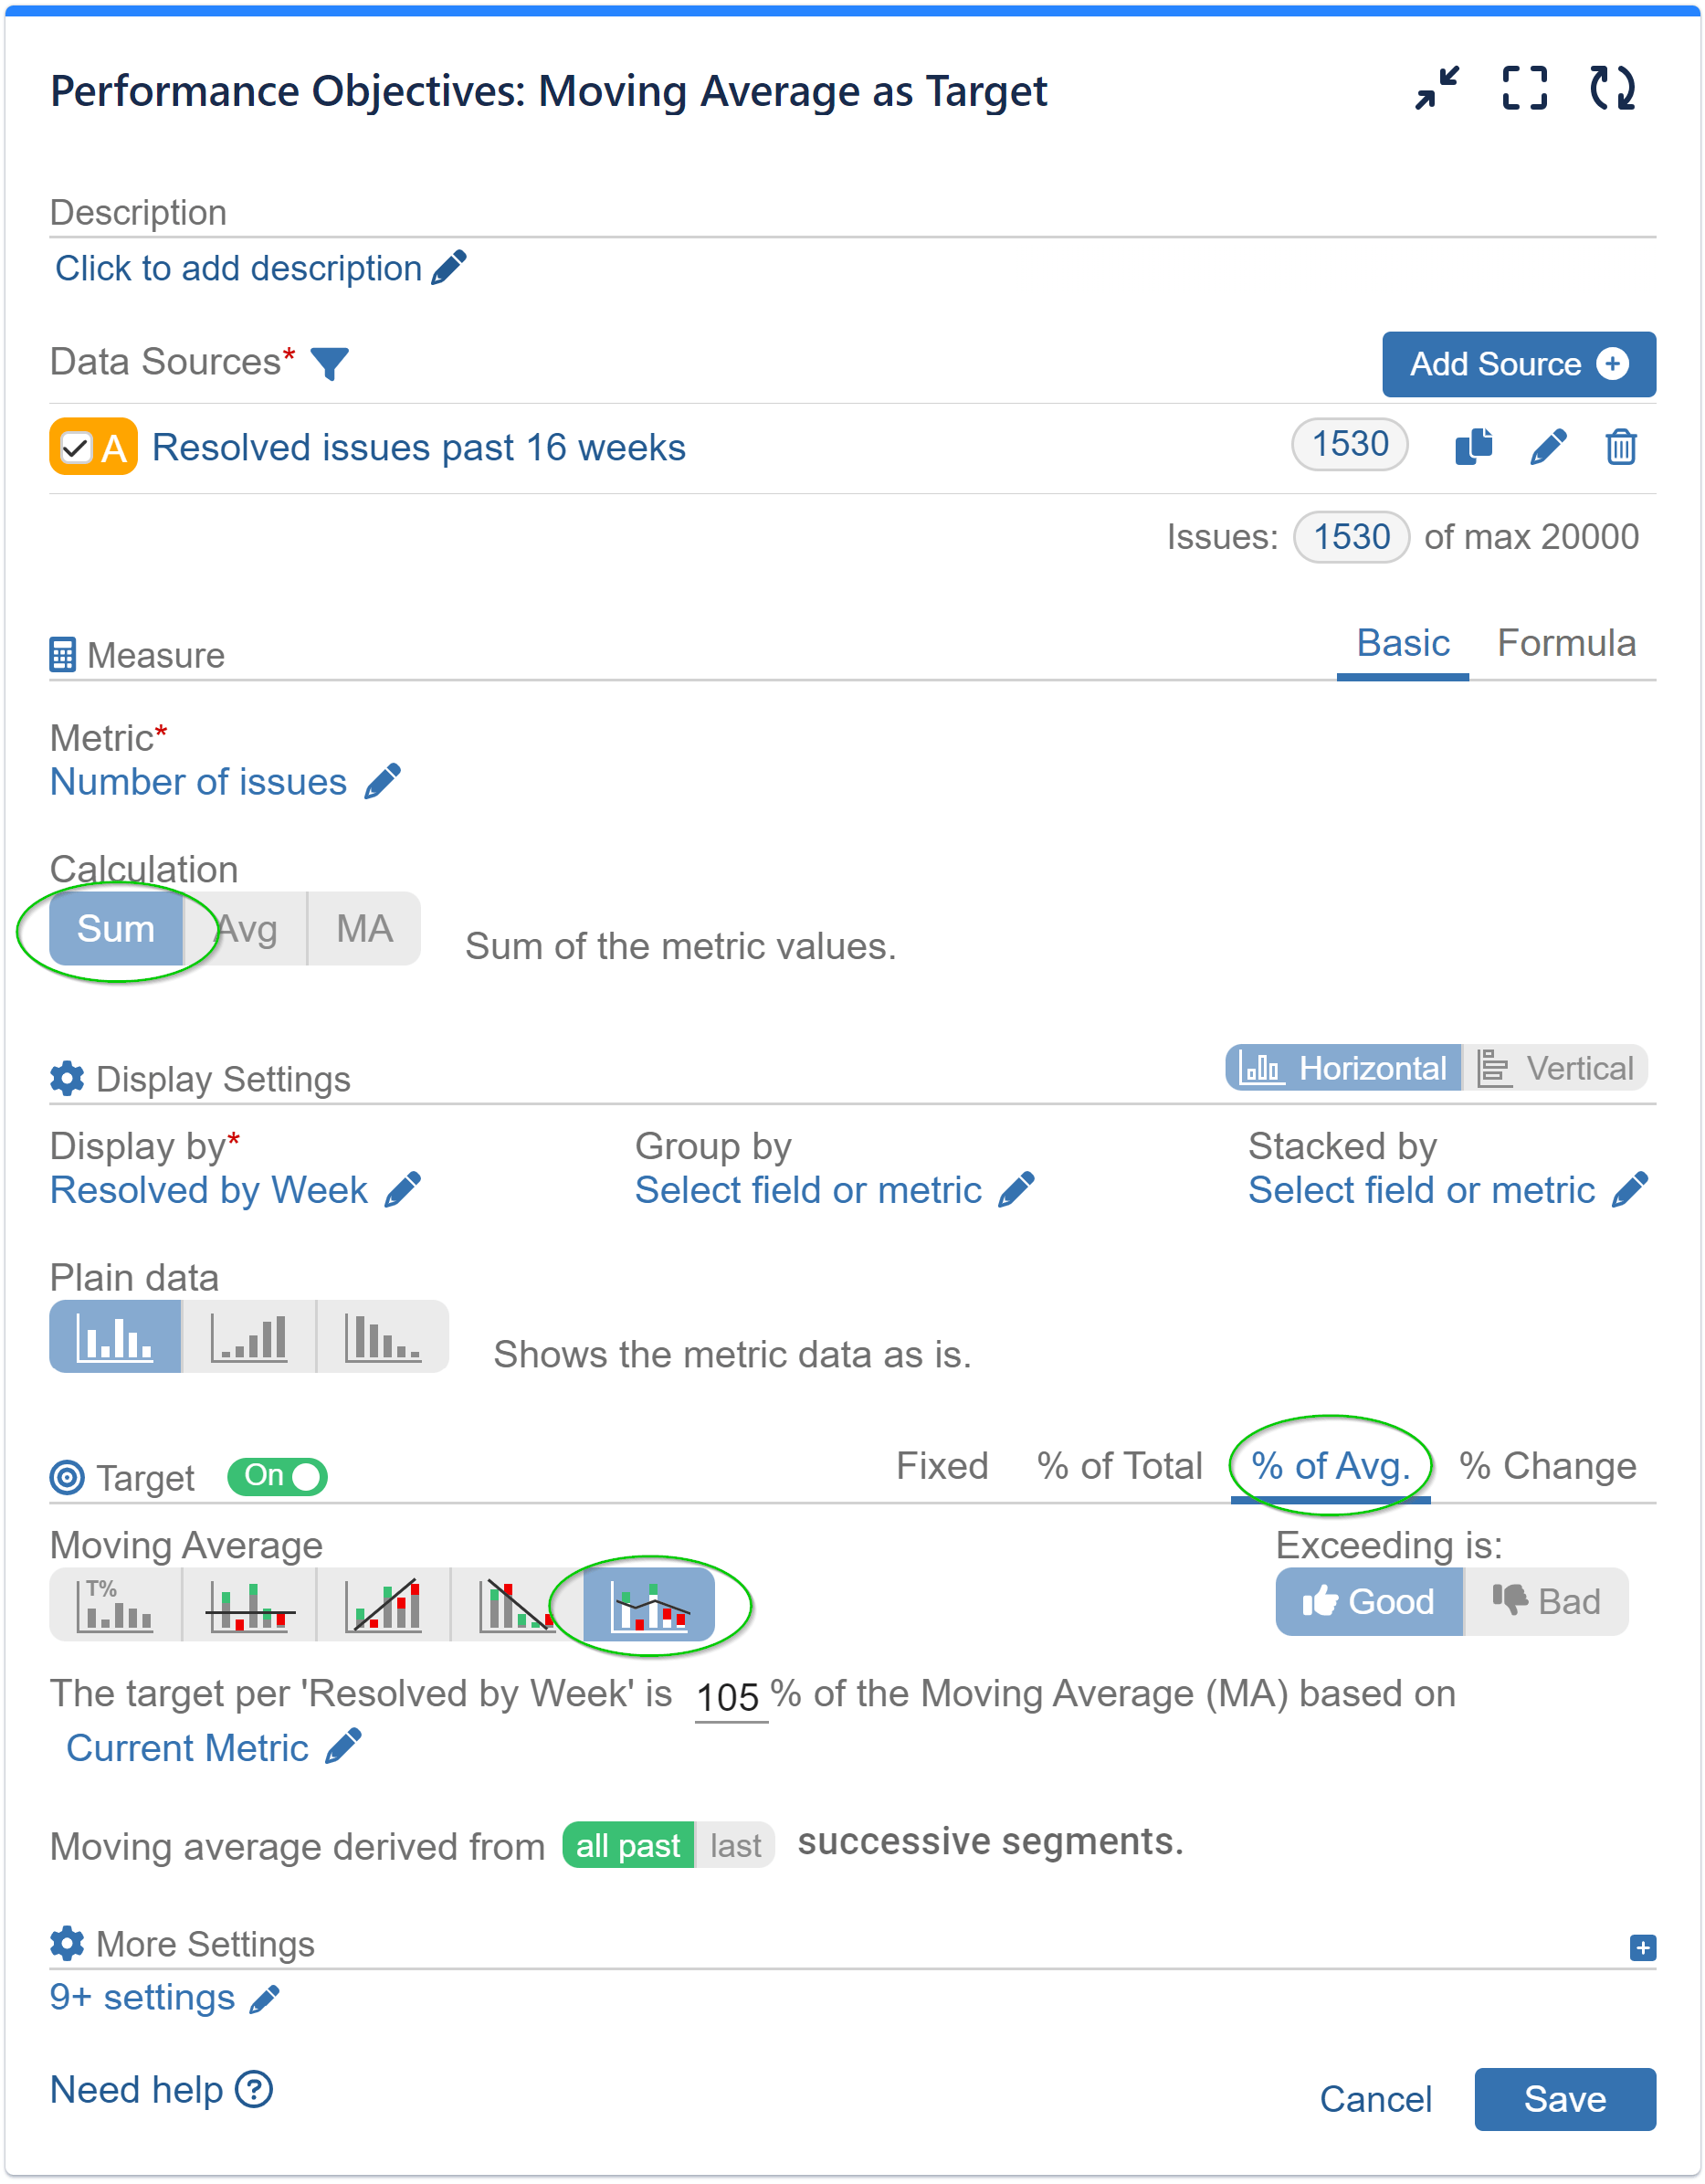
The screenshot on the right illustrates the configuration for tracking Resolved Issues per week over a 16-week period. The target is configured as 105% of the Moving Average for the current metric, taking into account all past successive segments (indicated by the green color). This setting allows you to establish a target based on the historical performance trends captured by the Moving Average.
Adding a Warning Threshold Line to the Chart
To elevate the visual representation of your chart and effectively emphasize crucial data points for improved analysis and decision-making, you can leverage the customization options provided by the Performance Objectives gadget. One of these options includes the ability to add a warning threshold to your chart. By incorporating a warning threshold, you can draw attention to specific thresholds or levels within your data, enabling you to identify areas of concern or significance at a glance.
To incorporate a warning threshold line into your chart, follow these steps:
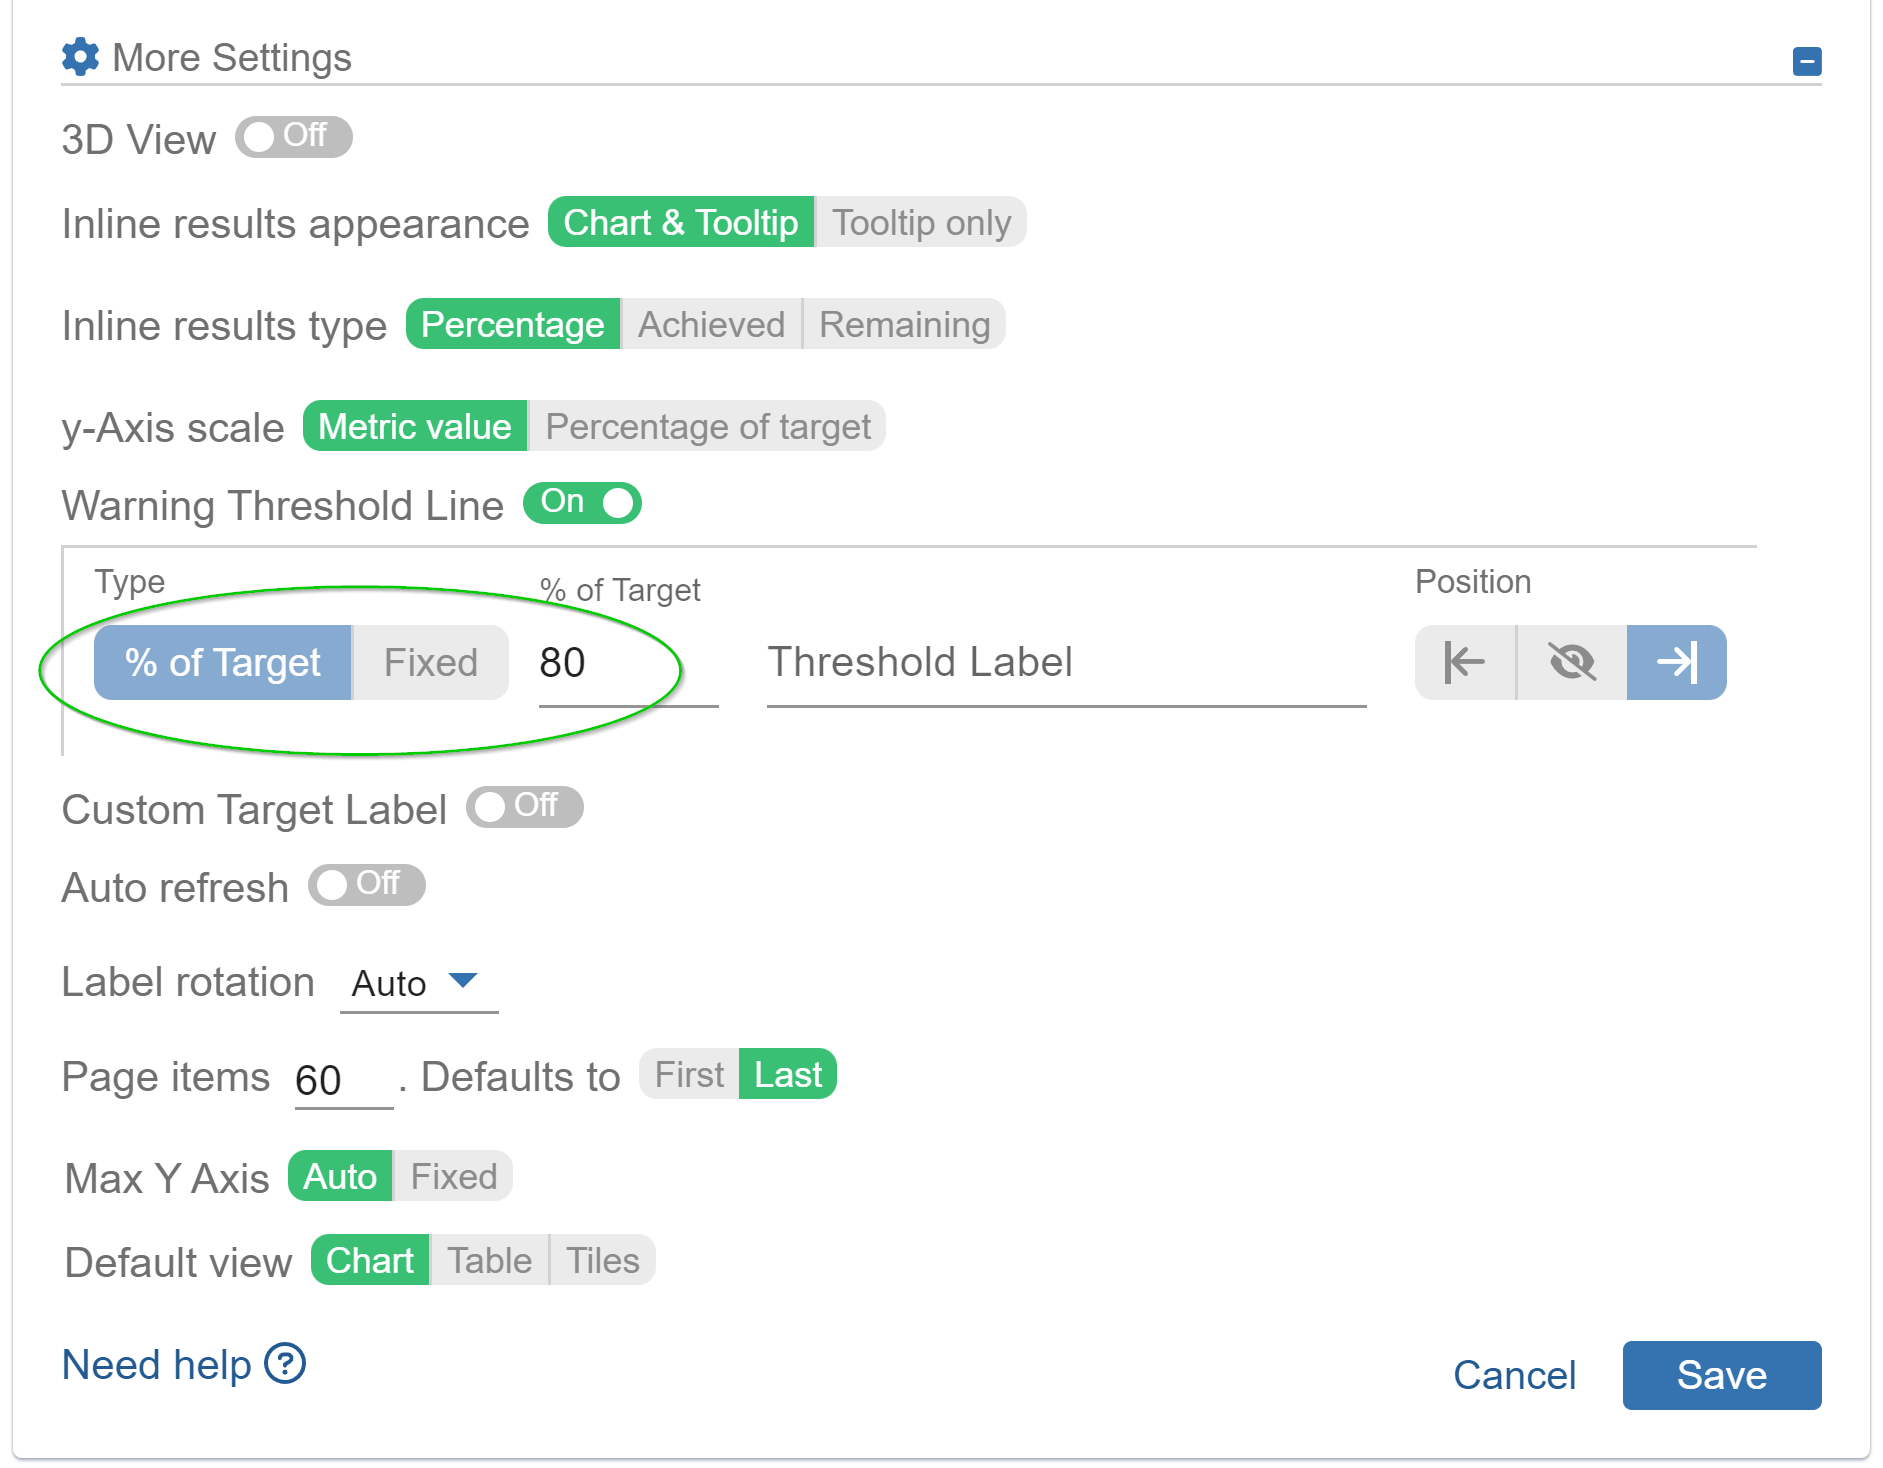
- Open the ‘More Settings’ section to access additional customization options.
- In the example screenshot below, the threshold is set to 80% of the target. This configuration will color values above the threshold level and below the target in amber, drawing attention to potential areas of concern.
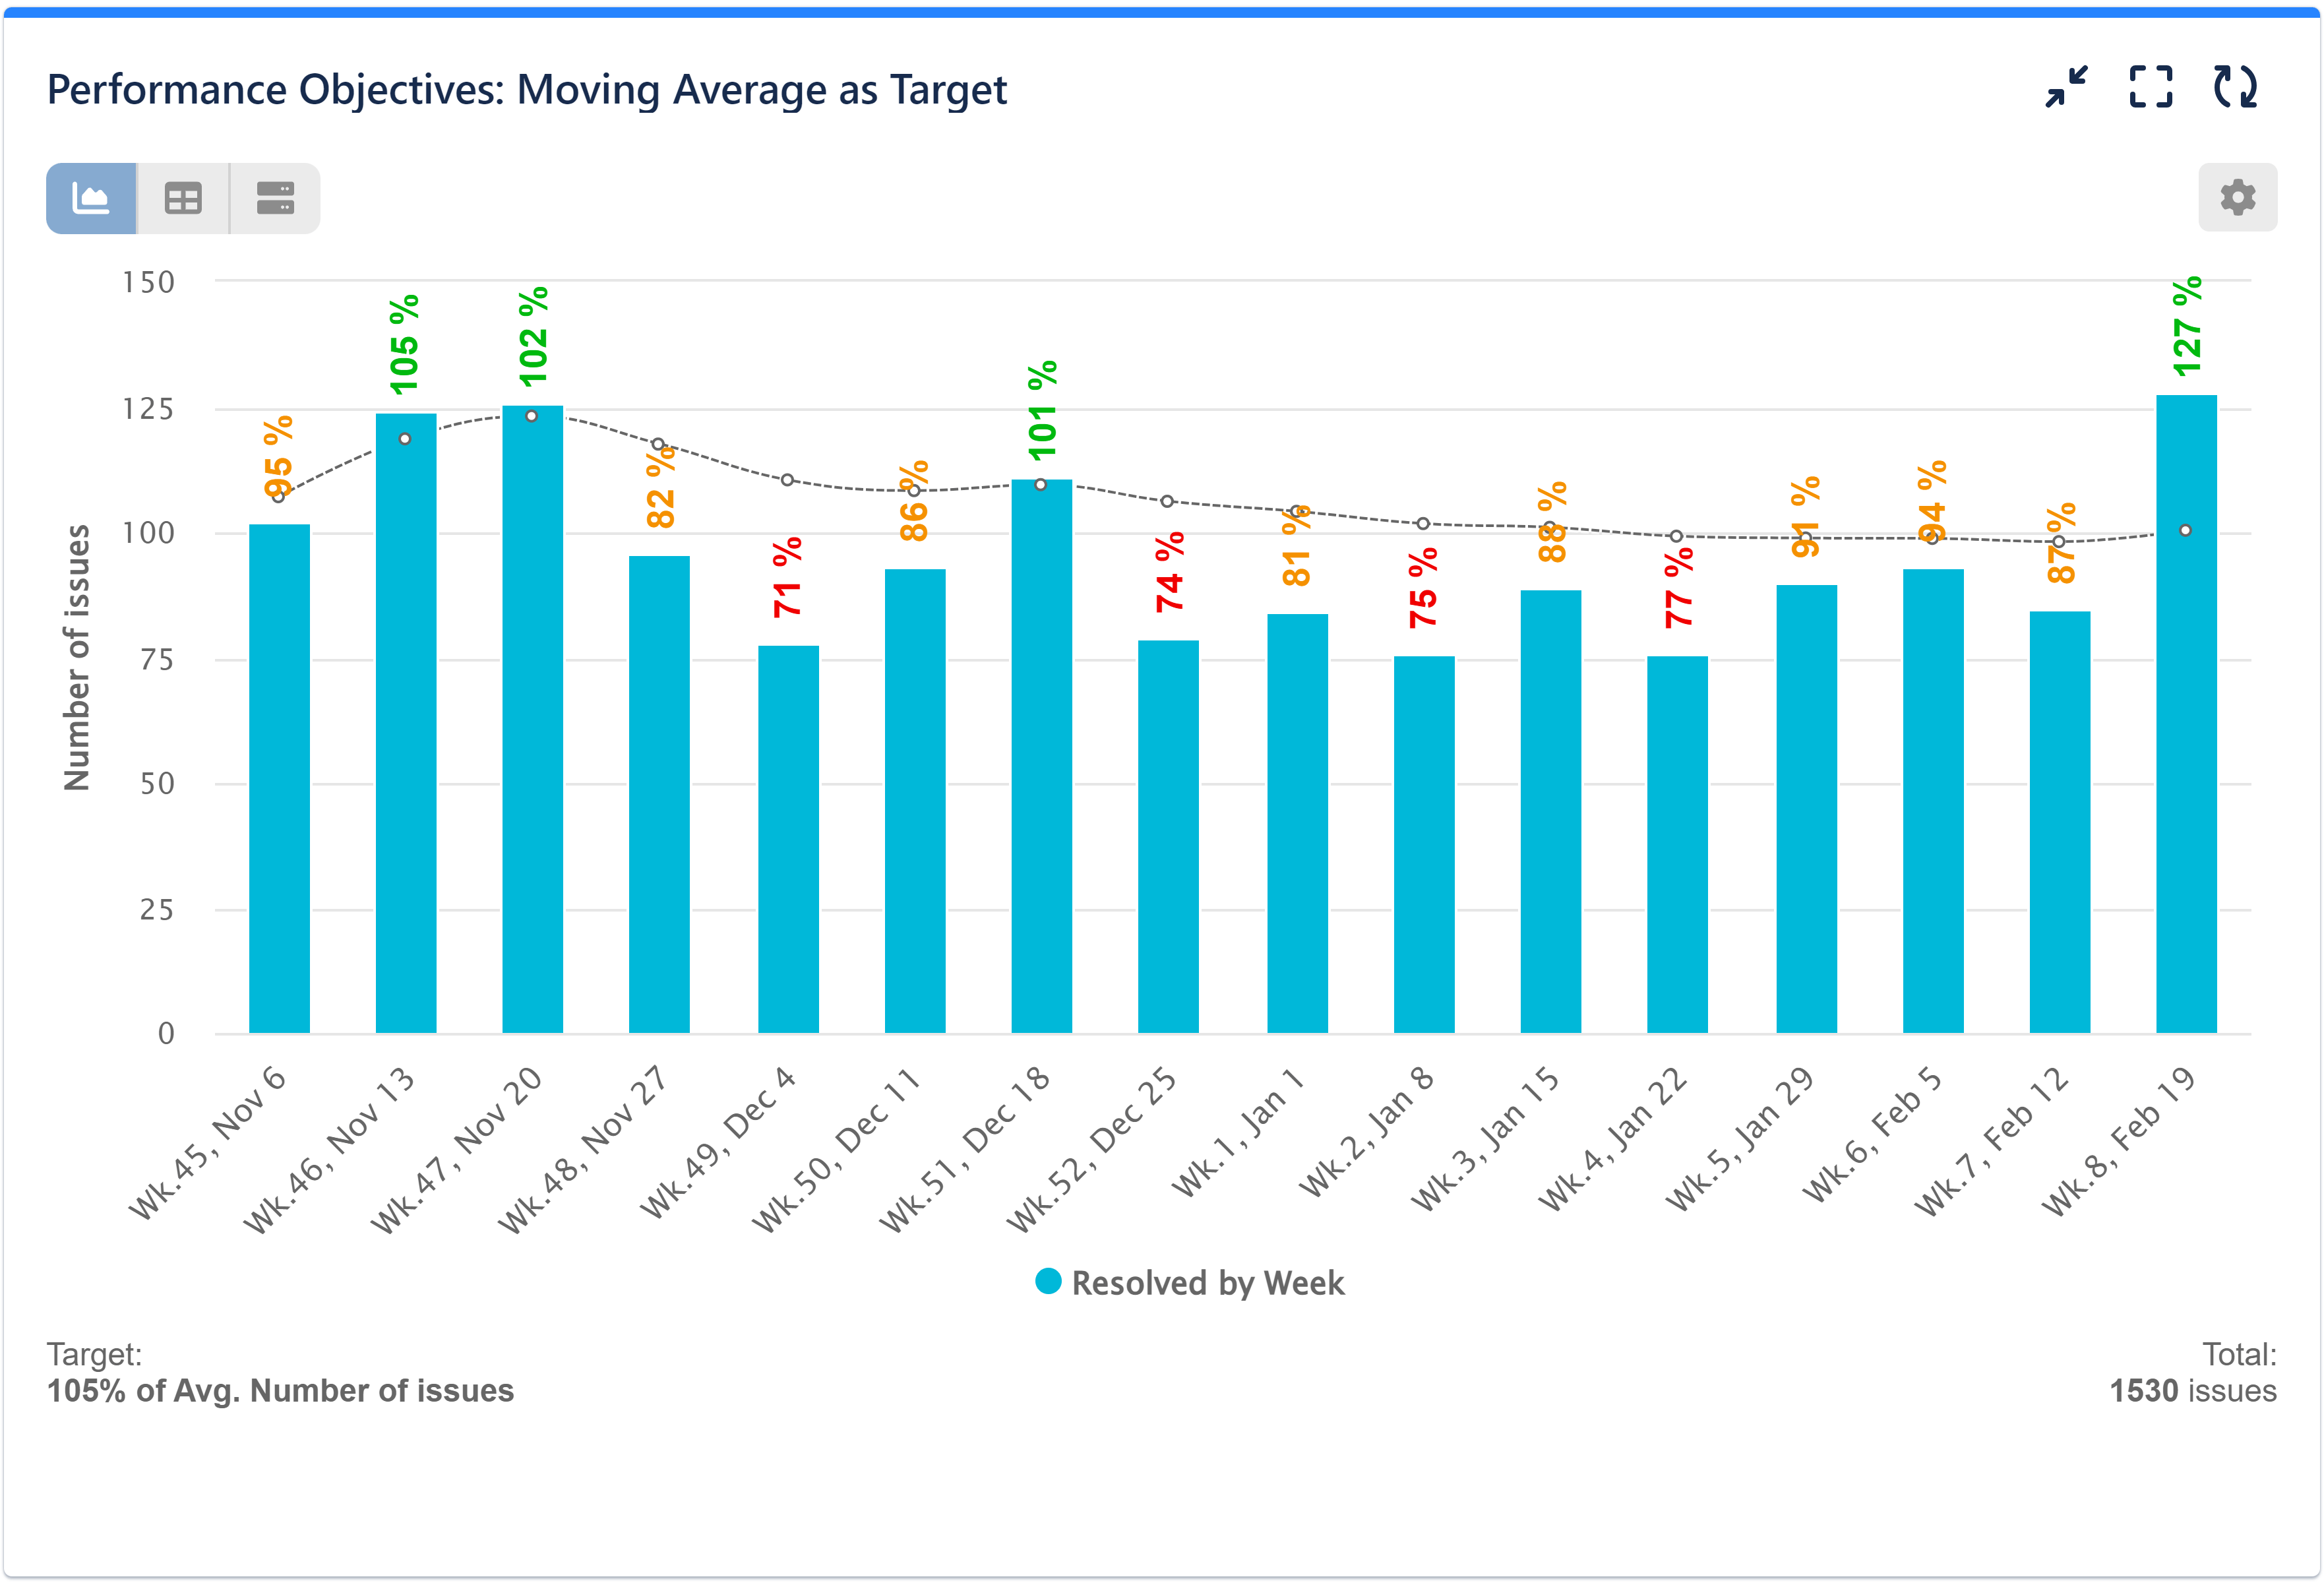
Here is the visualization with the above settings:
View the recorded video encompassing the provided configuration steps:
Did you know that the Performance Objectives gadget offers the ability to utilize Moving Average as a metric calculation?
If you’re looking to gain a deeper understanding this metric calculation, we invite you to explore the related article Moving Average as a metric calculation. This resource provides comprehensive insights and practical guidance on how to leverage this metric and enhance your performance analysis. It also includes a sample use case and a list of various reports that can be built using the metric.
Start your 30 days free trial of Performance Objectives: Charts for Jira from Atlassian Marketplace.