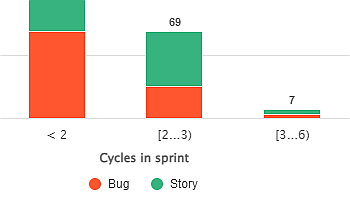
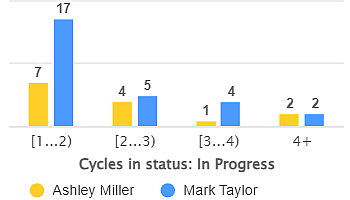
The ‘Cycles in Sprint’ metric, supported by the Performance Objectives app for Jira provides valuable insights into how many times…
The ‘Cycles in Sprint’ metric, supported by the Performance Objectives app for Jira provides valuable insights into how many times…
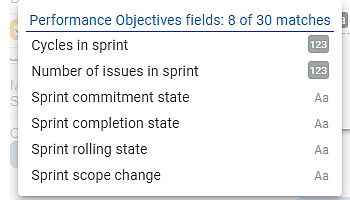
Drive productive sprint retrospectives with valuable reports using our new metrics and fields. Enhance team discussions with data-driven insights.
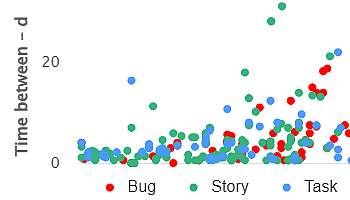
Powerful Data Insights: Harness the Potential of Scatter Charts The Scatter chart, also known as a scatter plot, is a…
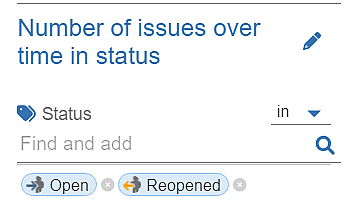
Display open issues over time in Jira Dashboard. Keep your ticketing process under control using ‘Number of Issues over time…
Use ‘Group by’ in Performance Objectives app to break down data by a second dimension, that can be any Jira field, metric, or custom segment.
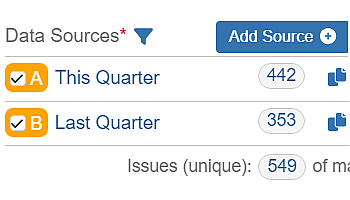
Use Multiple Data Sources for Enhanced Data Segmentation Performance Objectives: Charts for Jira app offers powerful capabilities to segment your…
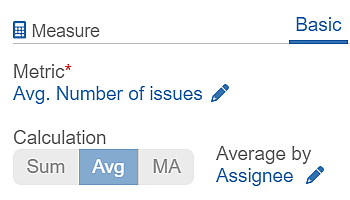
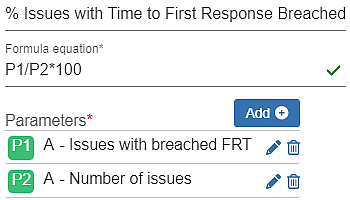
Performance Objectives: Charts for Jira offers three calculation types for metrics, providing unmatching flexibility for your Jira charts and reports.…
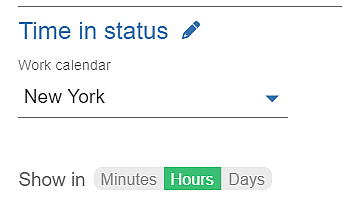
Discover the Power of ‘Time in Status’ Metric Unlock the full potential of your Jira workflow with the ‘Time in…
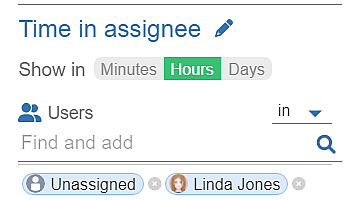
You want to know how long it takes an assignee to complete a task in Jira? Leverage the ‘Time in…
One of the features that set the Performance Objectives app for Jira apart from other charting and reporting tools on…