Table of Contents
Use Multiple Data Sources for Enhanced Data Segmentation
Performance Objectives: Charts for Jira app offers powerful capabilities to segment your data using multiple data sources. This feature allows you to divide information into distinct groups, offering a streamlined and optimized approach to leverage the data’s full potential.
With the ability to group similar data based on chosen parameters, you can maximize its utility. The app offers various segmentation options, empowering you to tailor the analysis to your specific needs. Here are some key features:
- Multiple data sources: You can add, turn on and off or delete multiple customizable sources to suit your analysis needs.
- Customizable Source Names: You can assign custom names to your data sources, enabling you to easily identify and organize them according to your preferences.
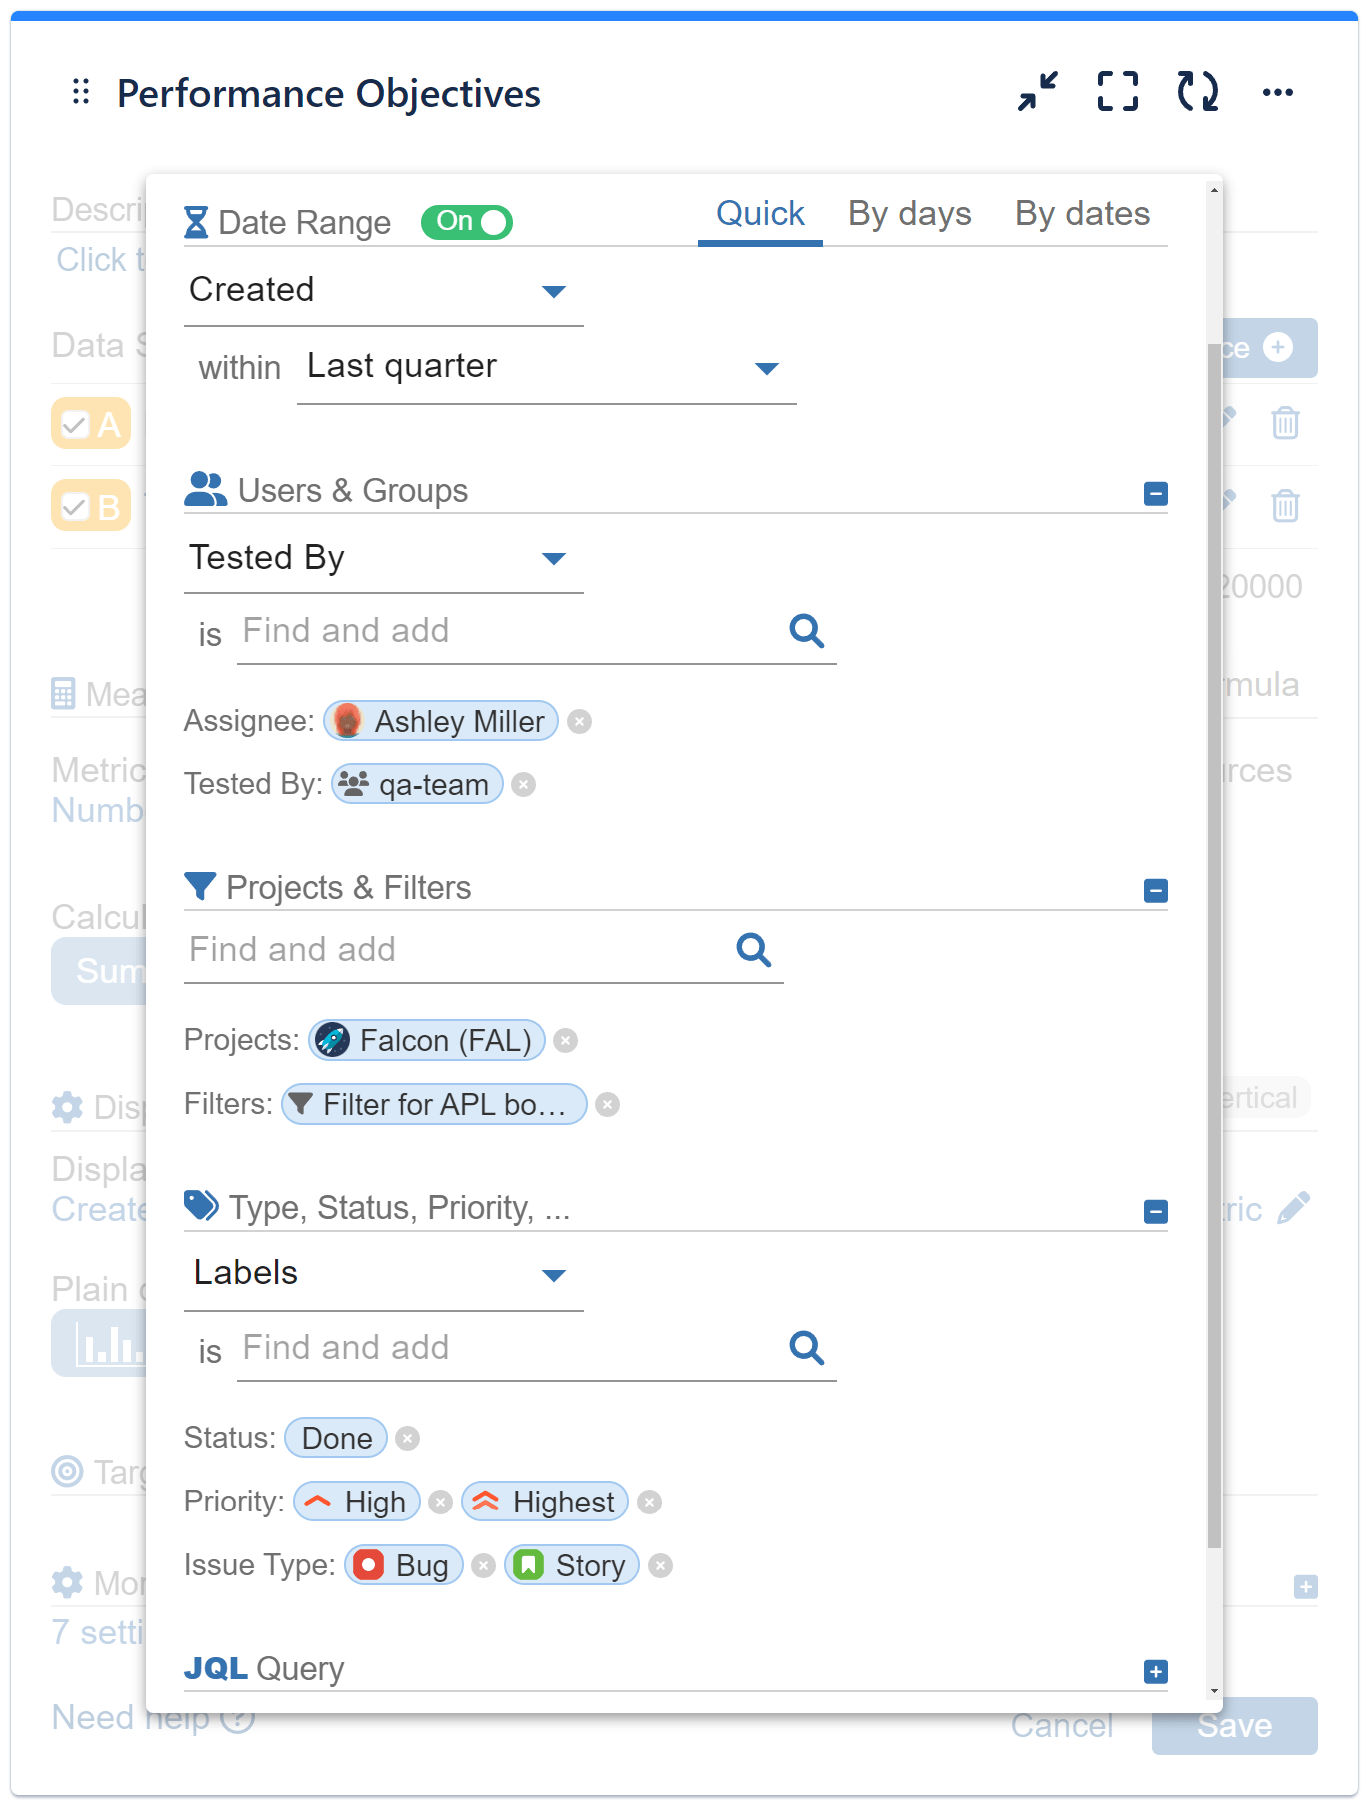
- Segmentation by Date Ranges: You have the flexibility to segment your data based on specific date ranges, such as This week, month, quarter, year and Last week, month, quarter, year, or specific date ranges such as Q1 Last year, last 30 days, within specific start and end date. This rich segmentation allows for focused analysis of performance metrics over different time periods.
- User Types and Groups: When working with multiple projects that involve distinct user role types and groups, this segmentation option is particularly useful.
- Project Filters: You can select multiple projects and also apply the filters specific to your projects, enabling you to focus on relevant data and streamline your analysis.
- You can segment your data based on various attributes such as Issue type, Status, Priority, Labels, and Resolution. This granularity allows for comprehensive analysis and targeted insights.
Take a look at the image and the video below to see sample Data Source segmentation capabilities in action.
By leveraging the multiple data sources and segmentation capabilities provided by Performance Objectives: Charts for Jira, you can enhance your data analysis and gain valuable insights to drive your objectives forward.
Data View Dimension Options
Performance Objectives: Charts for Jira offers the flexibility to utilize multiple data sources within the three available data view dimensions of the app: ‘Display By’, ‘Group By’, and ‘Stacked By’. In the following example, we will examine a use case that involves comparing the number of issues created in two consecutive quarters of the year, with a focus on analyzing specific issue types. Let’s explore how this can be accomplished using the Display By, Group By, and Stacked By data view options:
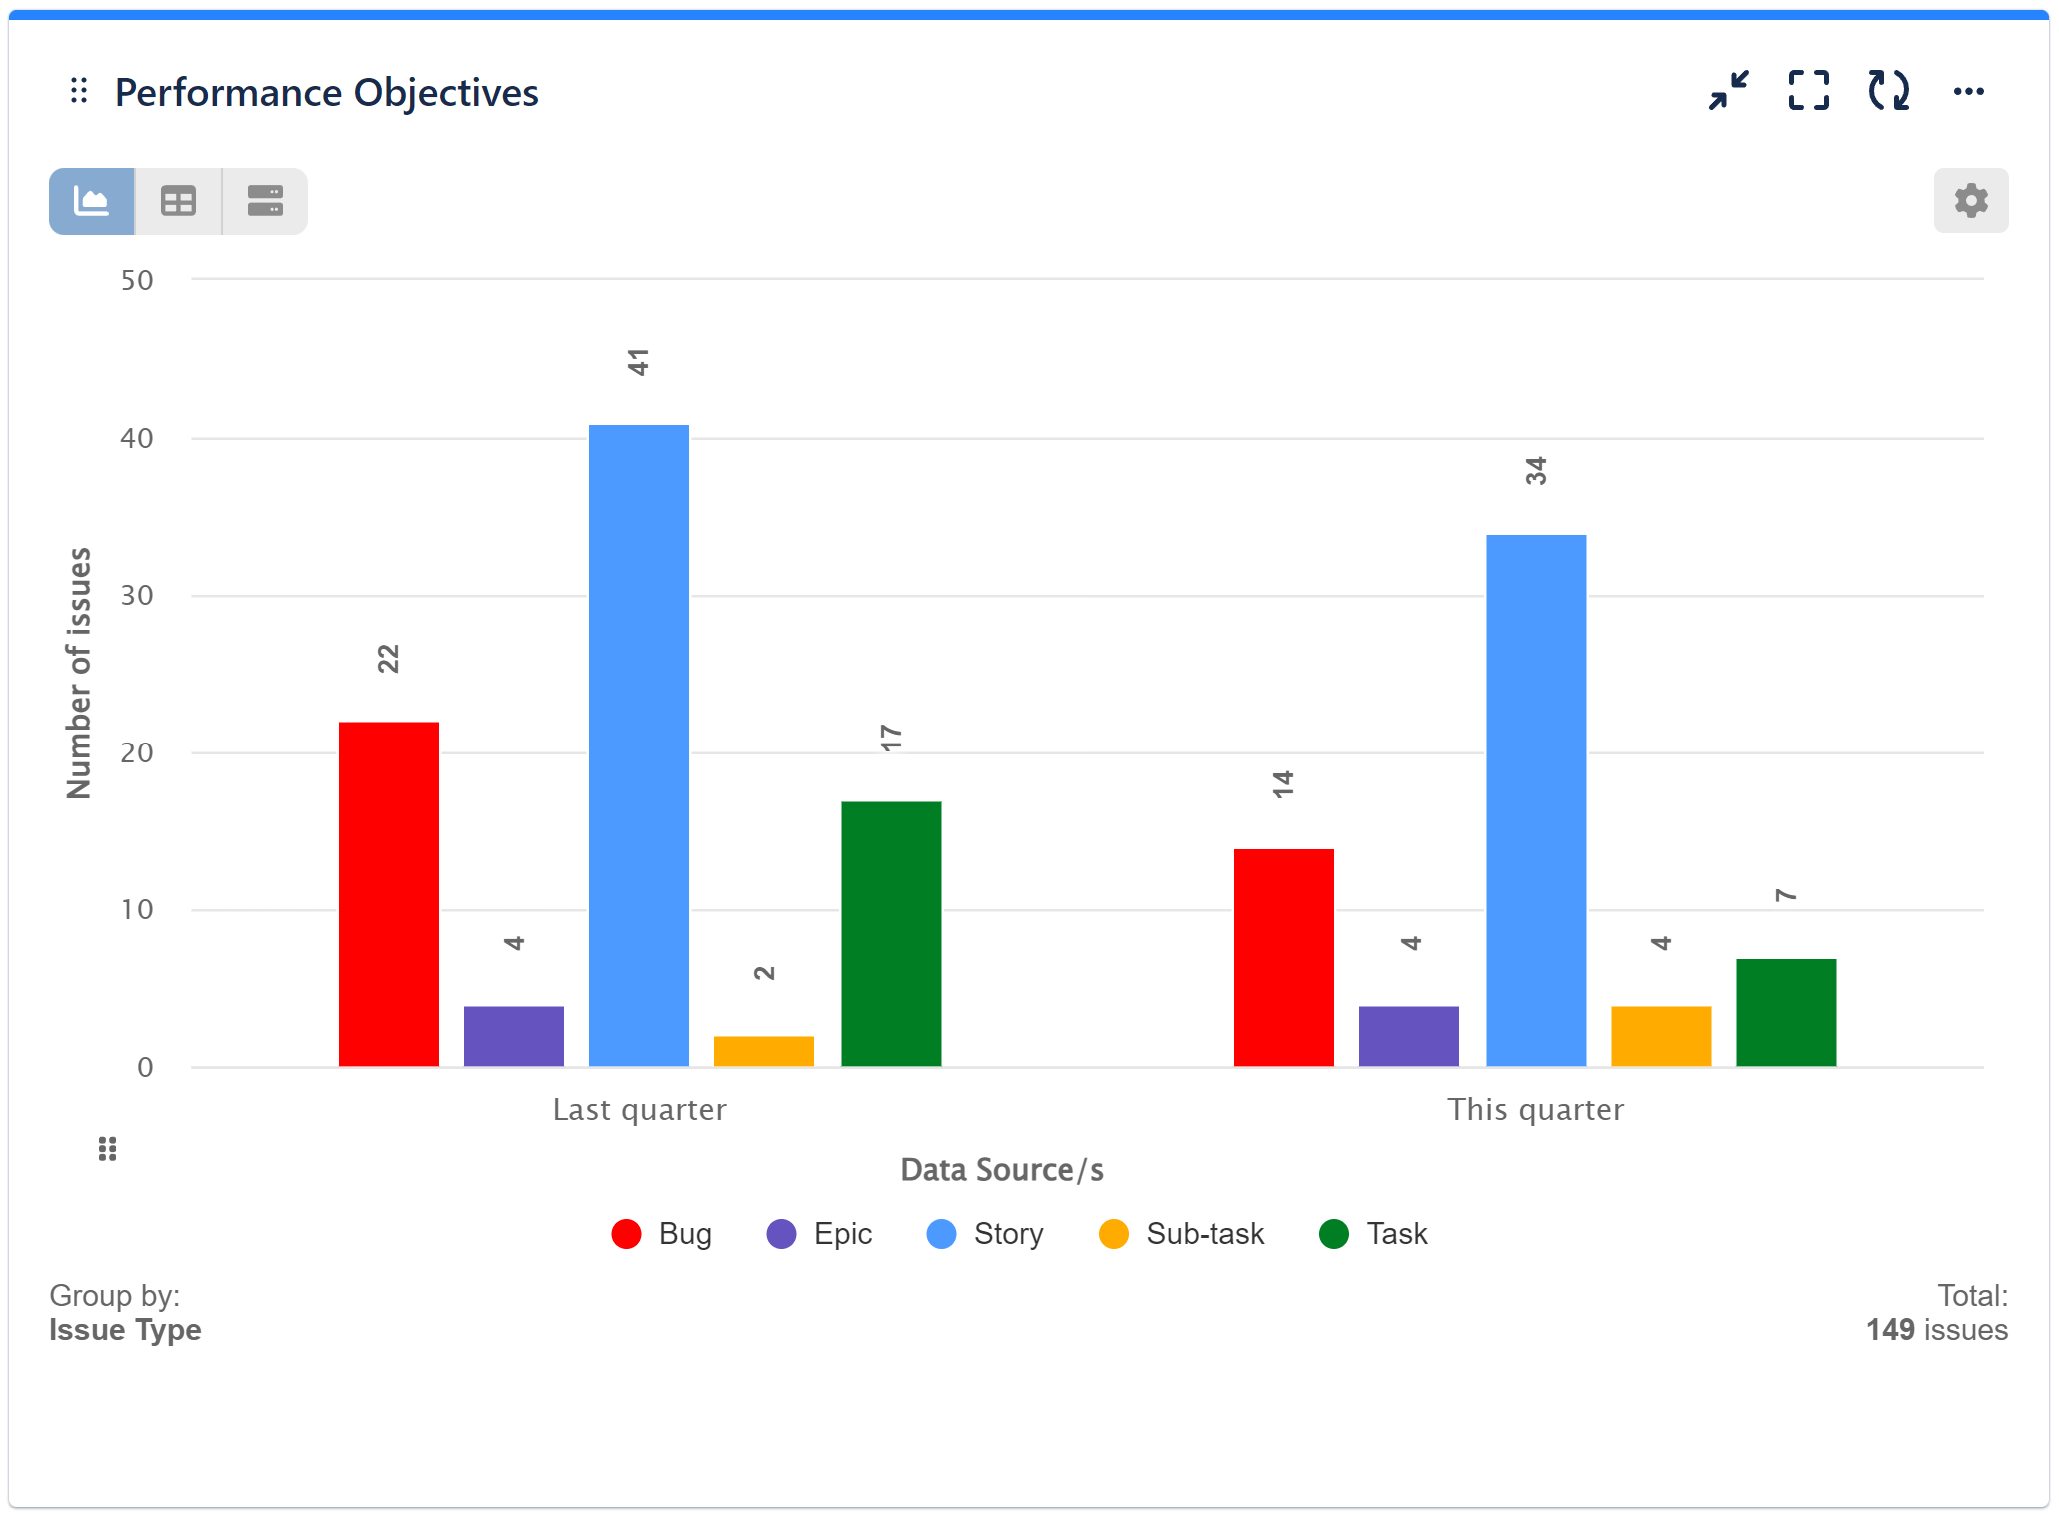
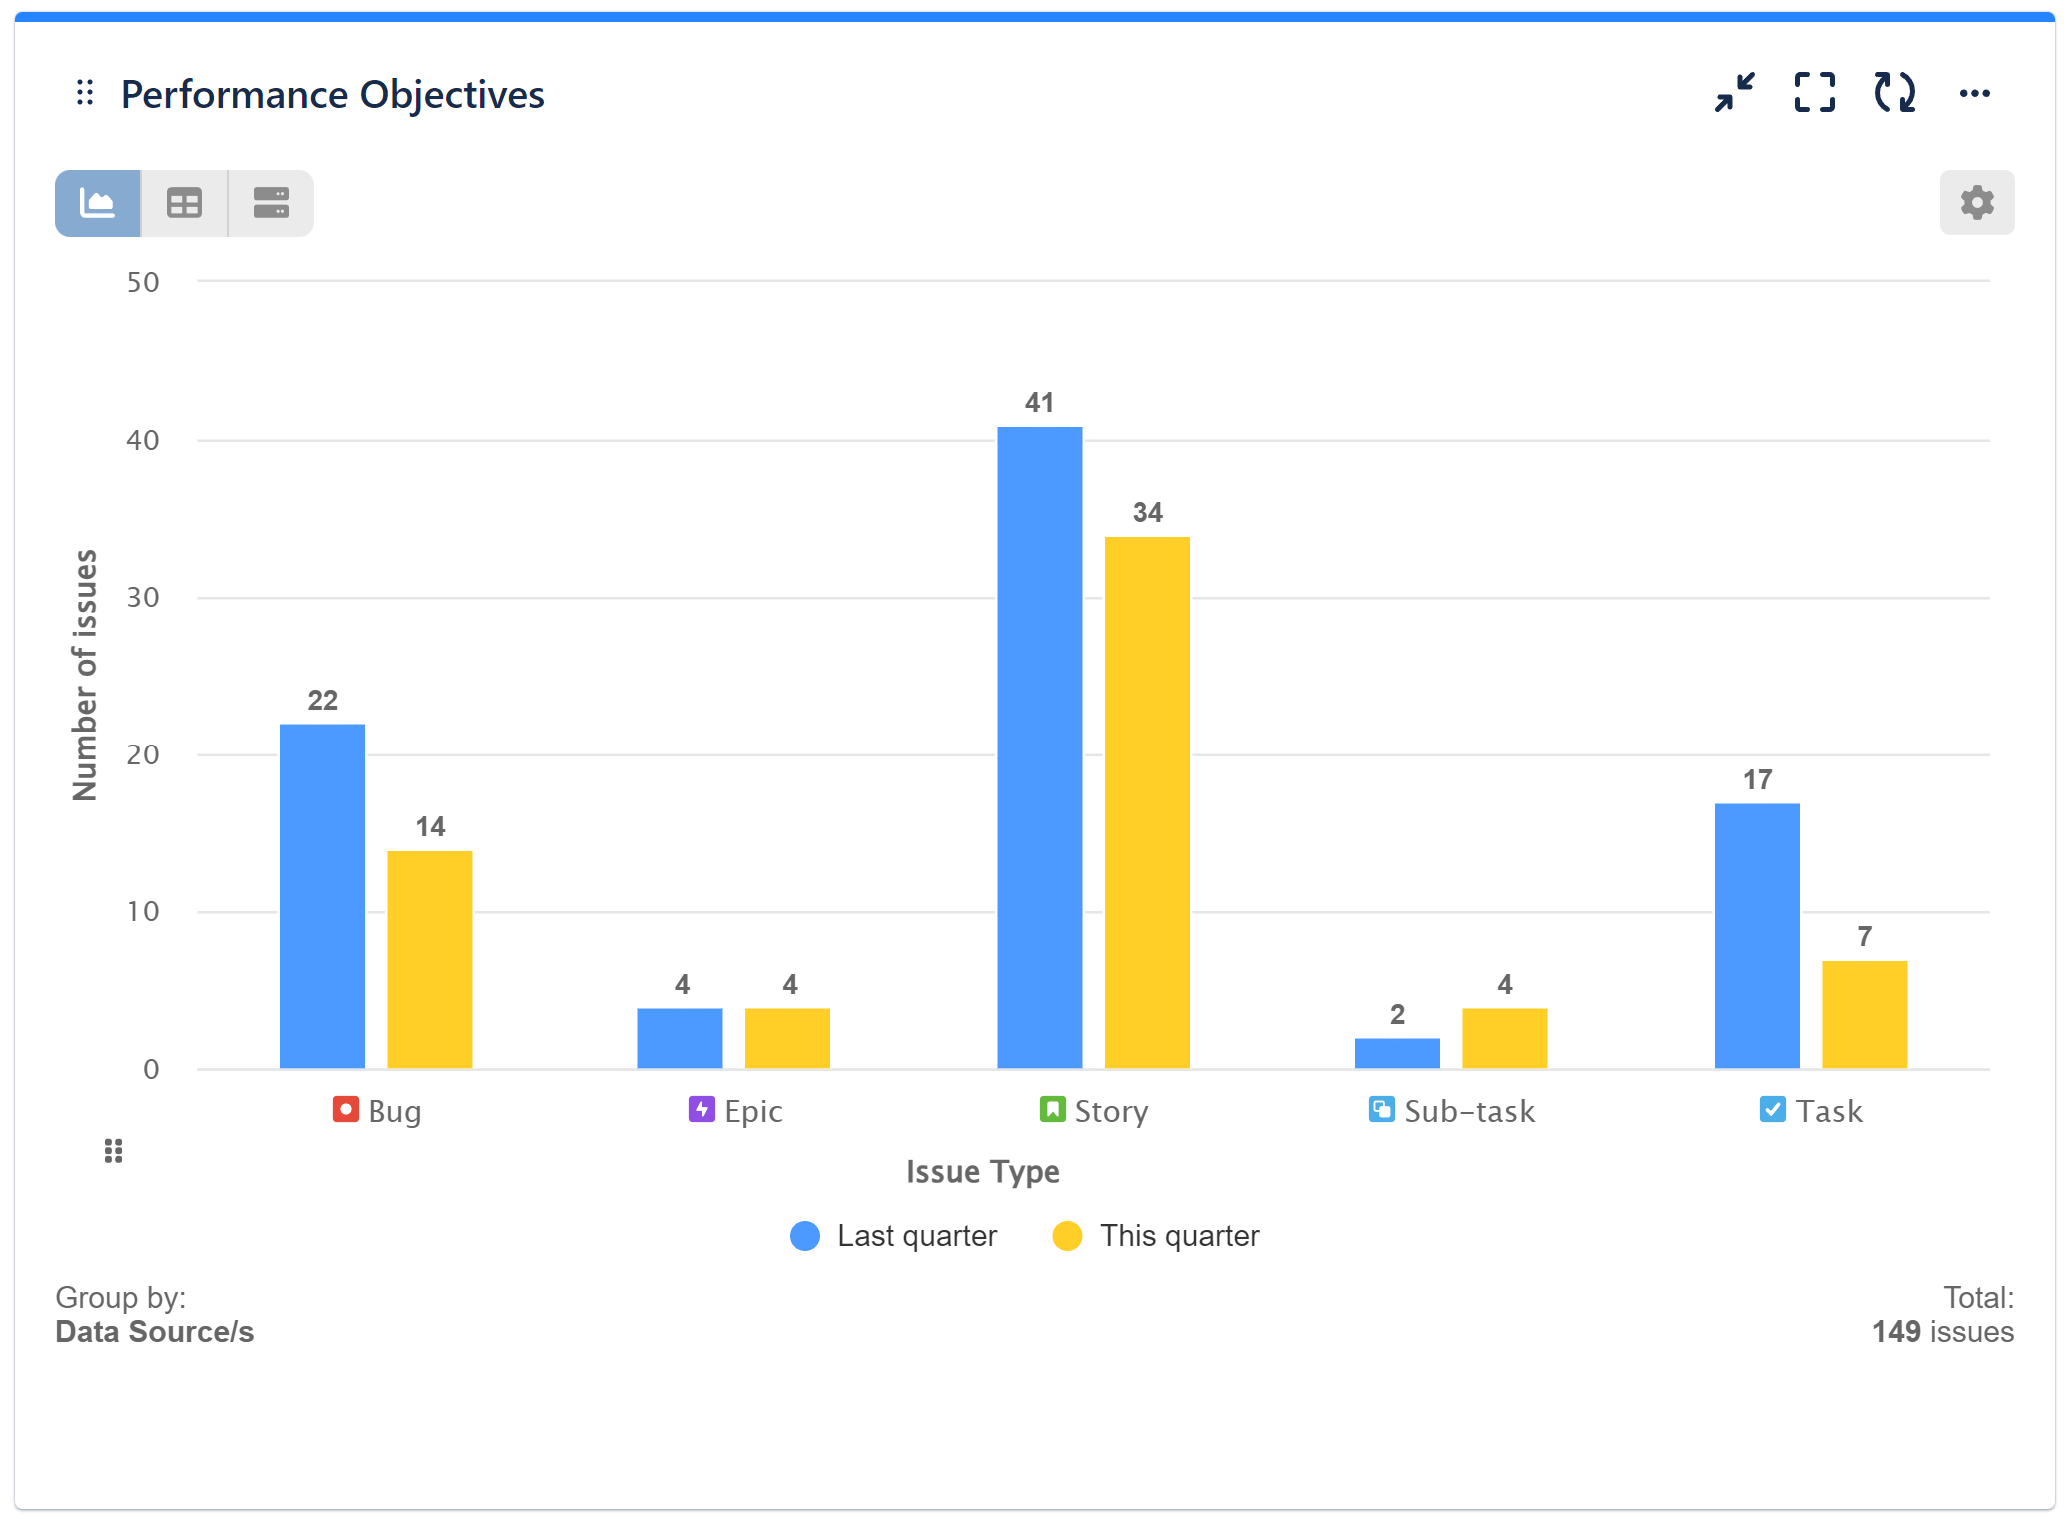
‘Data Source’ segments used for ‘Display by’
Preview of the configuration image showcasing the display settings based on the ‘Data Source’ segments. This configuration enables a comprehensive comparison of issue type groups between two distinct time periods.
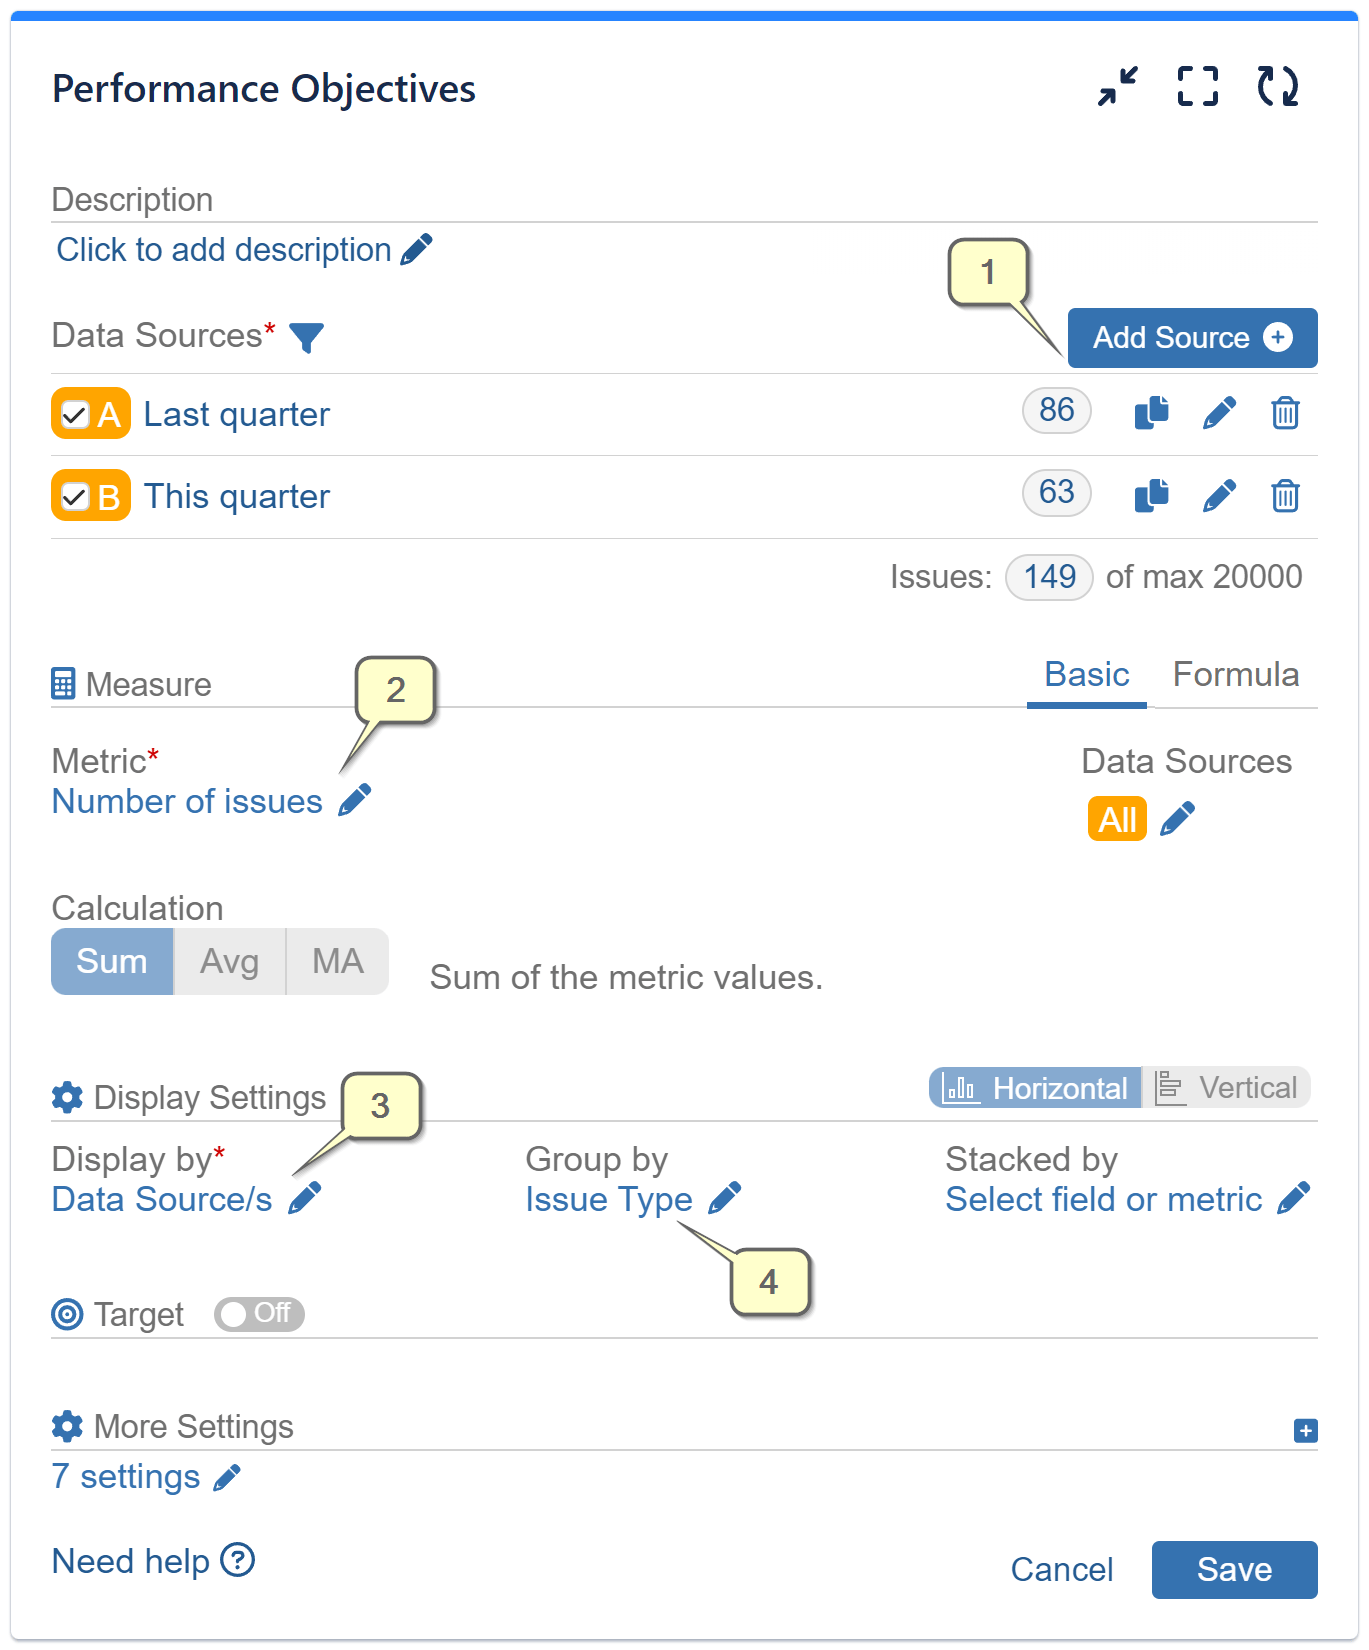
Step-by-step configuration guide:
Step 1: Add two Data Sources that cover different time periods but align with the same data segmentation criteria.
Step 2: Opt for the default metric ‘Number of issues’
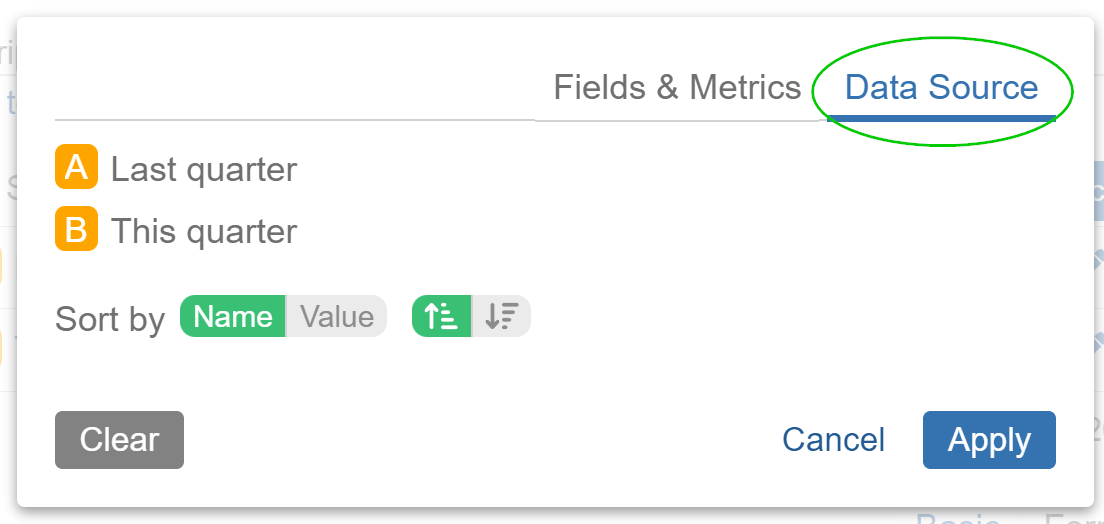
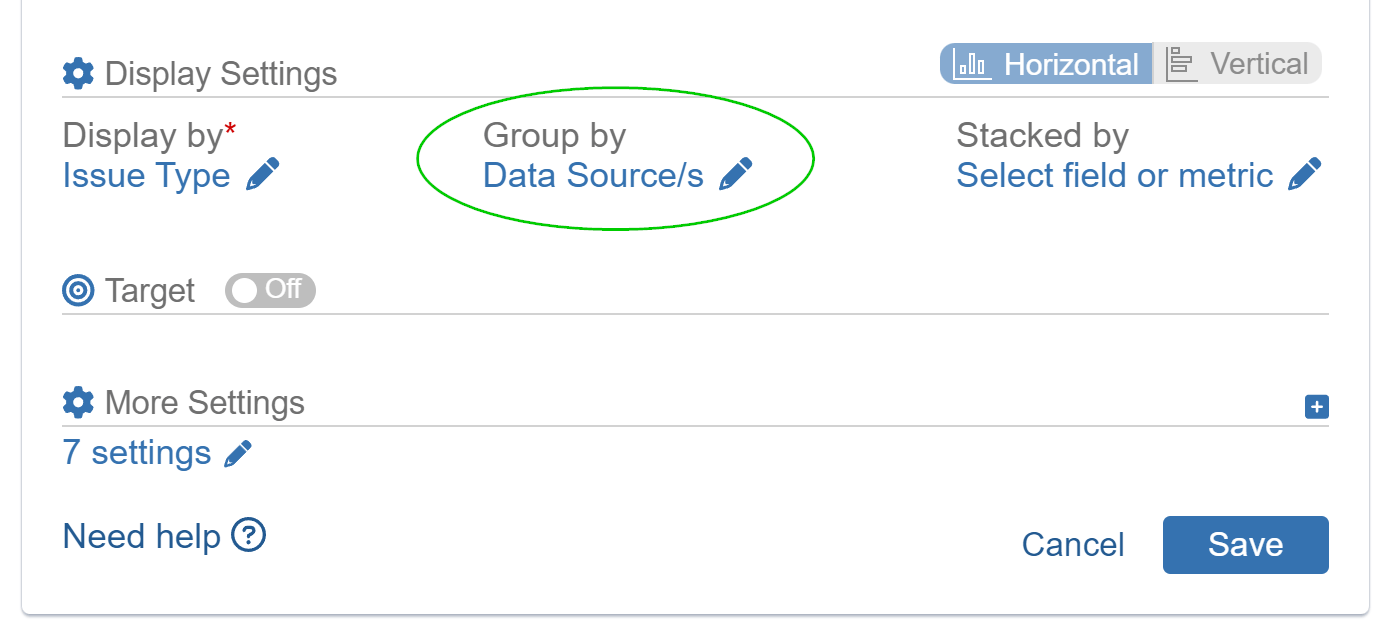
Step 3: Rather than selecting a field, opt for “Data Source/s” to view and analyze the data according to the different sources you’ve integrated.
Step 4: Select the “Issue type” field for the Group by option.
‘Data Source’ segments used for ‘Group by’
Preview of the configuration image showcasing the ‘Group by’ setting based on the ‘Data Source’ segments. This configuration facilitates a side-by-side comparison of specific issue type numbers between two distinct periods.
To set up this configuration, follow the steps outlined in the previous instructions but with a slight adjustment. When selecting the “Display by” option, choose the “Issue type” field. Then, for the “Group by” option, select “Data Source/s”.
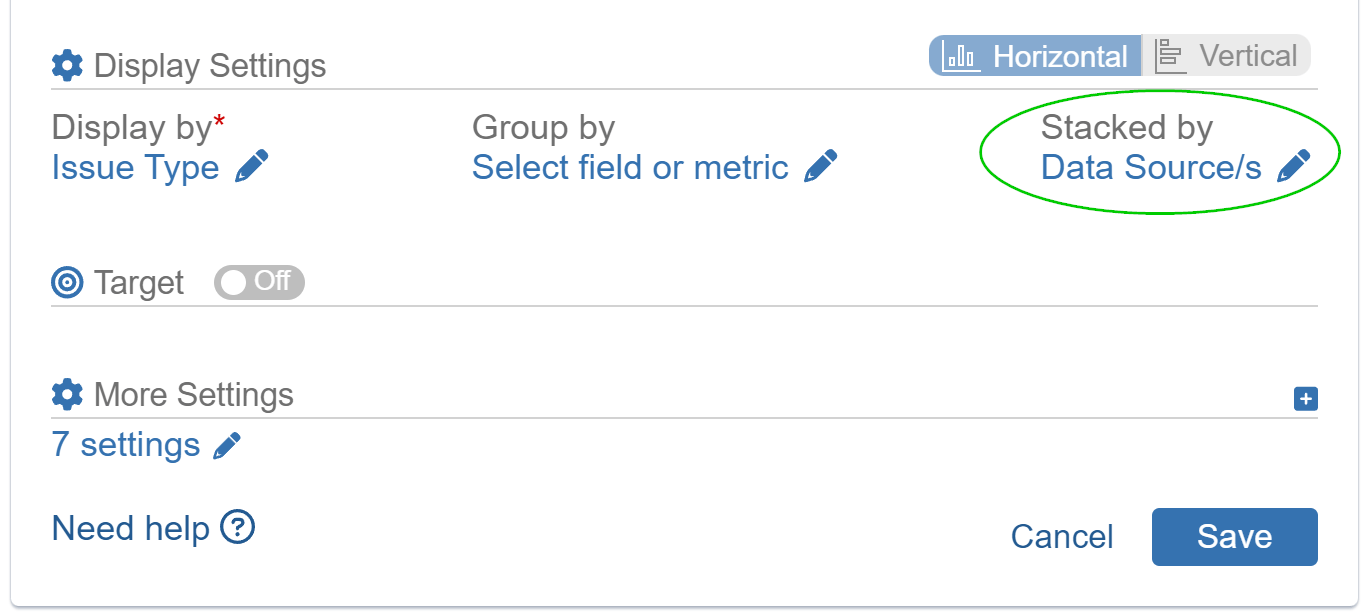
‘Data Source’ segments used for ‘Stacked by’
Preview of the configuration image with ‘Stacked by’ setting based on the ‘Data Source’ segments. This configuration allows for a stacked representation of data, showcasing the contribution of each Data Source segment.
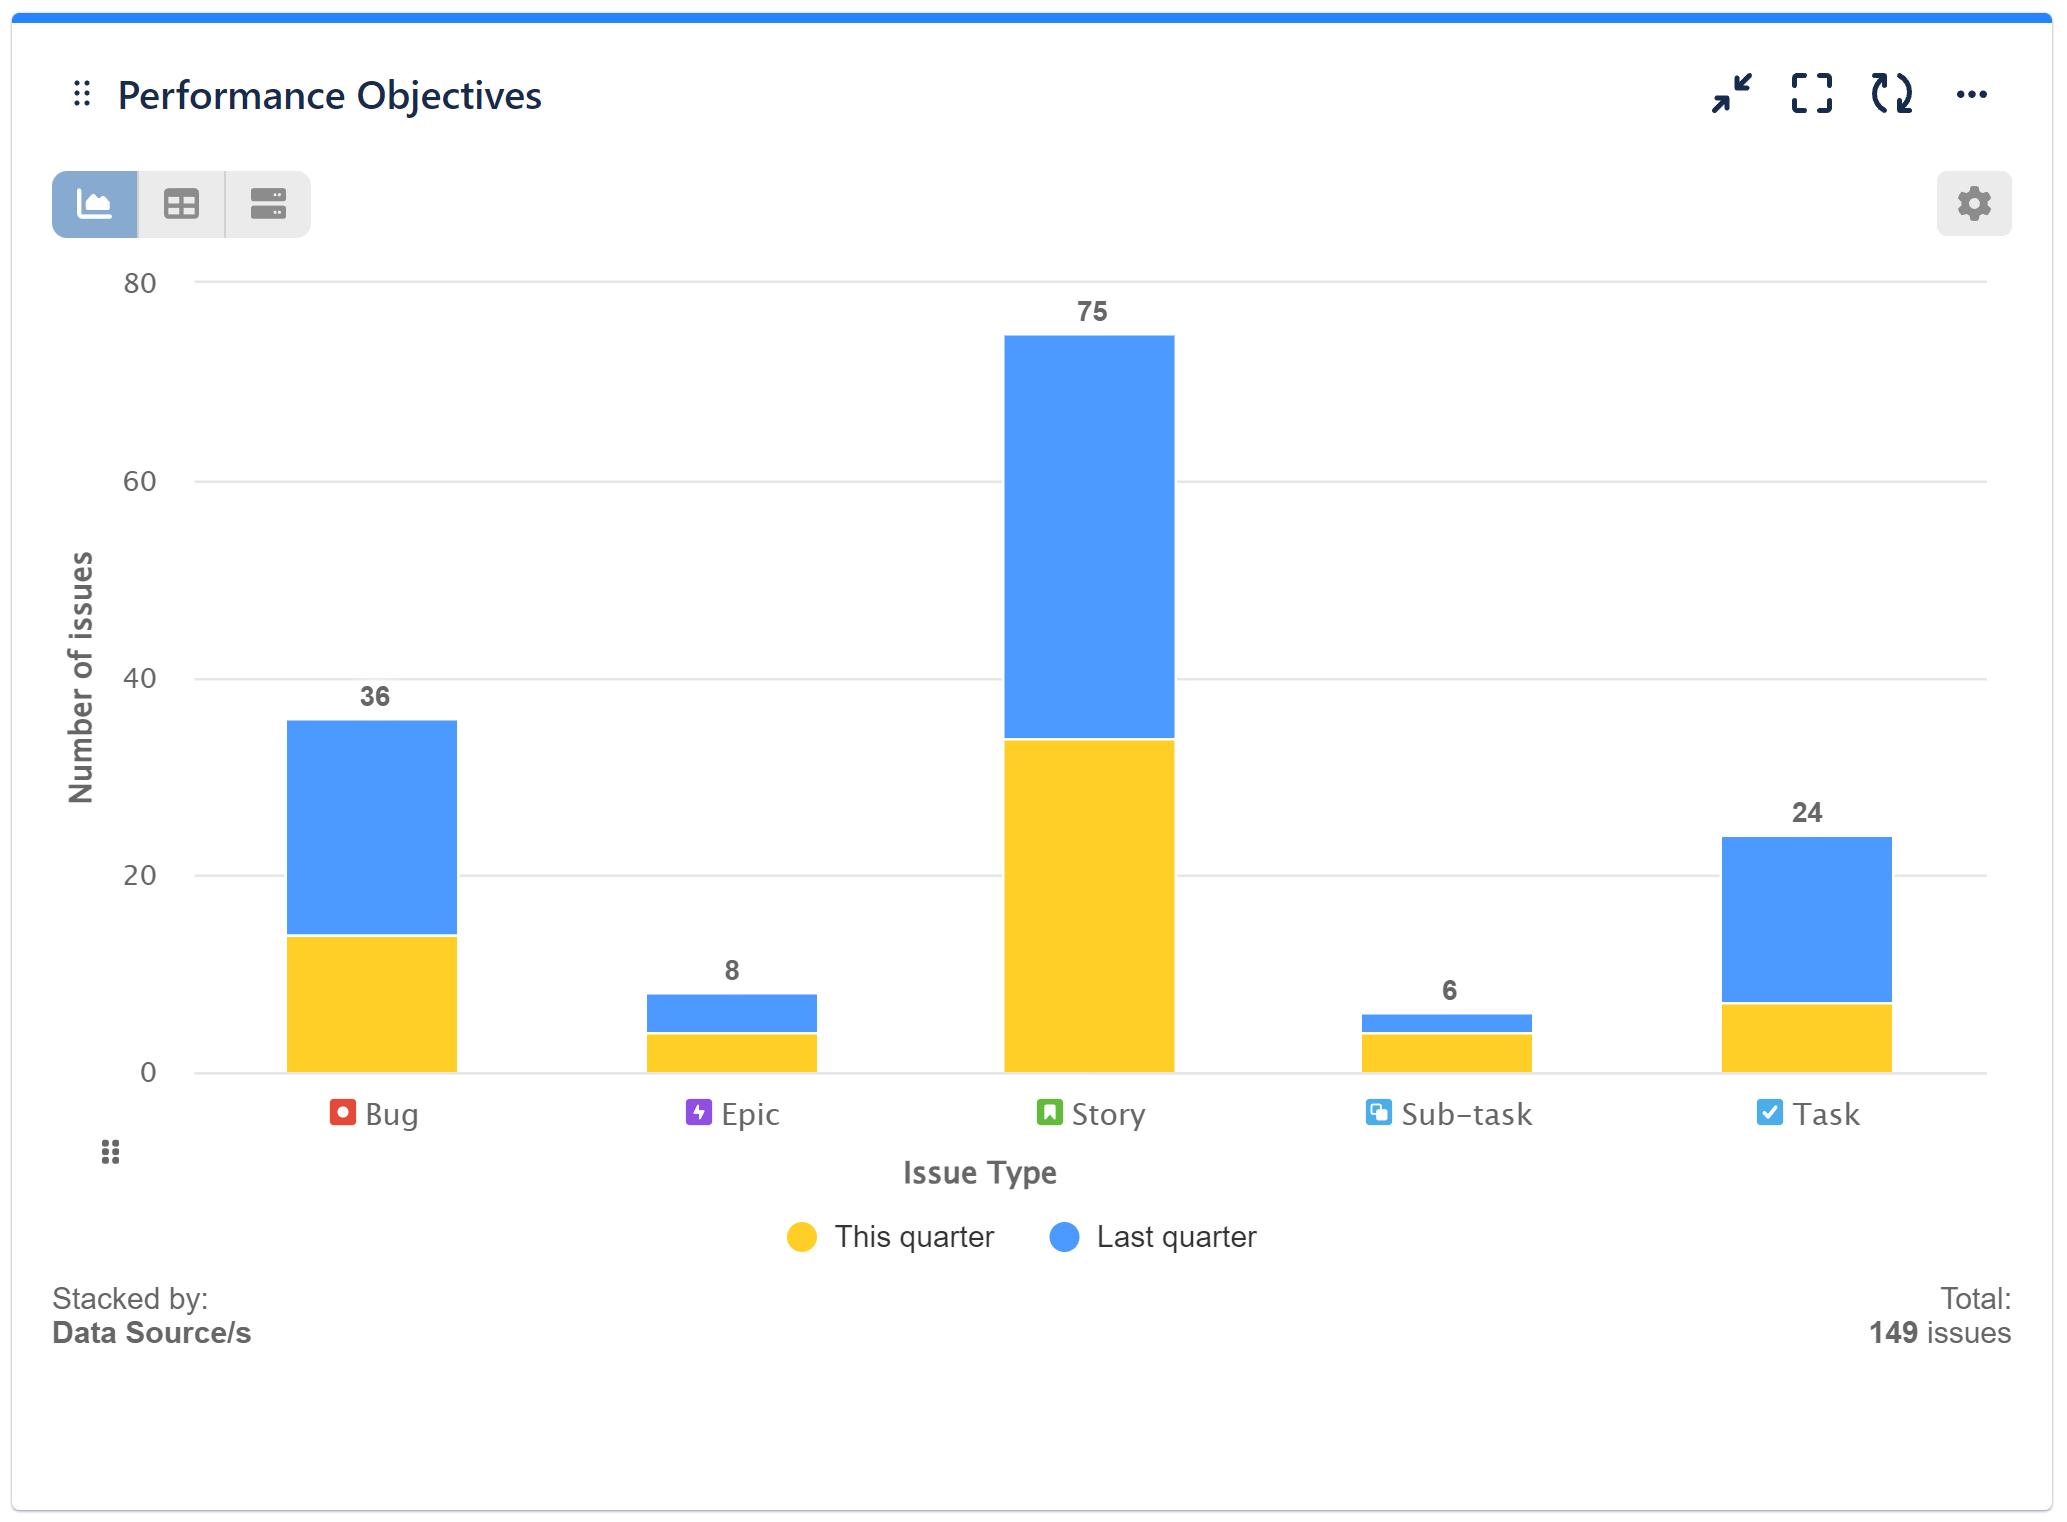
To configure this setup, follow the steps provided in the initial instructions, but with a modification: when you reach the Stack by option, choose Data Source/s.
The video below demonstrates how easily you can switch between data dimension view options, leveraging the app’s multiple data source and data segmentation capabilities.
For further information and deeper insights into the various configuration options available, we recommend exploring our related articles: Stacked Mode, Group By, Display Settings: Vertical Orientation.
Start your 30 days free trial of Performance Objectives: Charts for Jira from Atlassian Marketplace.