Performance Objectives: Charts for Jira offers three calculation types for metrics, providing unmatching flexibility for your Jira charts and reports. In this article, we will explore the Average metric calculation method, which can be derived from current data or other metrics and data segments, including past time periods. This calculation enables you to either compute average metrics results or establish specific and individual performance targets that align with the average team performance.
Comparing Sum vs. Average Calculation Methods
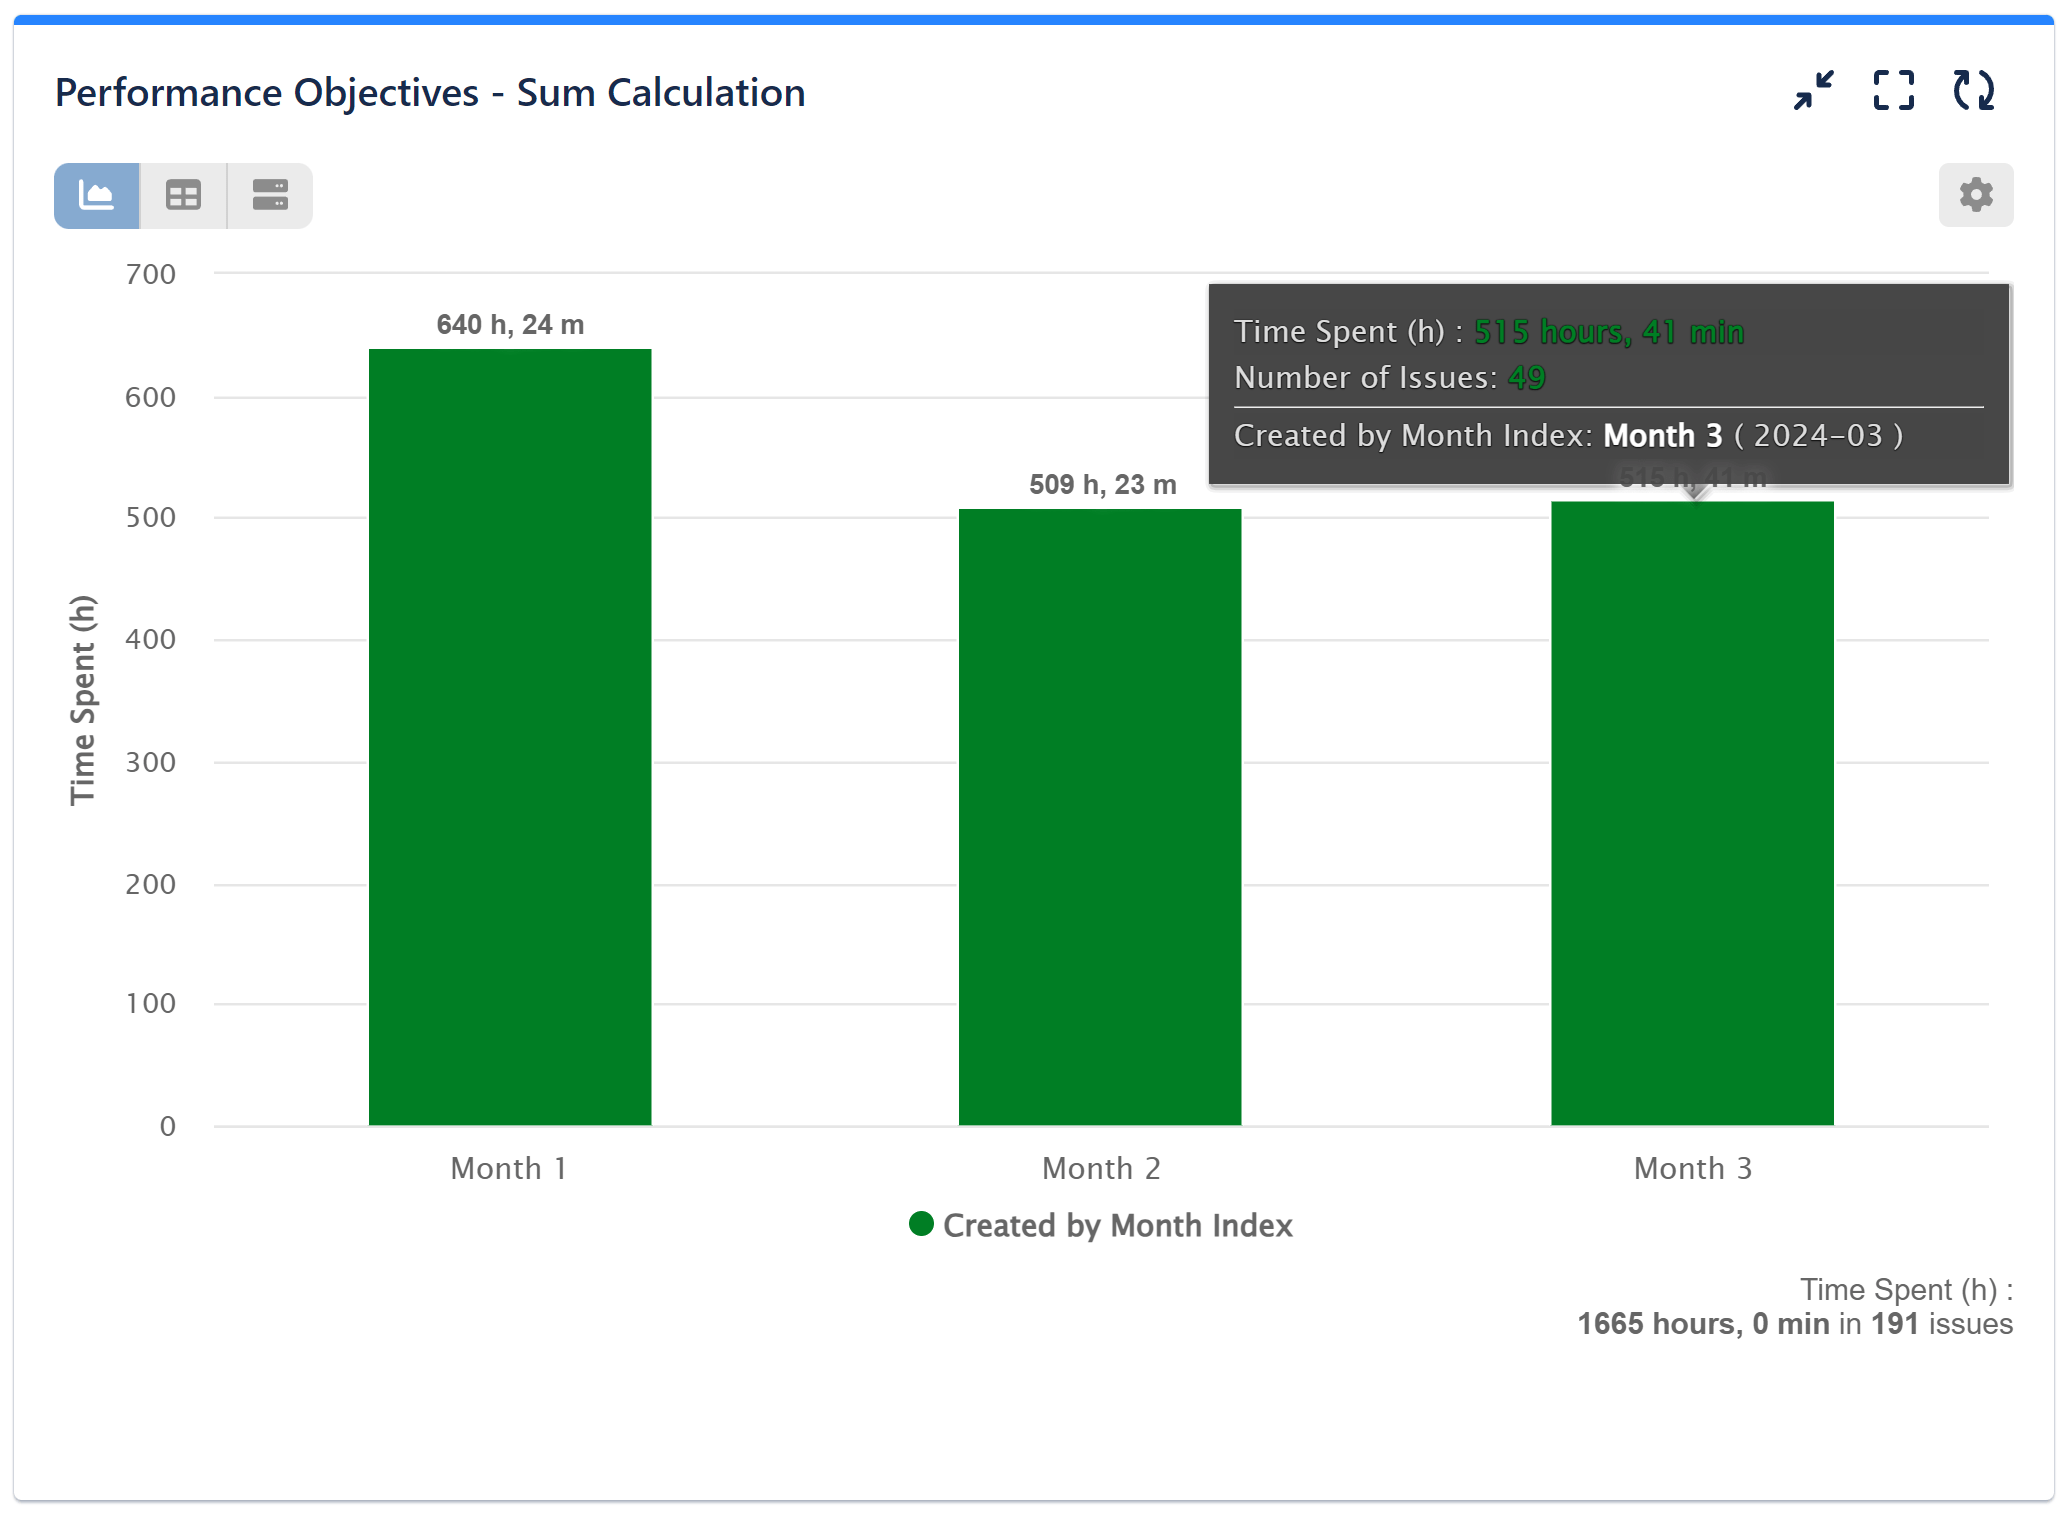
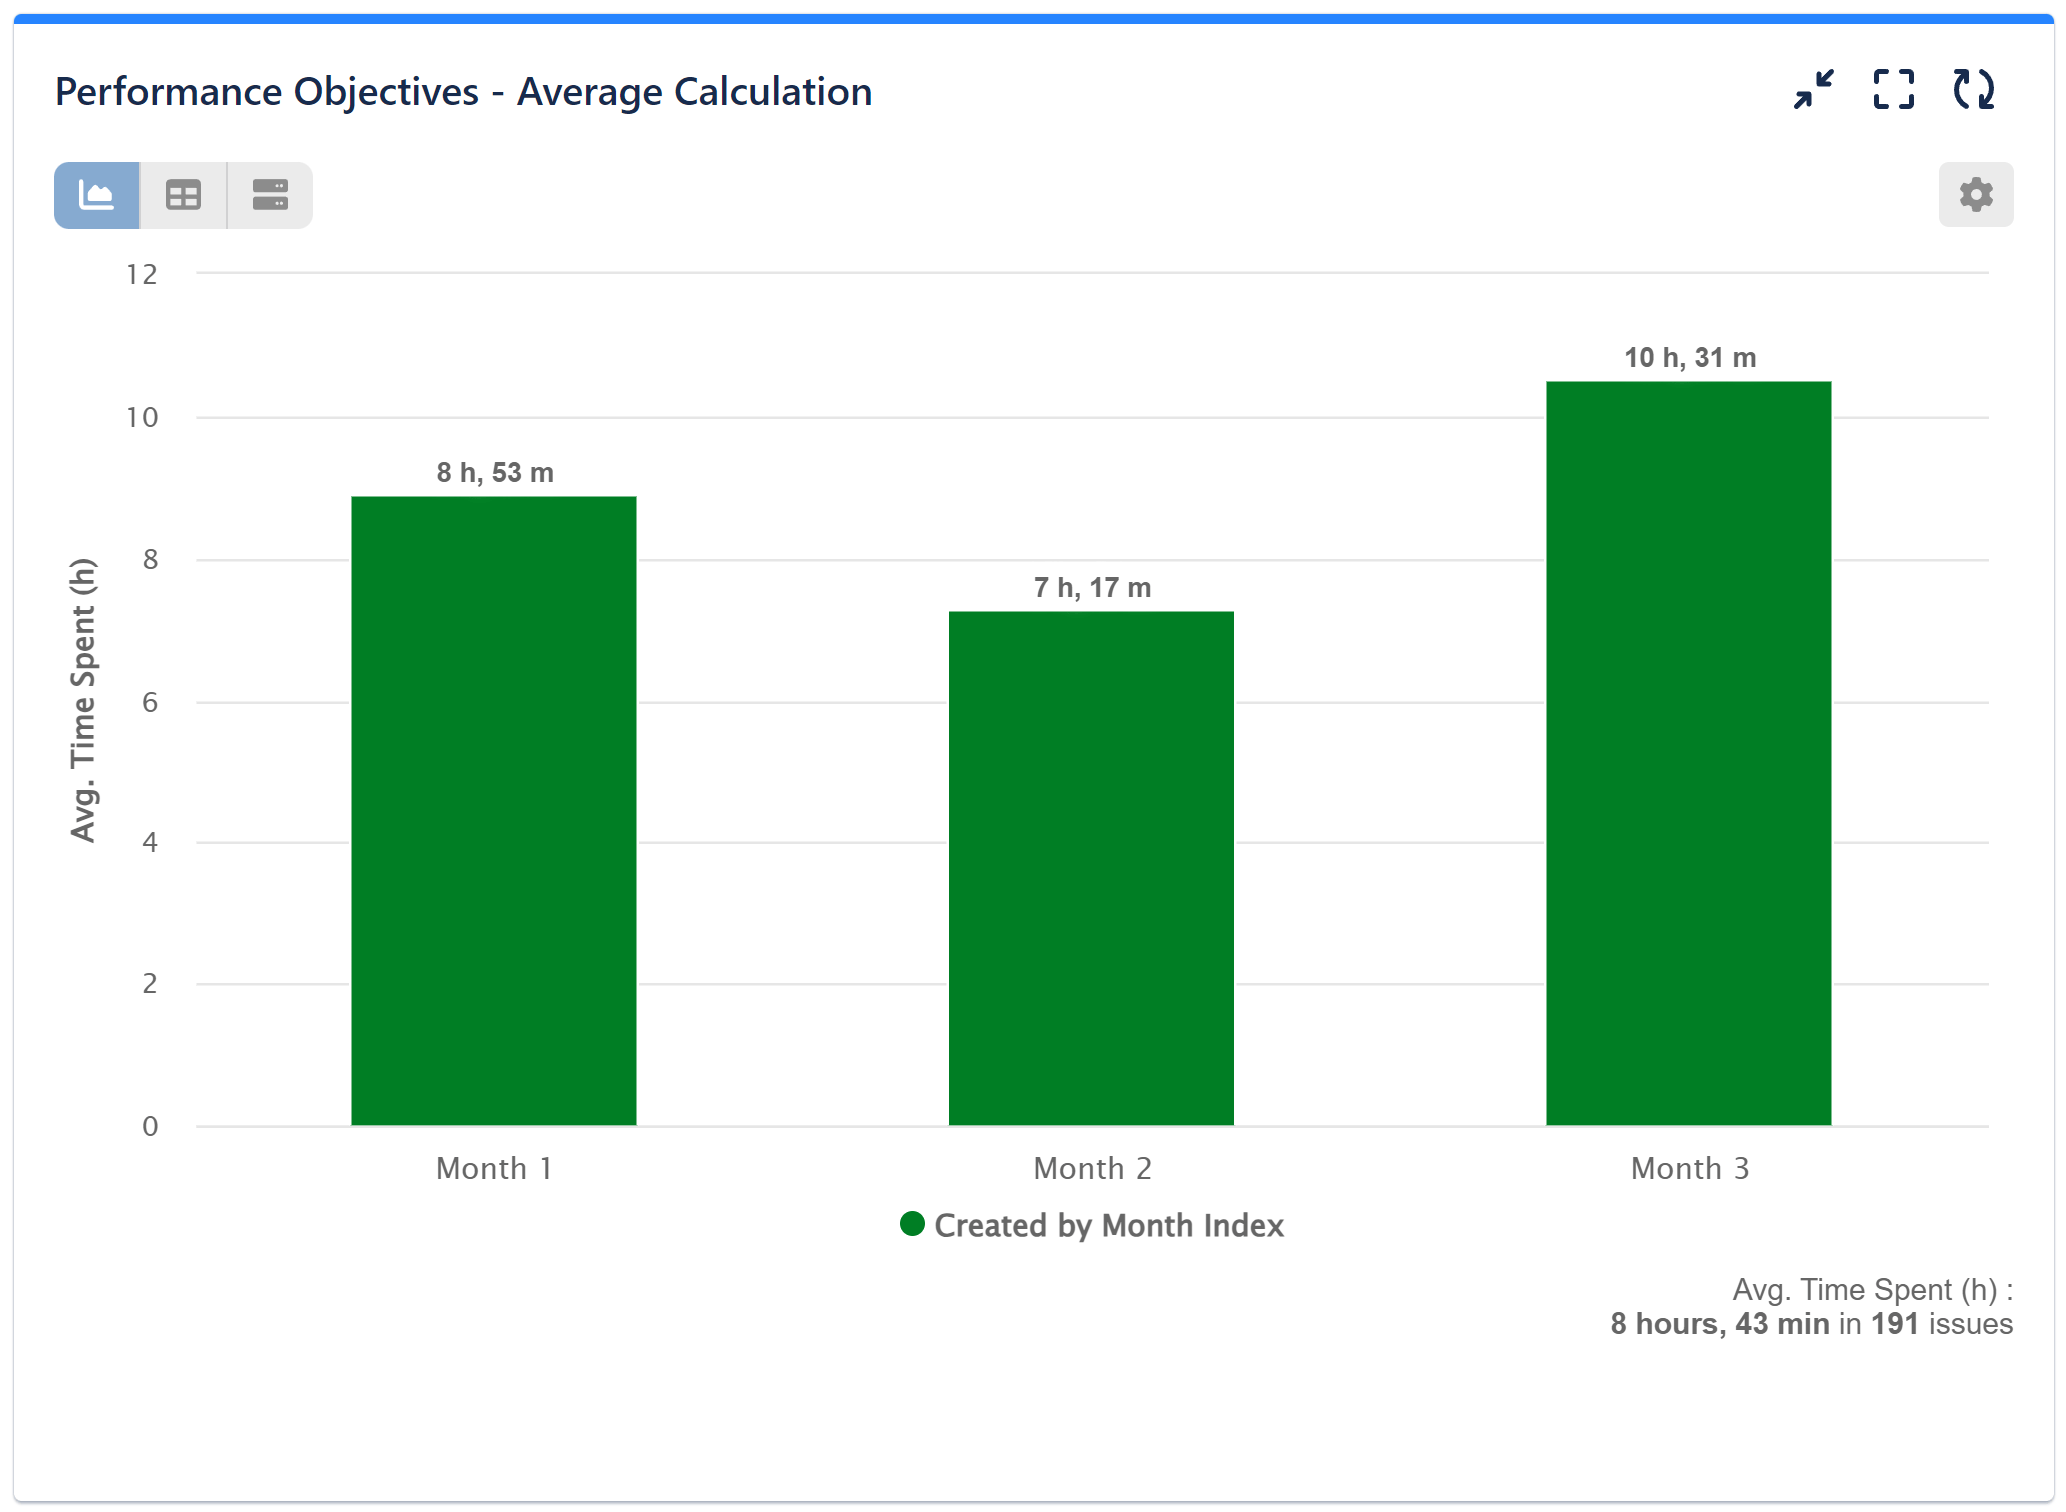
By default, the calculation method is set to ‘Sum.’ However, let’s explore the data visualization differences when we opt for ‘Average‘ calculation in our charts instead of ‘Sum’:
Jira KPI Scenario: Utilization
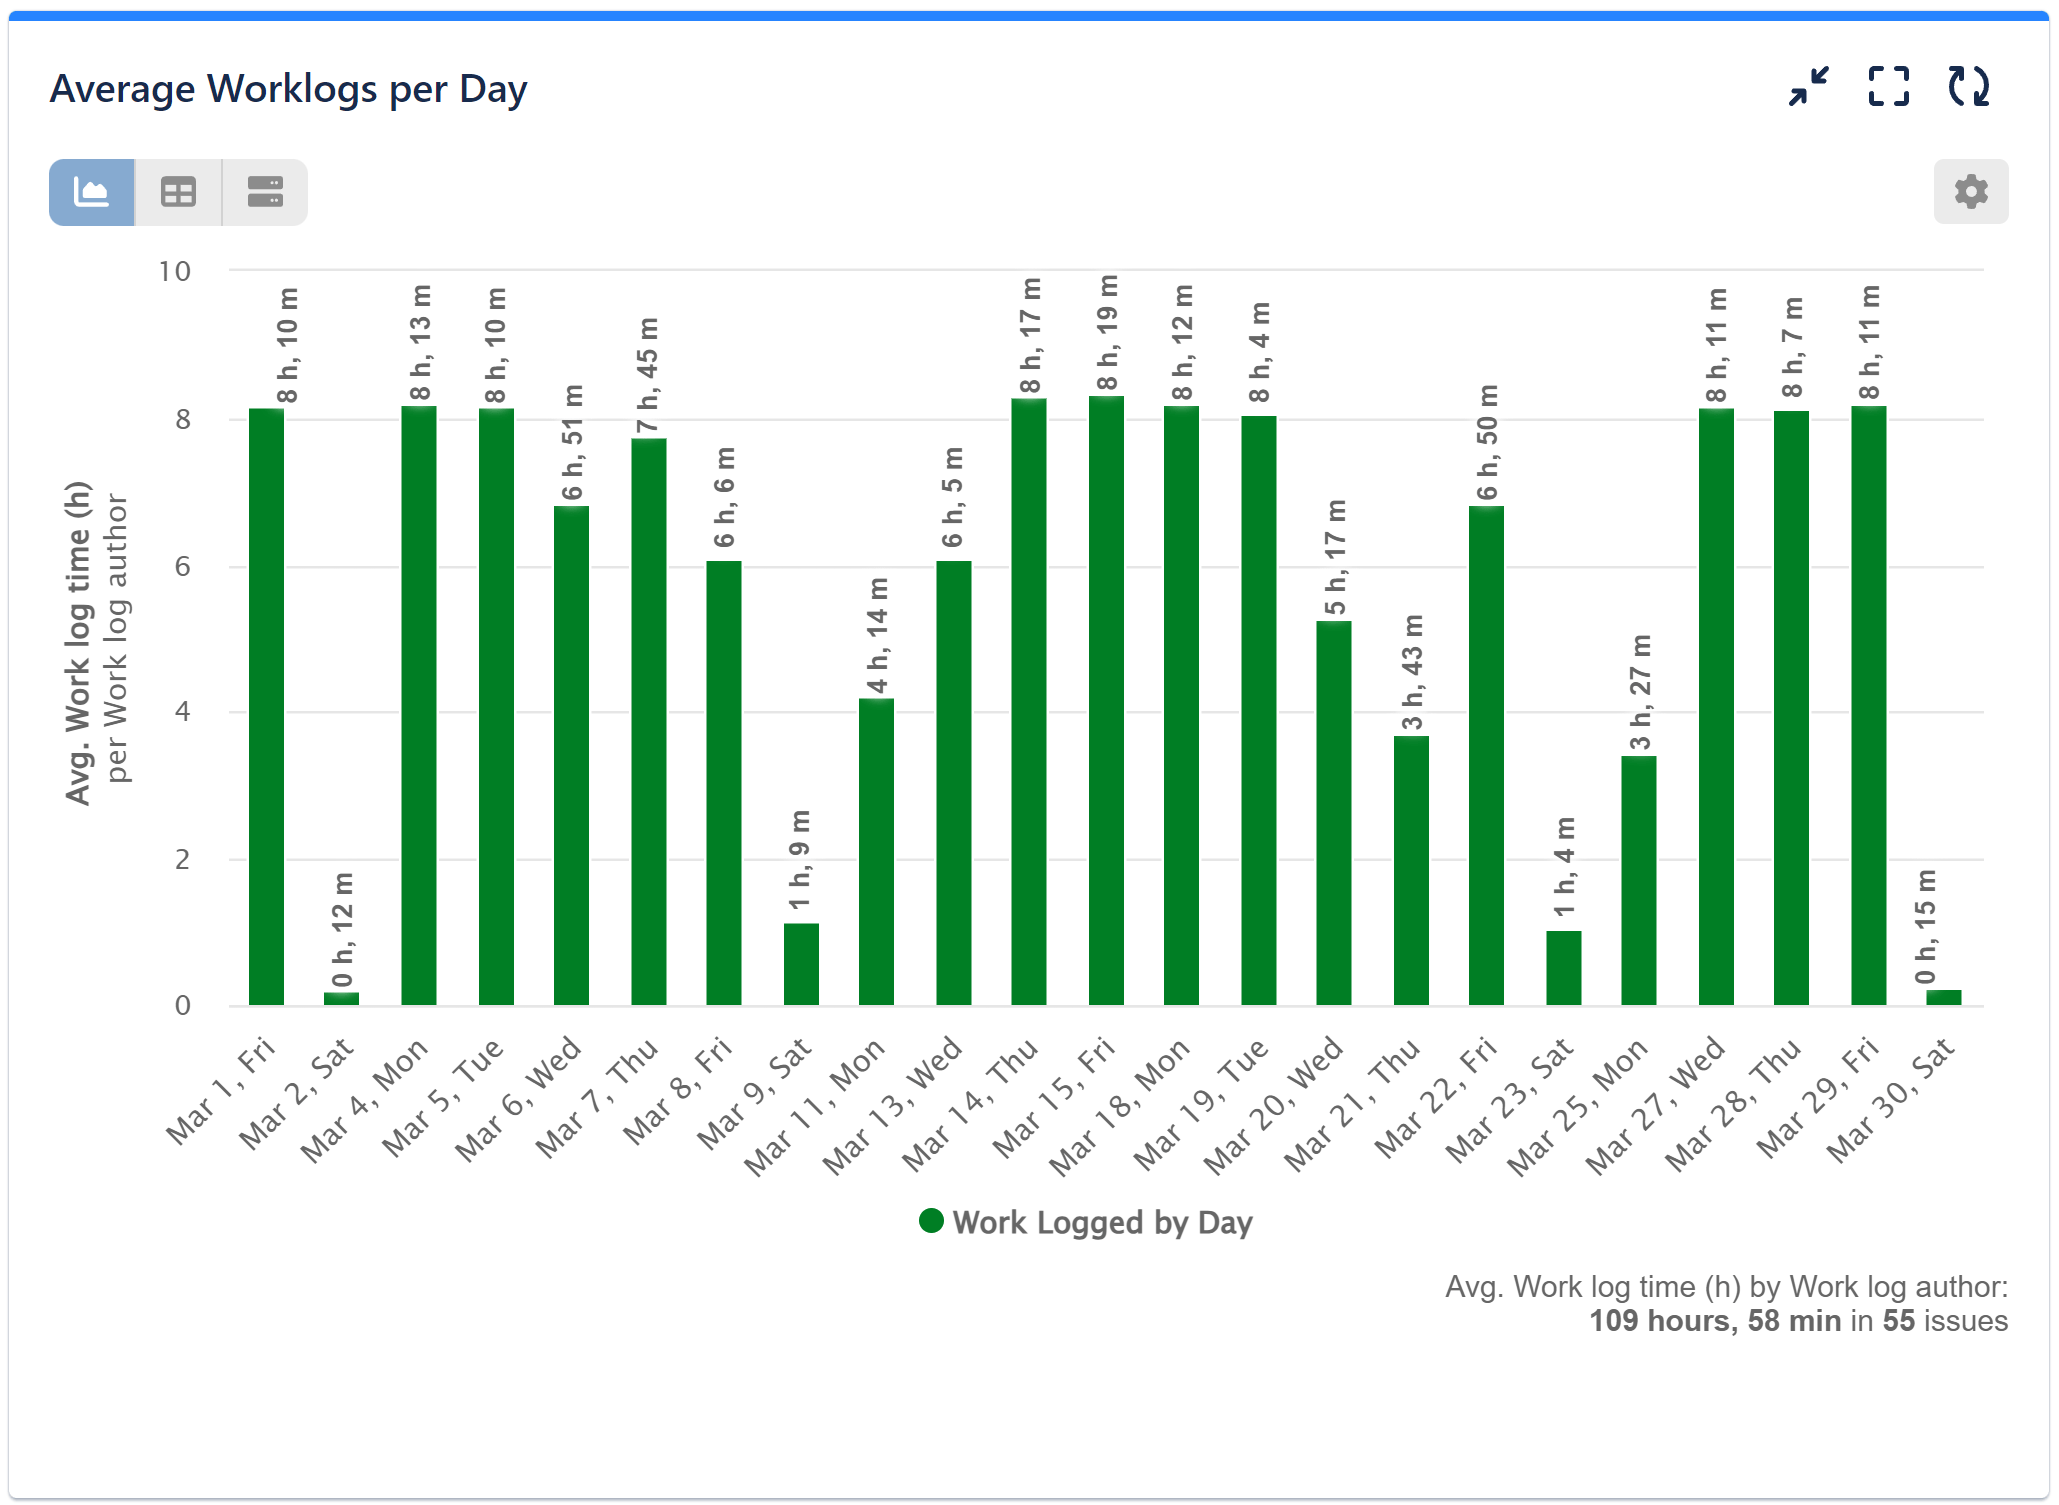
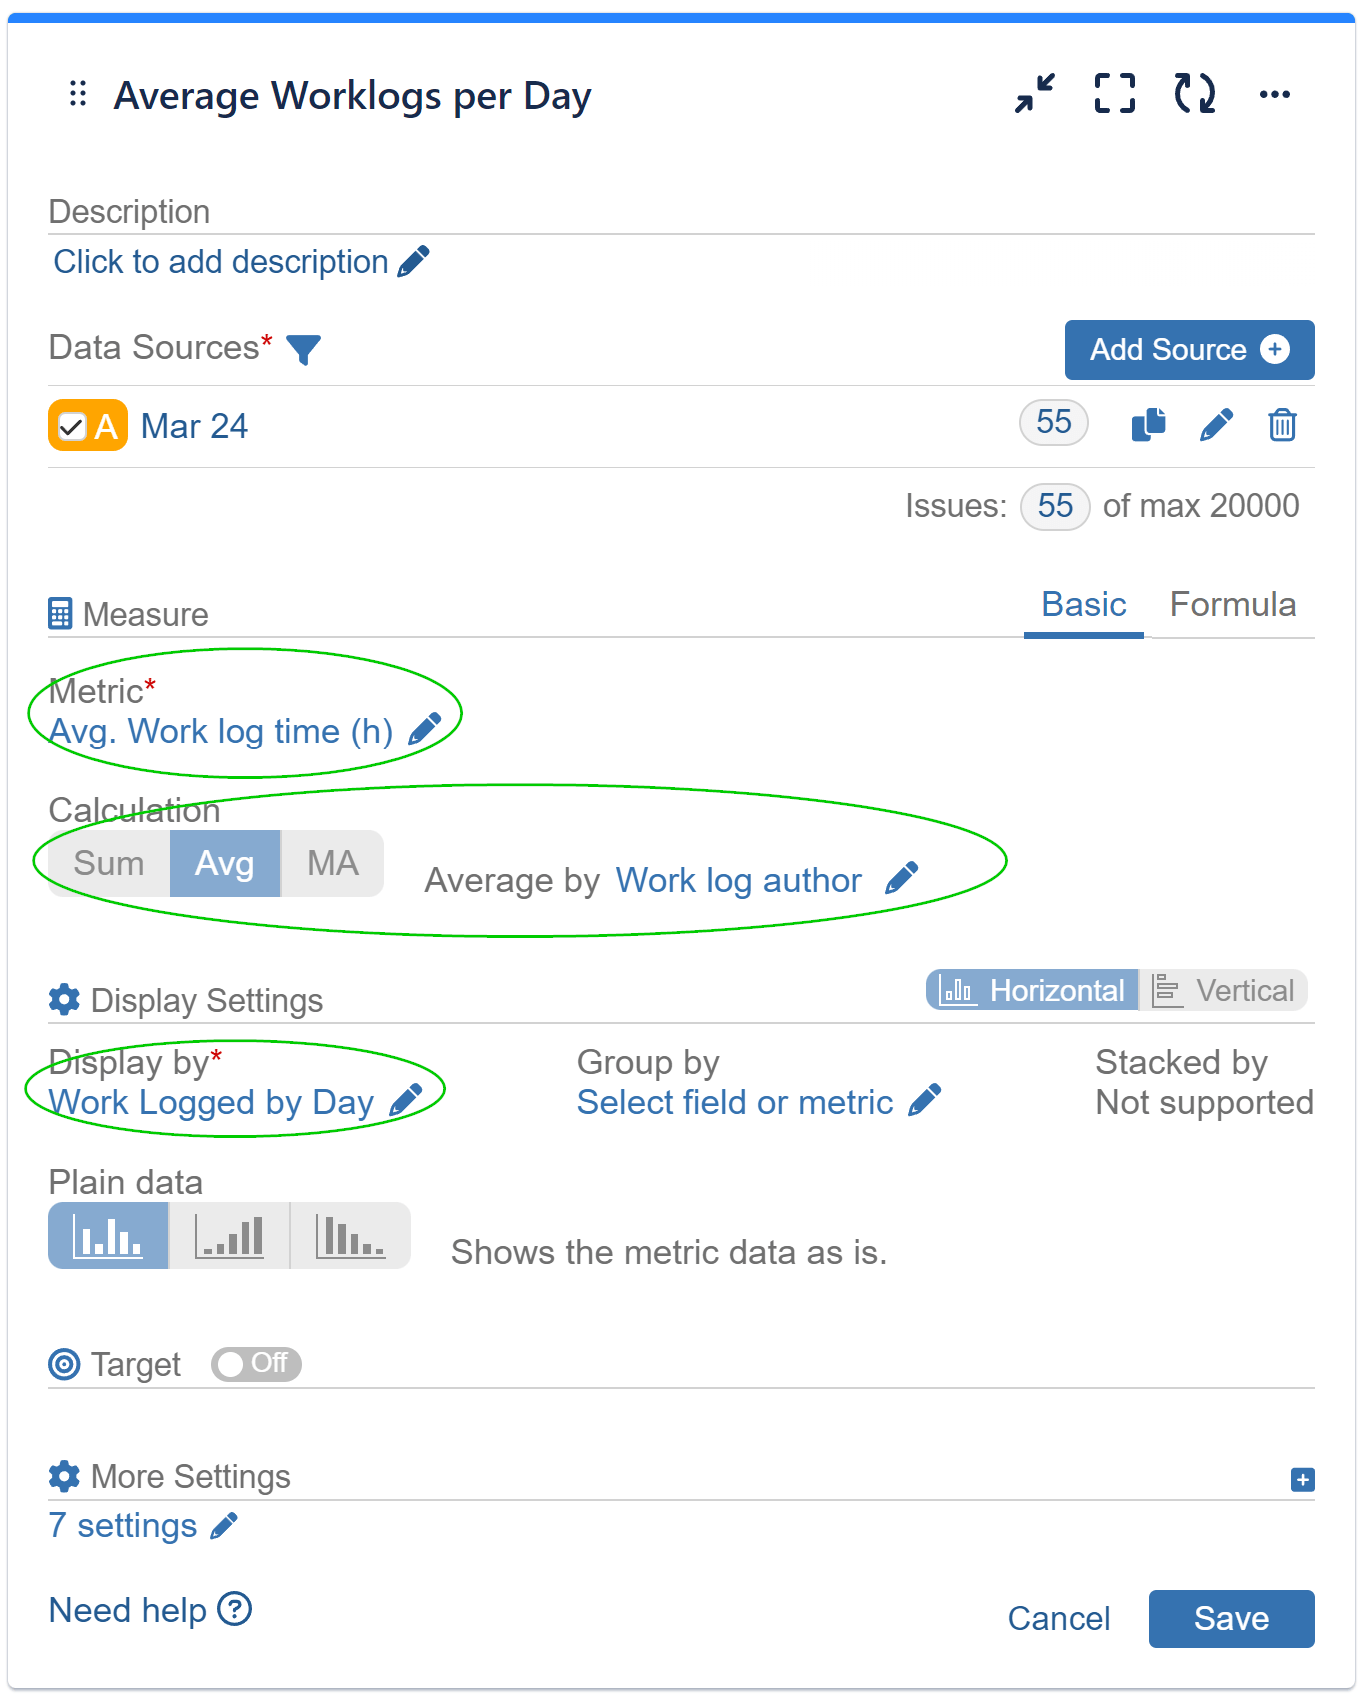
Gain insights into team utilization patterns throughout the week with “Average Work Log Time per Day of Week per Work Log Author” report. By visualizing this data, you can: identify peak and low utilization days, spot trends and anomalies, optimize resource allocation, which provides a basis for better project and task planning.
Jira KPI Scenario: Issue Flow
Explore the issue flow within a defined time frame through the ‘Average number of issues per hour per day’ report, utilizing the ‘Data Source’ date range. This analysis provides a range of benefits, including pinpointing peak hours for issue creation and resolution, facilitating informed resource allocation decisions, enabling the establishment of realistic SLAs and response times using historical data, and predicting periods of high issue volume, allowing you to proactively manage resources and workflows to meet demand.
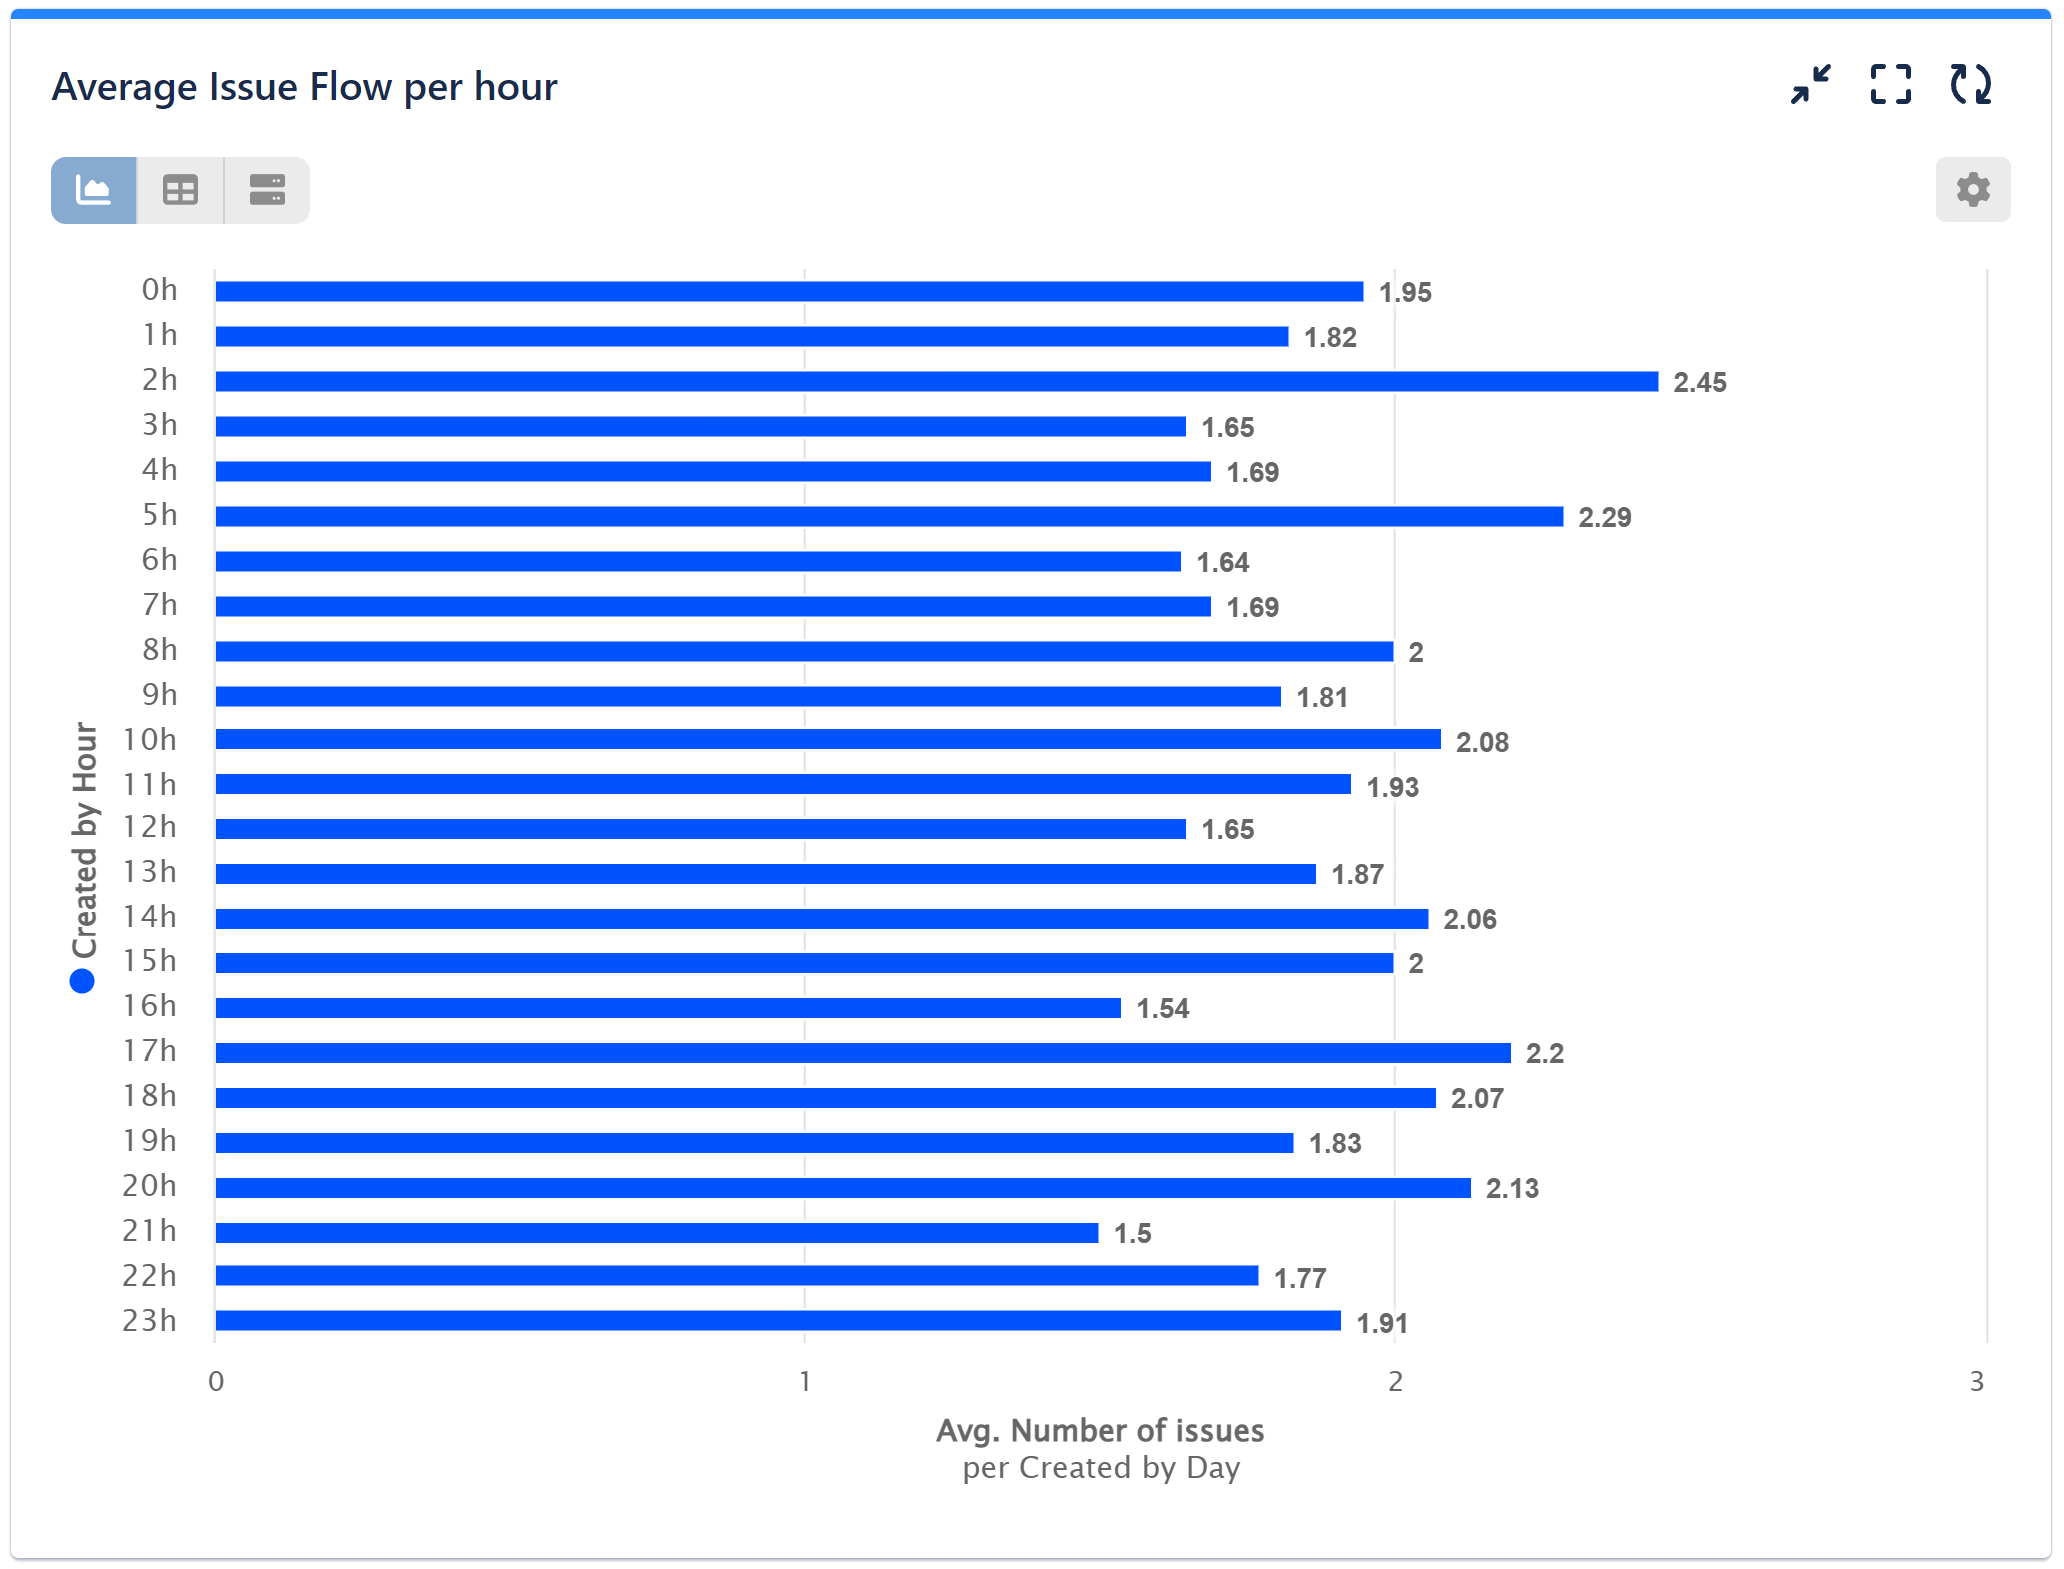
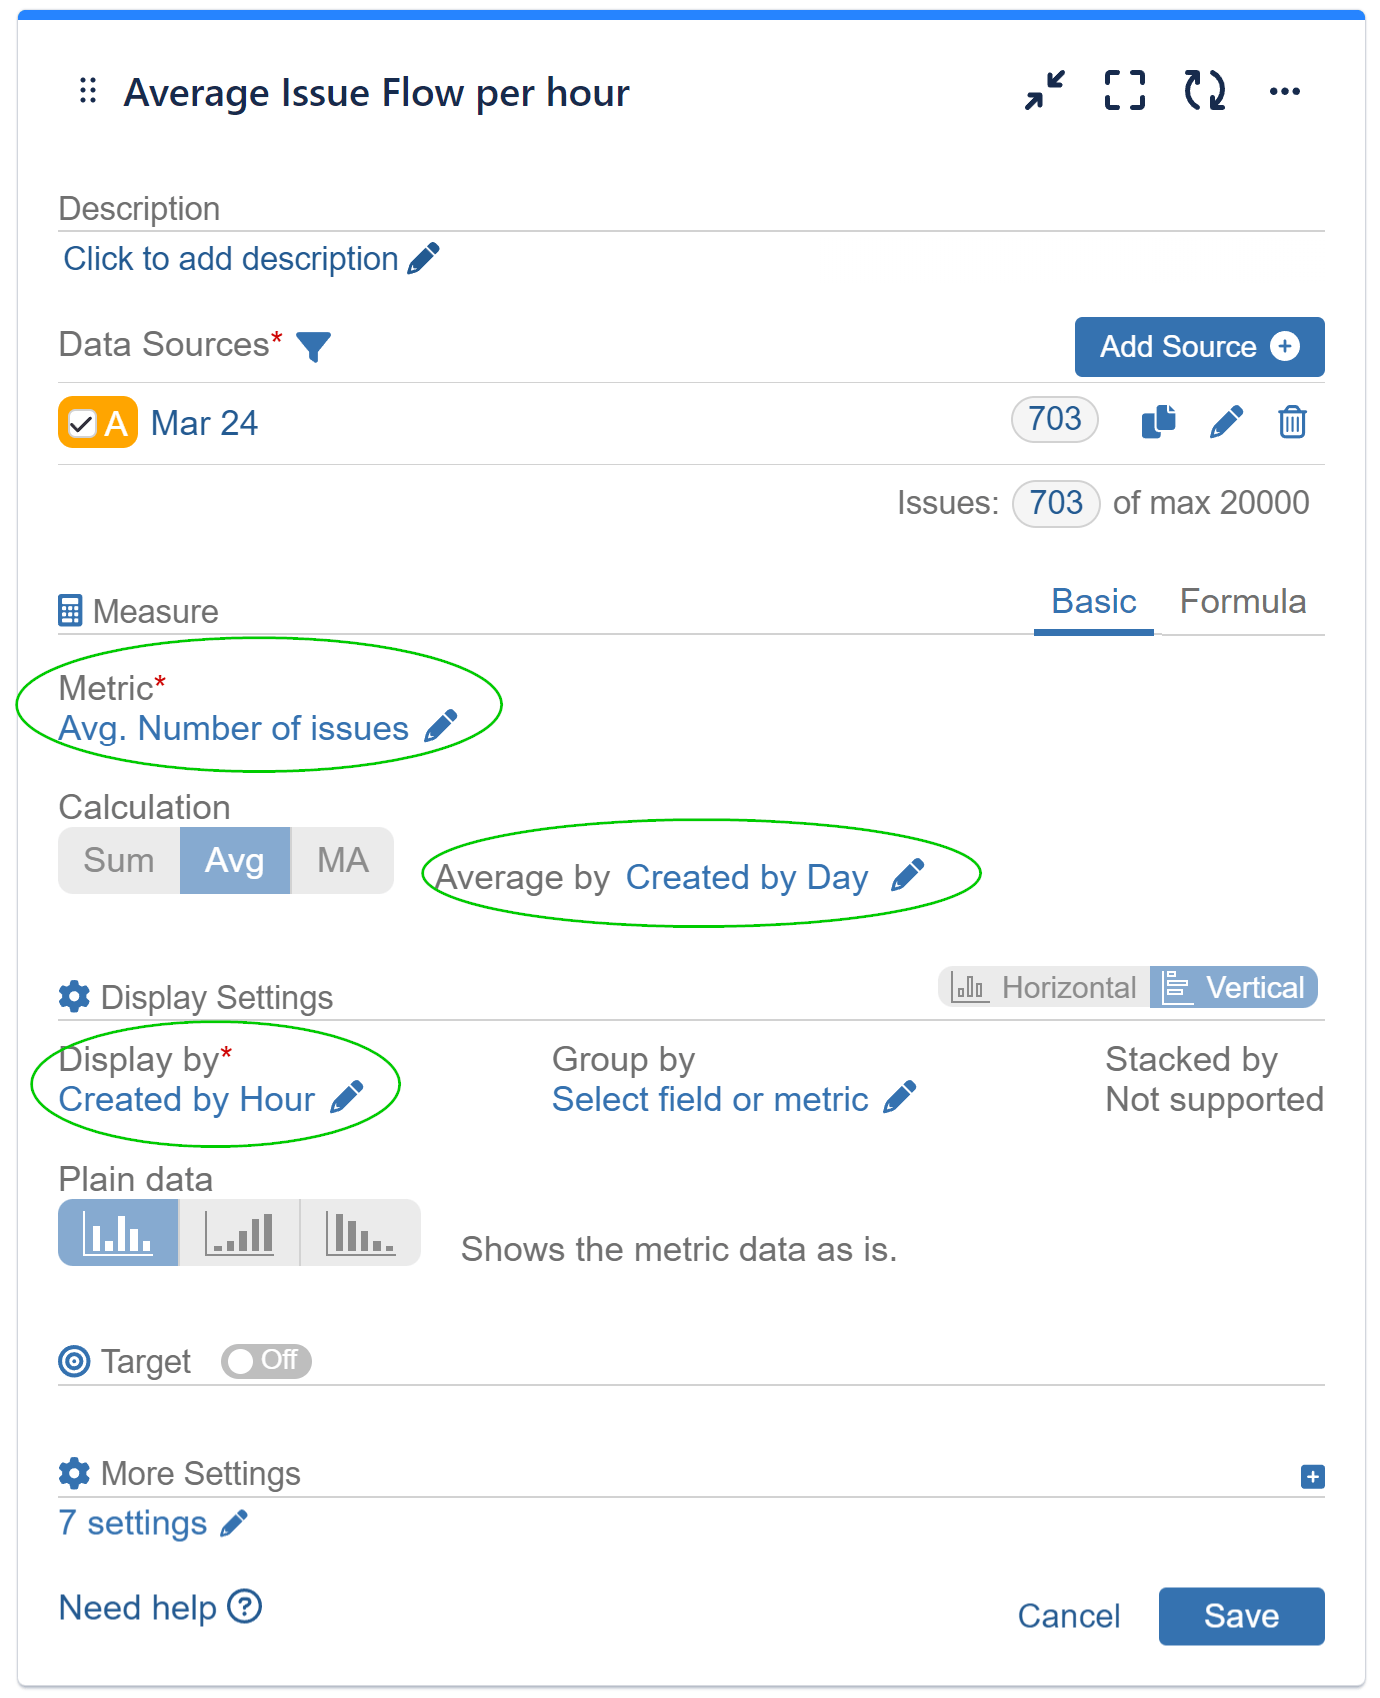
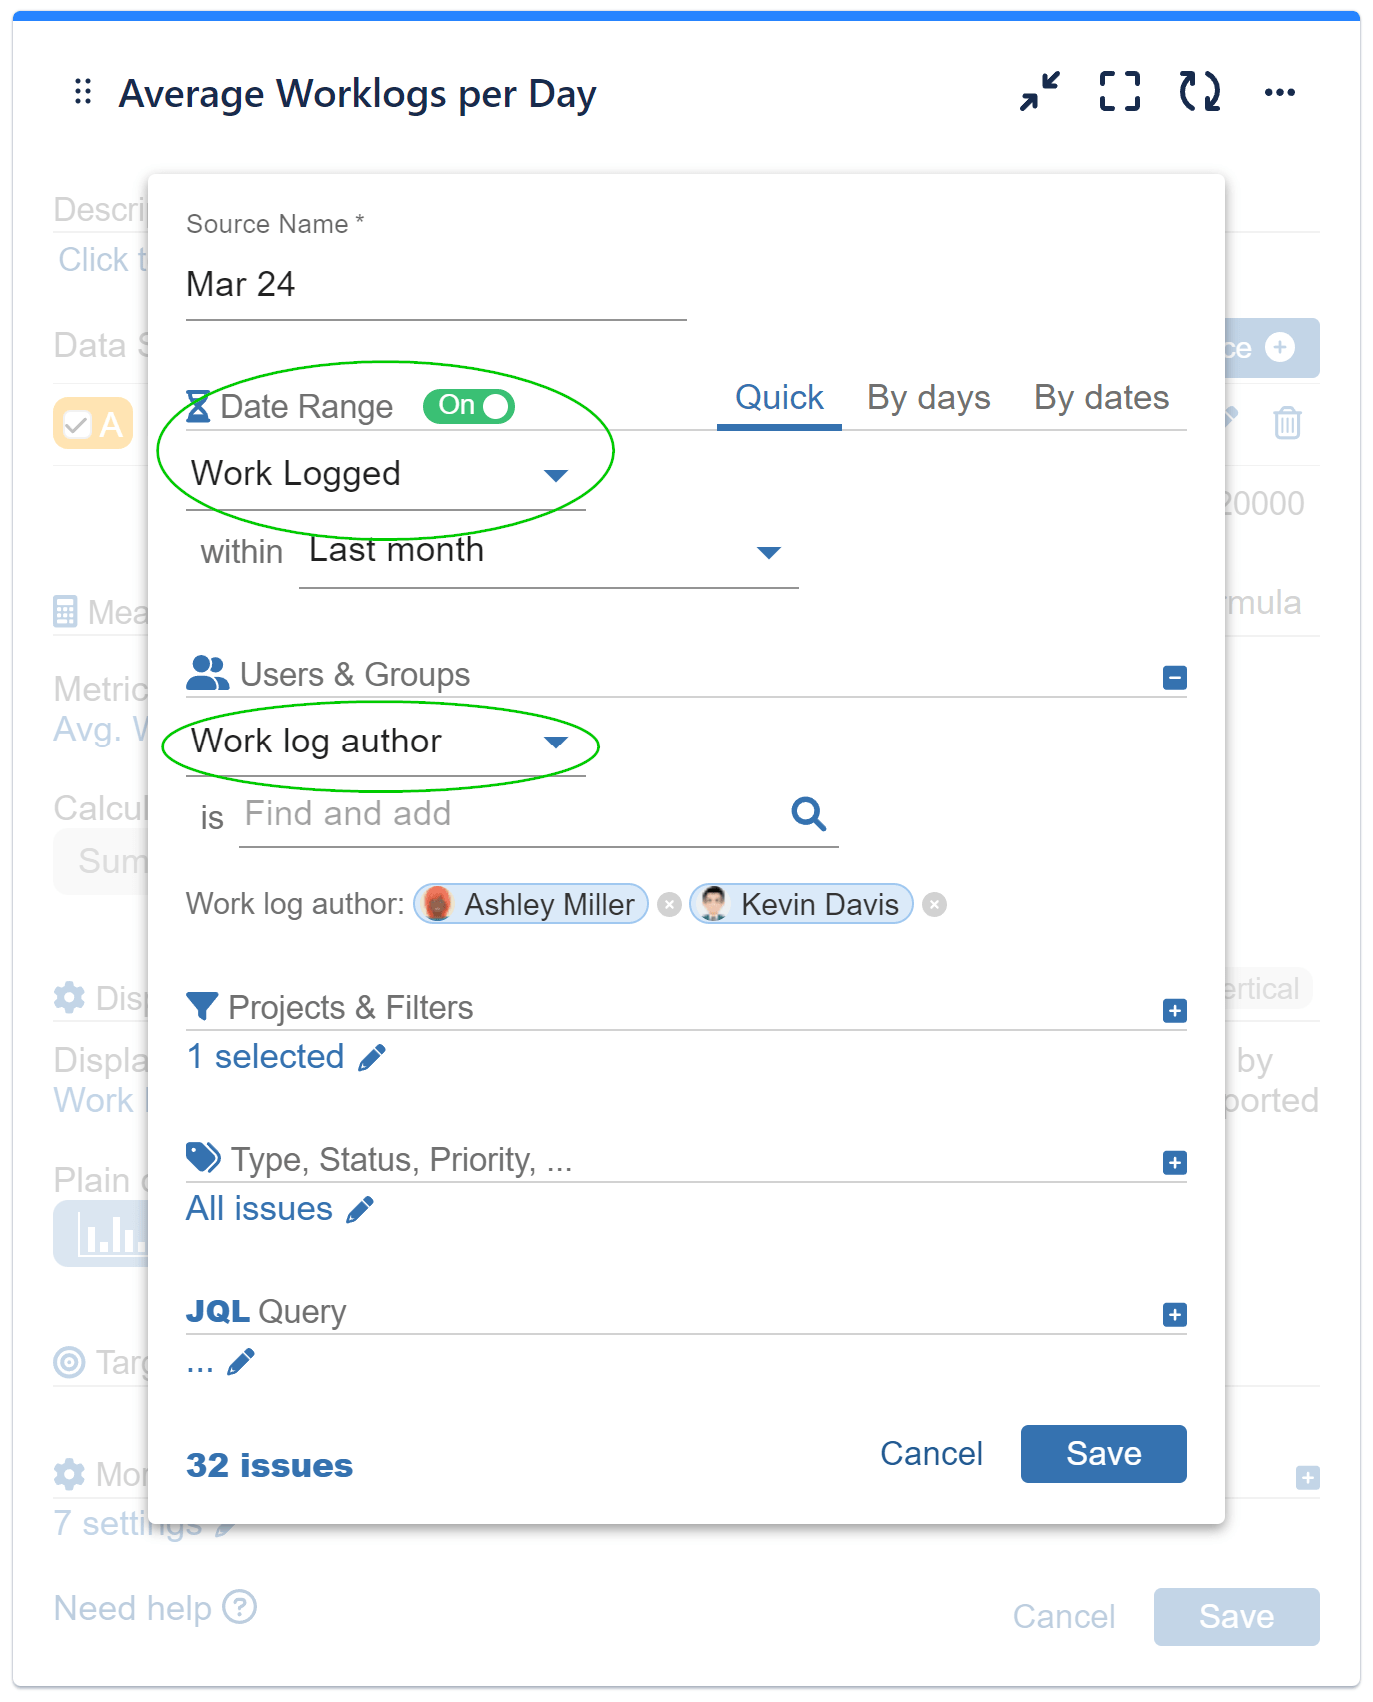
These are the configuration steps to create the chart above.
Setting Targets Using Average Metric results for Optimal Results
Enhance fairness, data-driven decision-making, accountability, and team performance optimization in Jira by utilizing the ‘Average Number of Issues per Day of the Week’ report as performance targets for your team members.
Using team averages as targets can be fairer than setting unrealistic goals. It takes into account the team’s collective productivity and ensures that individual targets are attainable. Let’s explore how to build such report with Performance Objectives.
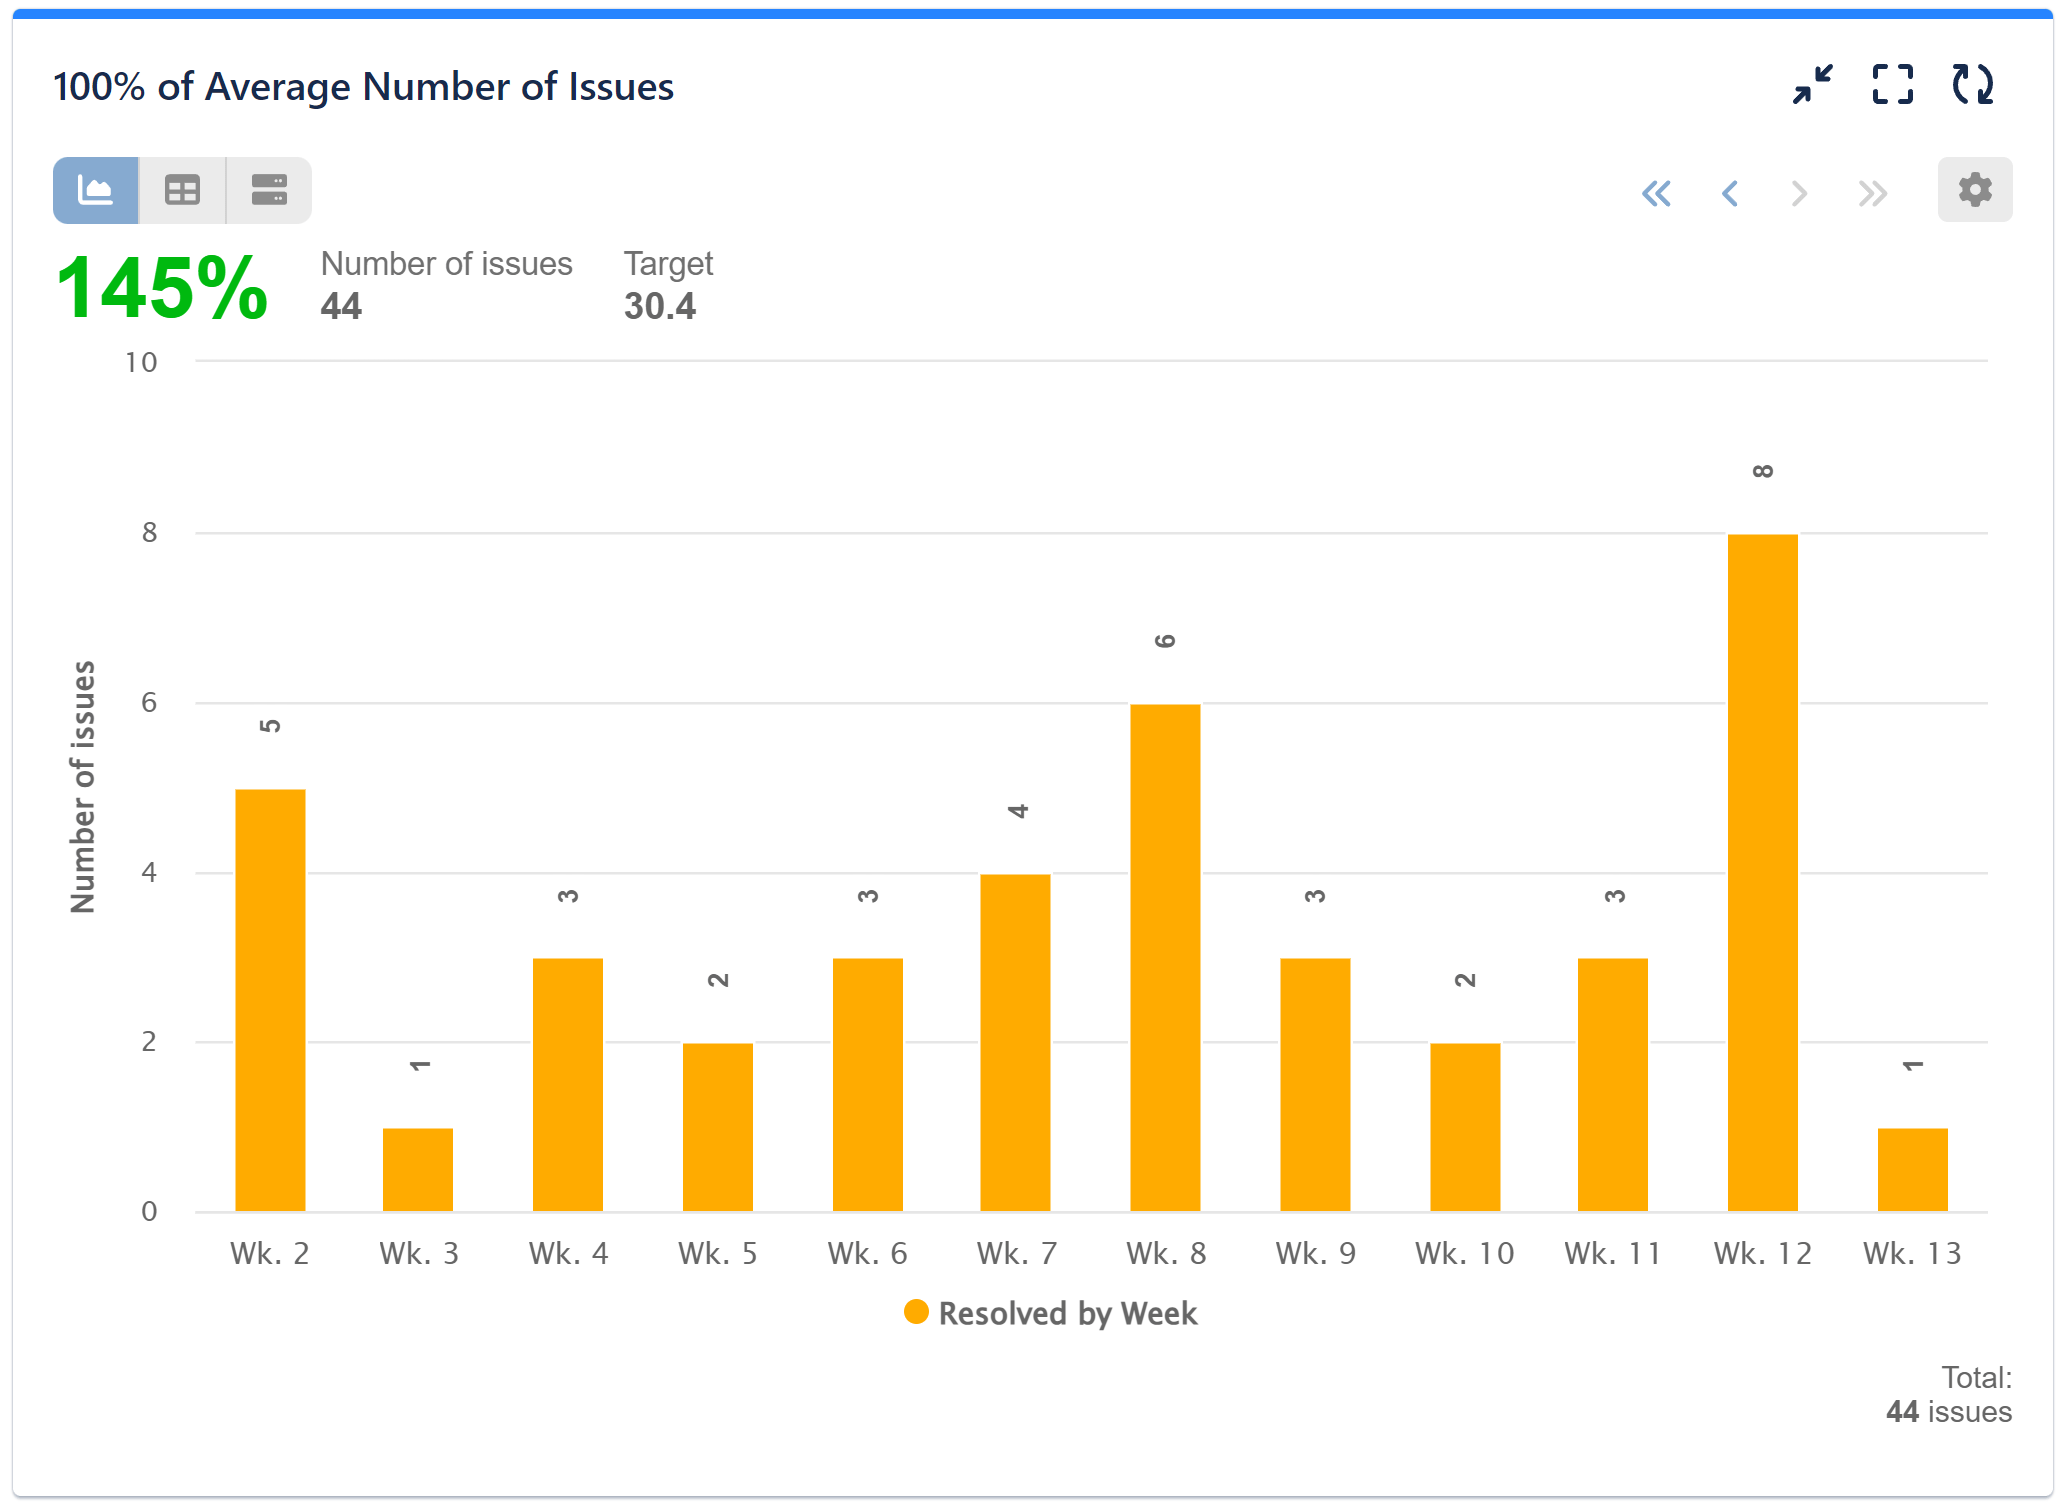
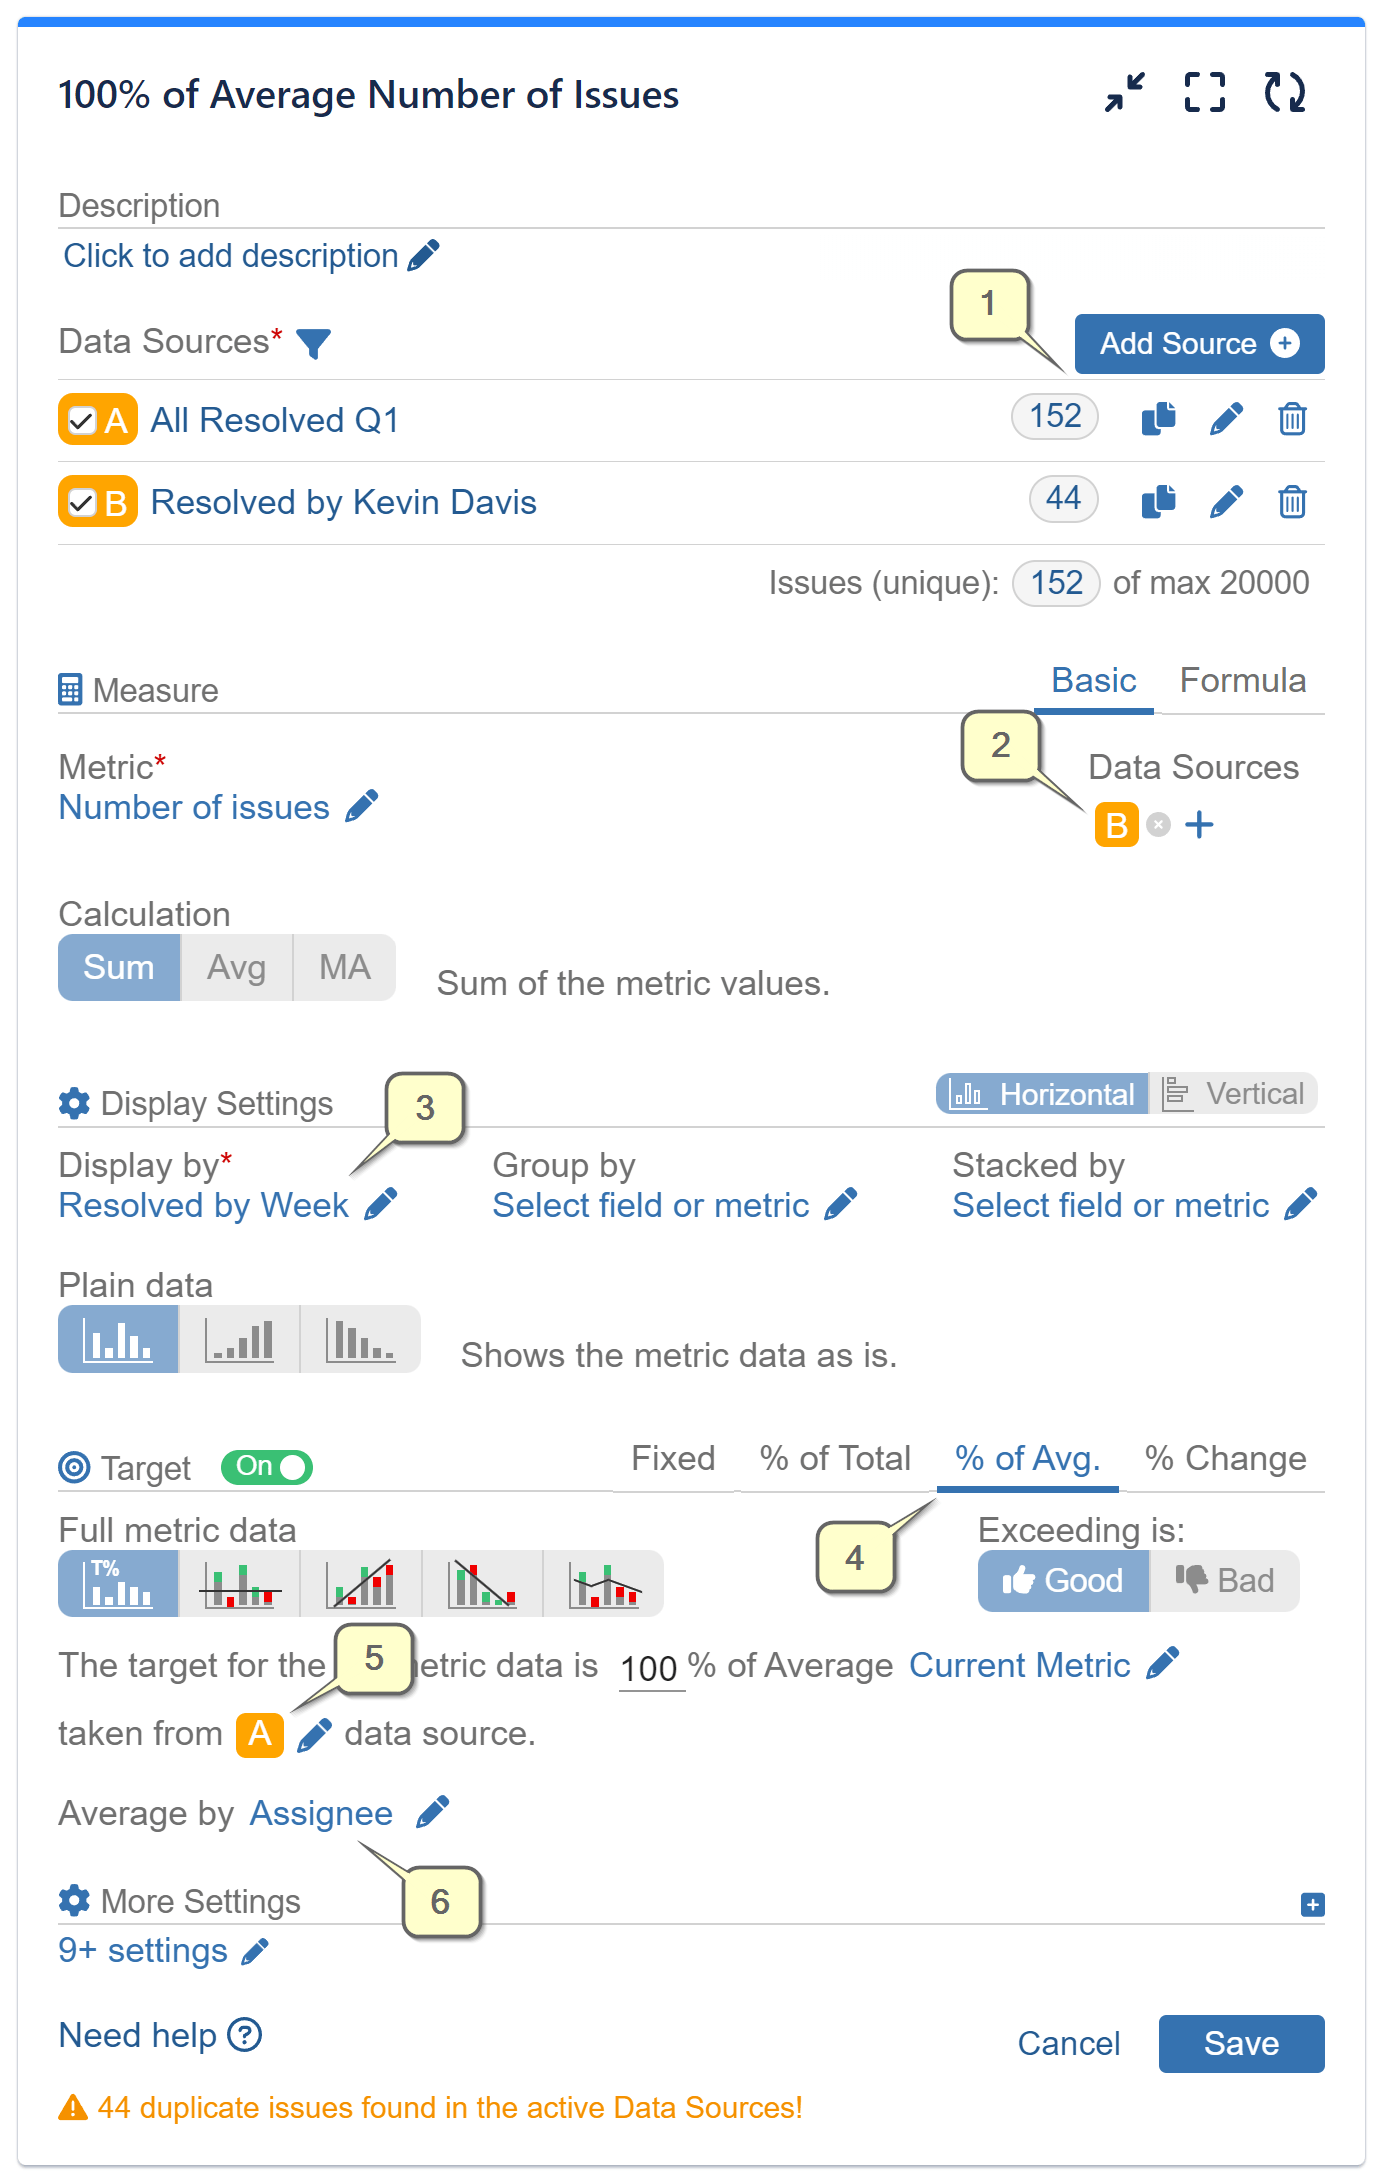
Step 1: Define data source “A” to encompass all resolved issues within the selected period. In our sample case this is a whole quarter. Specify a second data source “B” to include issues resolved by a specific team member during the same selected period.
Step 2: Set data source “B” as the source for the “Number of Issues” metric.
Step 3: Display by “Resolved by Week” and consolidate it by “Week of the Quarter.”
Step 4: Activate the Target feature and choose the “% of Average” Target type.
Step 5: Opt for the Fixed metric target result option. And select Data Source “A” for the target calculation.
Step 6: Specify Average by “Assignee.”
Below is a video recording demonstrating the process of setting up this report in Jira:
To access additional KPI reports, please visit our KPI examples page or reach out to our support team for assistance.
Start your 30 days free trial of Performance Objectives: Charts for Jira from Atlassian Marketplace.