Table of Contents
Enhancing Precision with Date-Type Fields and Date Granularity Options in Jira
Performance Objectives: Charts for Jira provides support for five distinct field types, each determining the field’s usability within the app as either a measurable metric, a display field, or both. These field types include Number, Date, Time, Text, and User.
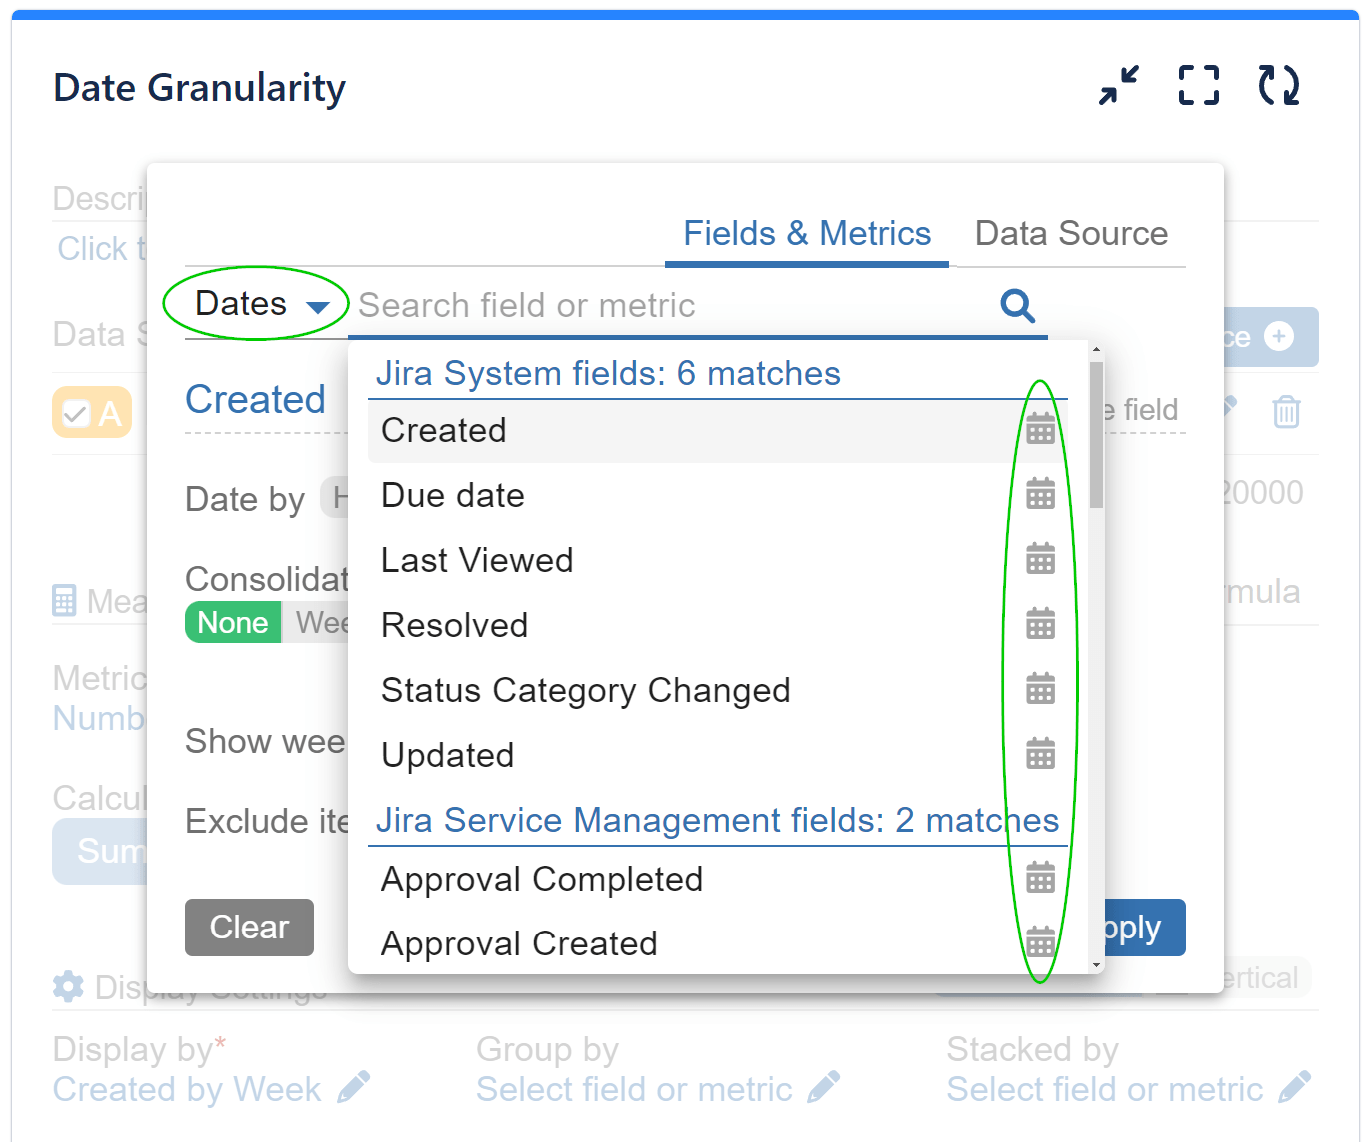
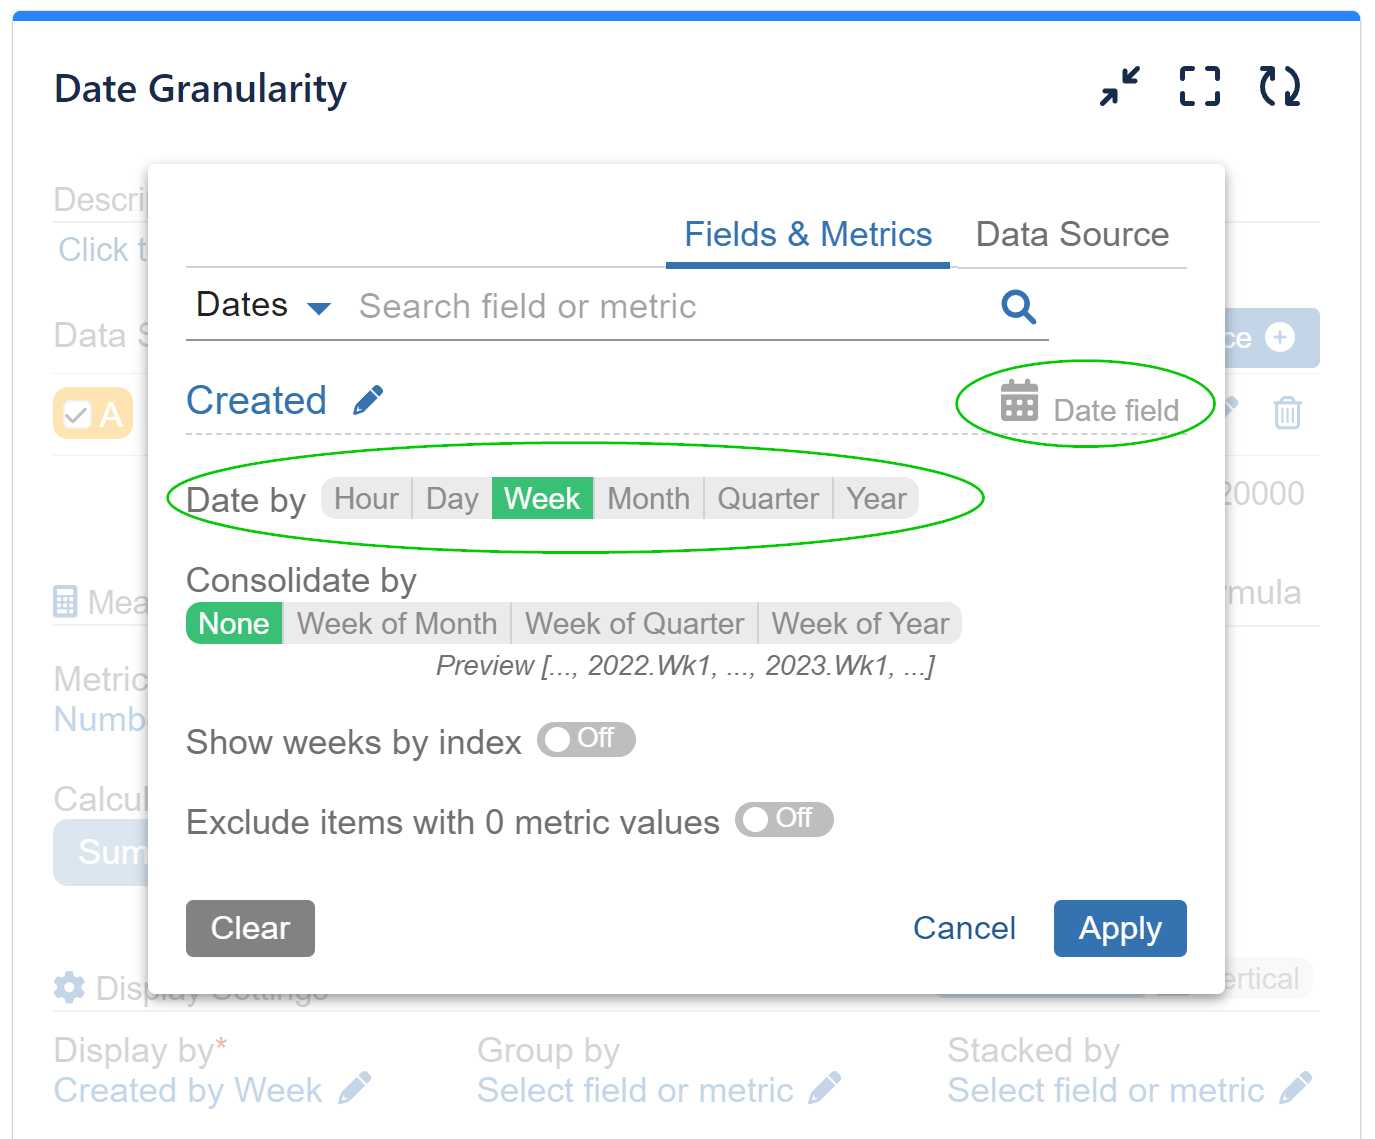
Date-type fields offer exceptional versatility by being selectable for ‘Display By,’ ‘Group by,’ and ‘Stacked By’ options, allowing users to present data at varying levels of detail and granularity:
- by Hour
- by Day
- by Week
- by Month
- by Quarter
- by Year
Enhanced Reporting and Analysis with ‘Consolidate by’ Feature in Performance Objectives for Jira
Jira users can also take advantage of our versatile ‘Consolidate by’ feature, which offers a wide array of date types for reporting flexibility. This feature is available for various time intervals, including:
- Hour of Day
- Hour of Week
- Day of Week
- Day of Month
- Week of Month
- Week of Quarter
- Week of Year
- Month of Quarter
- Month of Year
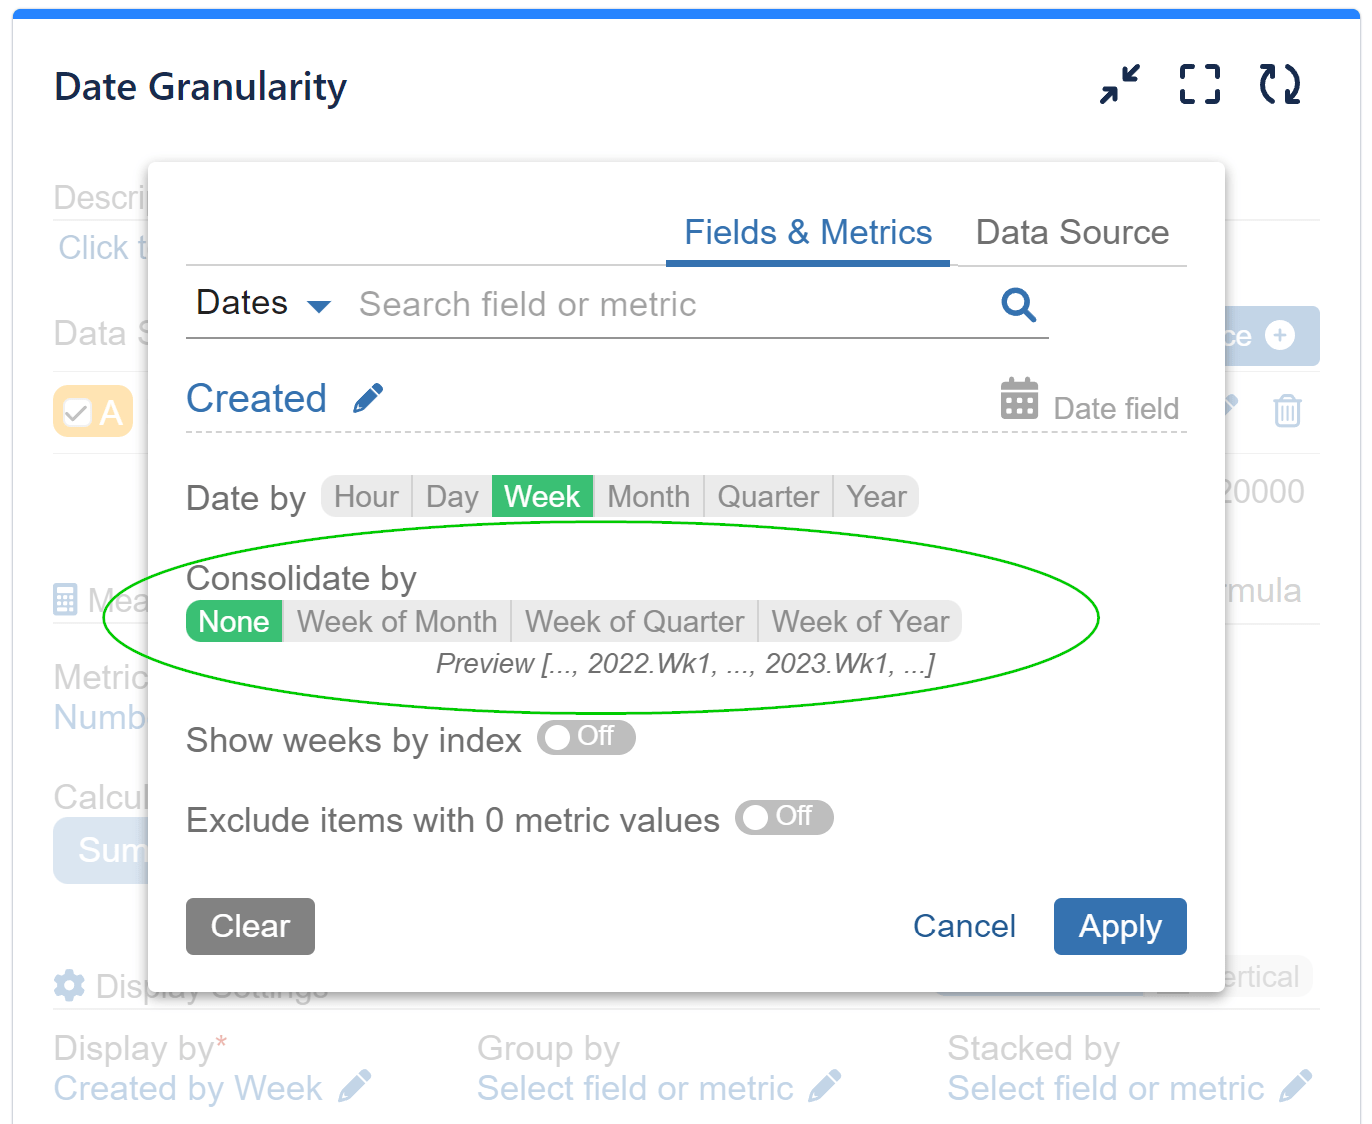
These options empower users to tailor their reports and analysis according to their specific needs, enhancing data visualization and decision-making capabilities.
Let’s explore how easily we can compare data using Performance Objectives’ Date granularity and the ‘Consolidate by’ features in Jira:
Leveraging Percent Change Indicator with Jira Date-Type Fields in Tiles View
When you choose to see your Jira data in Tiles View, our Performance Objectives app provides additional insights for better analysis. All date-type fields available and selected for “Display by” (or the x-axis of your chart) include a percent change indicator. This indicator uses the first date segment displayed on the chart as the starting point for its calculation, and each subsequent value shows the change from the previous one.
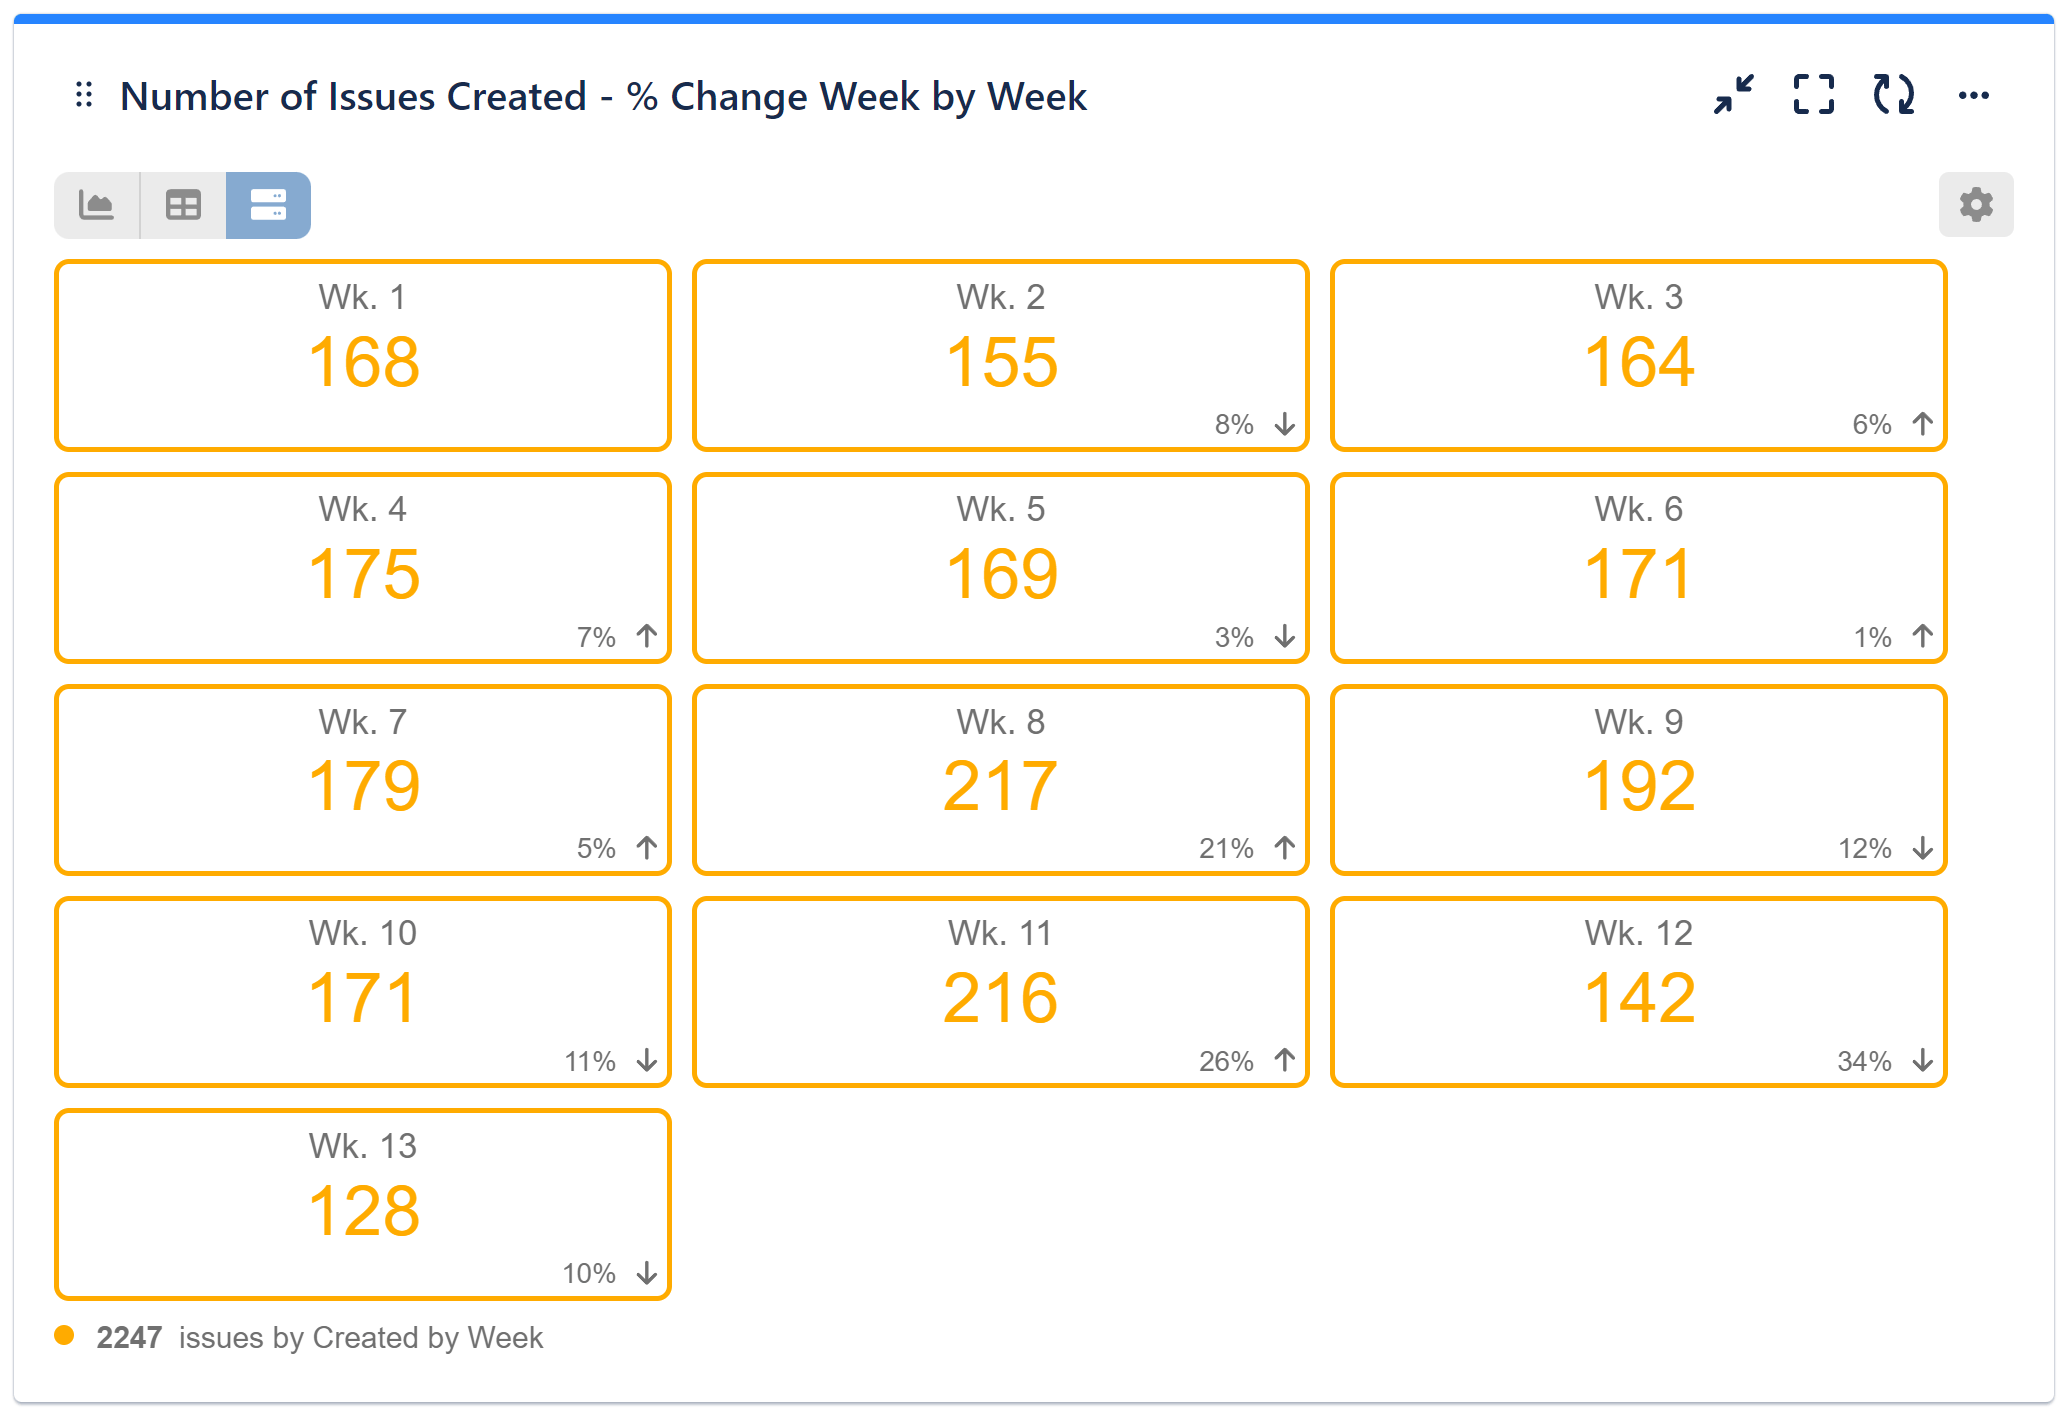
The percent change indicator facilitates trend identification, performance tracking, and benchmarking by visually representing relative increases or decreases from a baseline. This feature enables quick assessment of performance changes over time, aiding in the identification of trends and deviations from established benchmarks, thus supporting data-driven decision-making.
If you’re interested in exploring different field types and metrics supported by the app, please consult our Configuration Overview. To discover more features, you can browse the User Guide. If you’d like to schedule a demo, you can do so from our customer portal.
Start your 30 days free trial of Performance Objectives: Charts for Jira from Atlassian Marketplace.