Range Date Field as a Key to Time-Based Data Insights
The Range Date is a key Date field, seamlessly integrated into nine out of ten dashboard gadgets within the Performance Objectives app. It empowers you to create compelling reports in Jira, allowing you to compare multiple data sources with different Jira date fields selected as date ranges, such as ‘Created’ with ‘Resolved’ with any other relevant date field.
Dive into the analysis of different date fields within your ‘Data Source’ date range, and effortlessly synchronize them along the x-axis timeline using the Display by: ‘Range Date’ option.
Analyzing Performance Trends: Net Flow of Requests Report
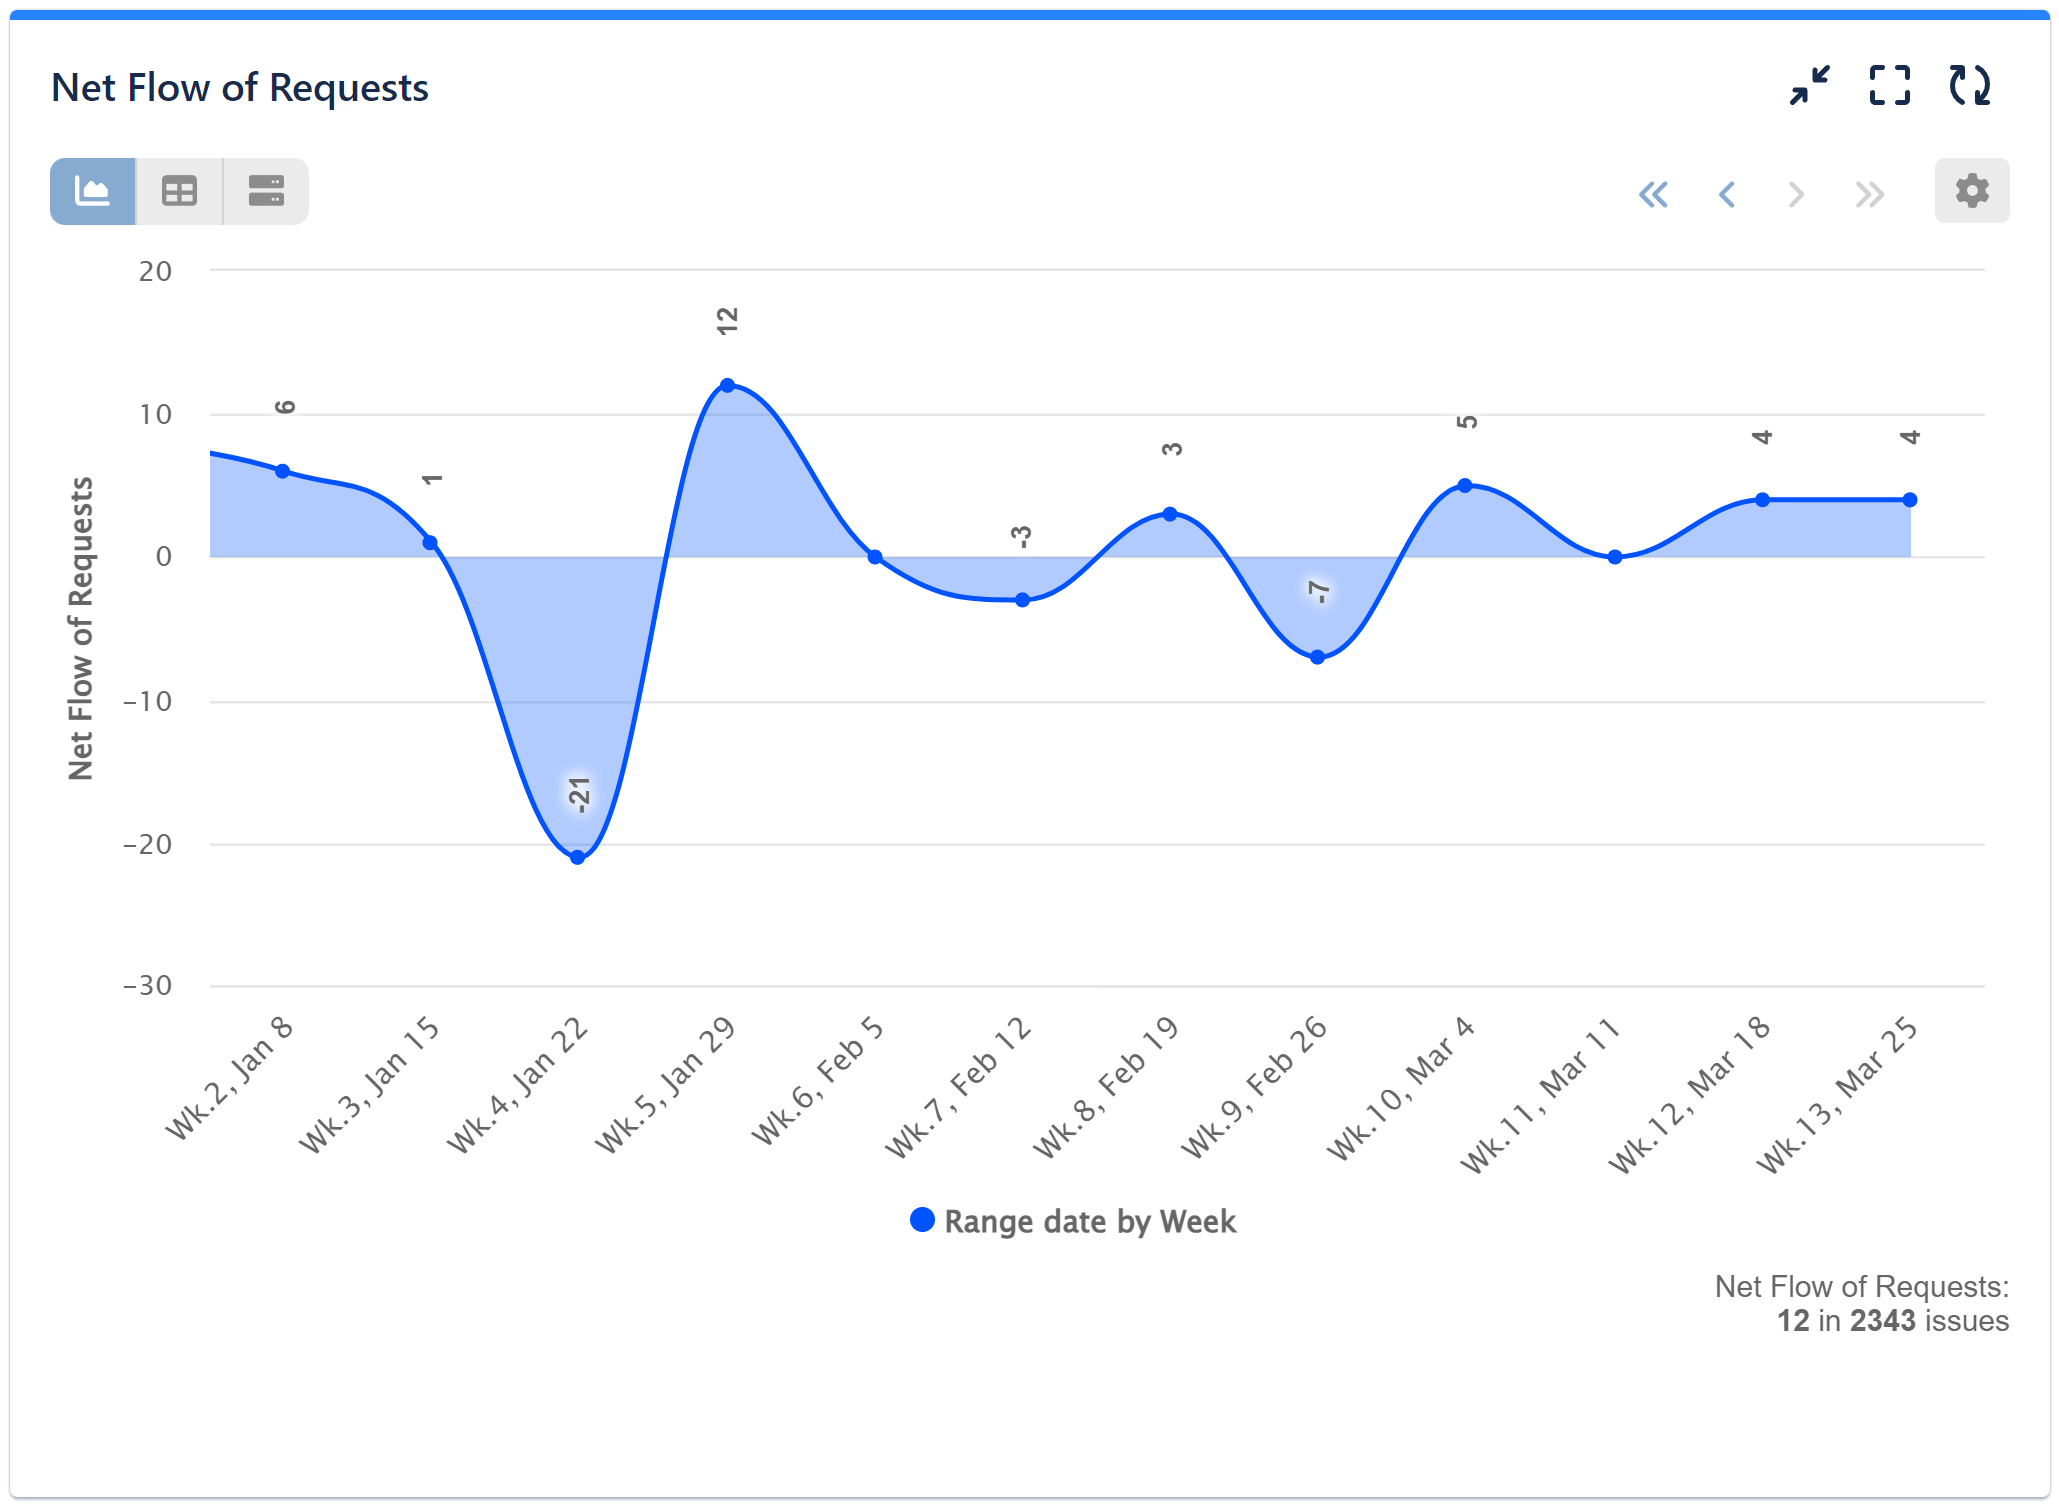
To identify weeks with a higher number of issues created than resolved, you can leverage multiple data sources, select various date type fields for date ranges, and configure the Range Date field for “Display by Week” to generate a Net Flow of Request report. Our sample report visually represents the difference between resolved and created issues within the selected period, with negative values indicating that more issues were created than resolved.
Please find below the configuration steps for setting up Net Flow of Request Report with the Performance Trend dashboard gadget:
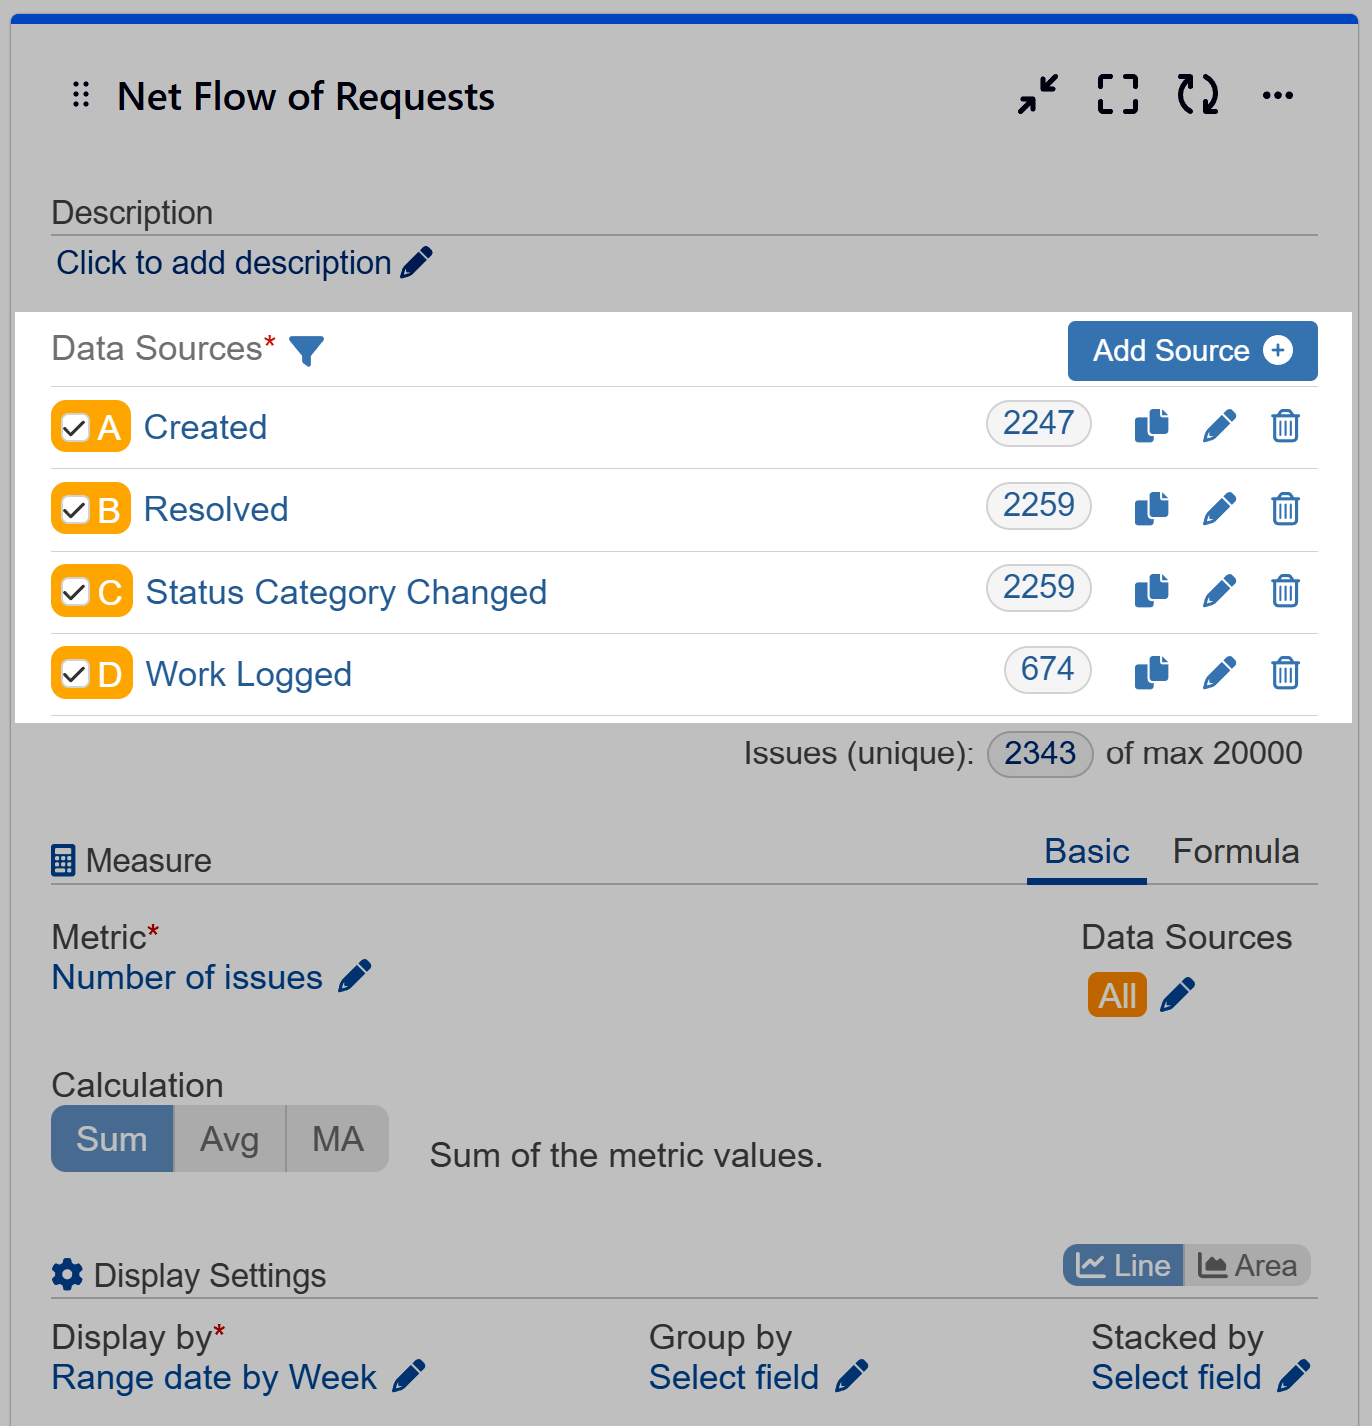
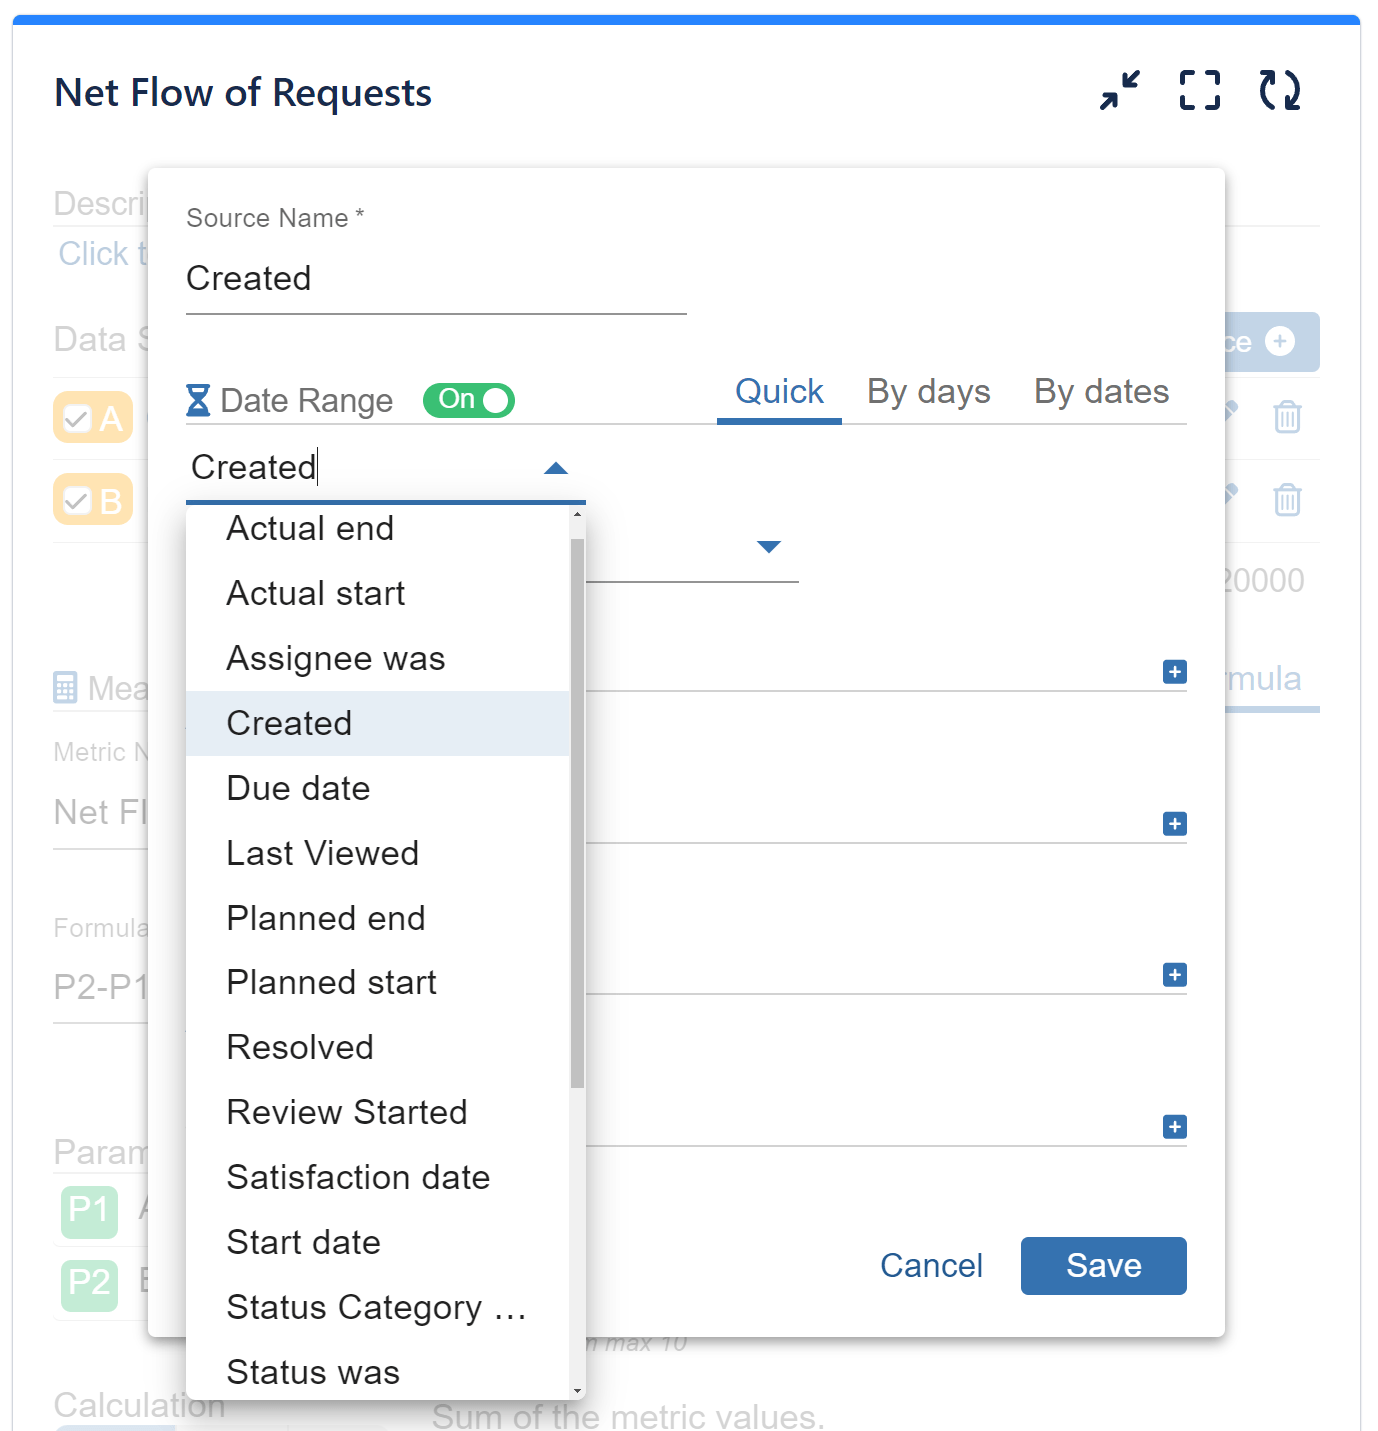
Step 1: Begin by adding your first data source. In our sample case, this is ‘Created’ issues for a designated period.
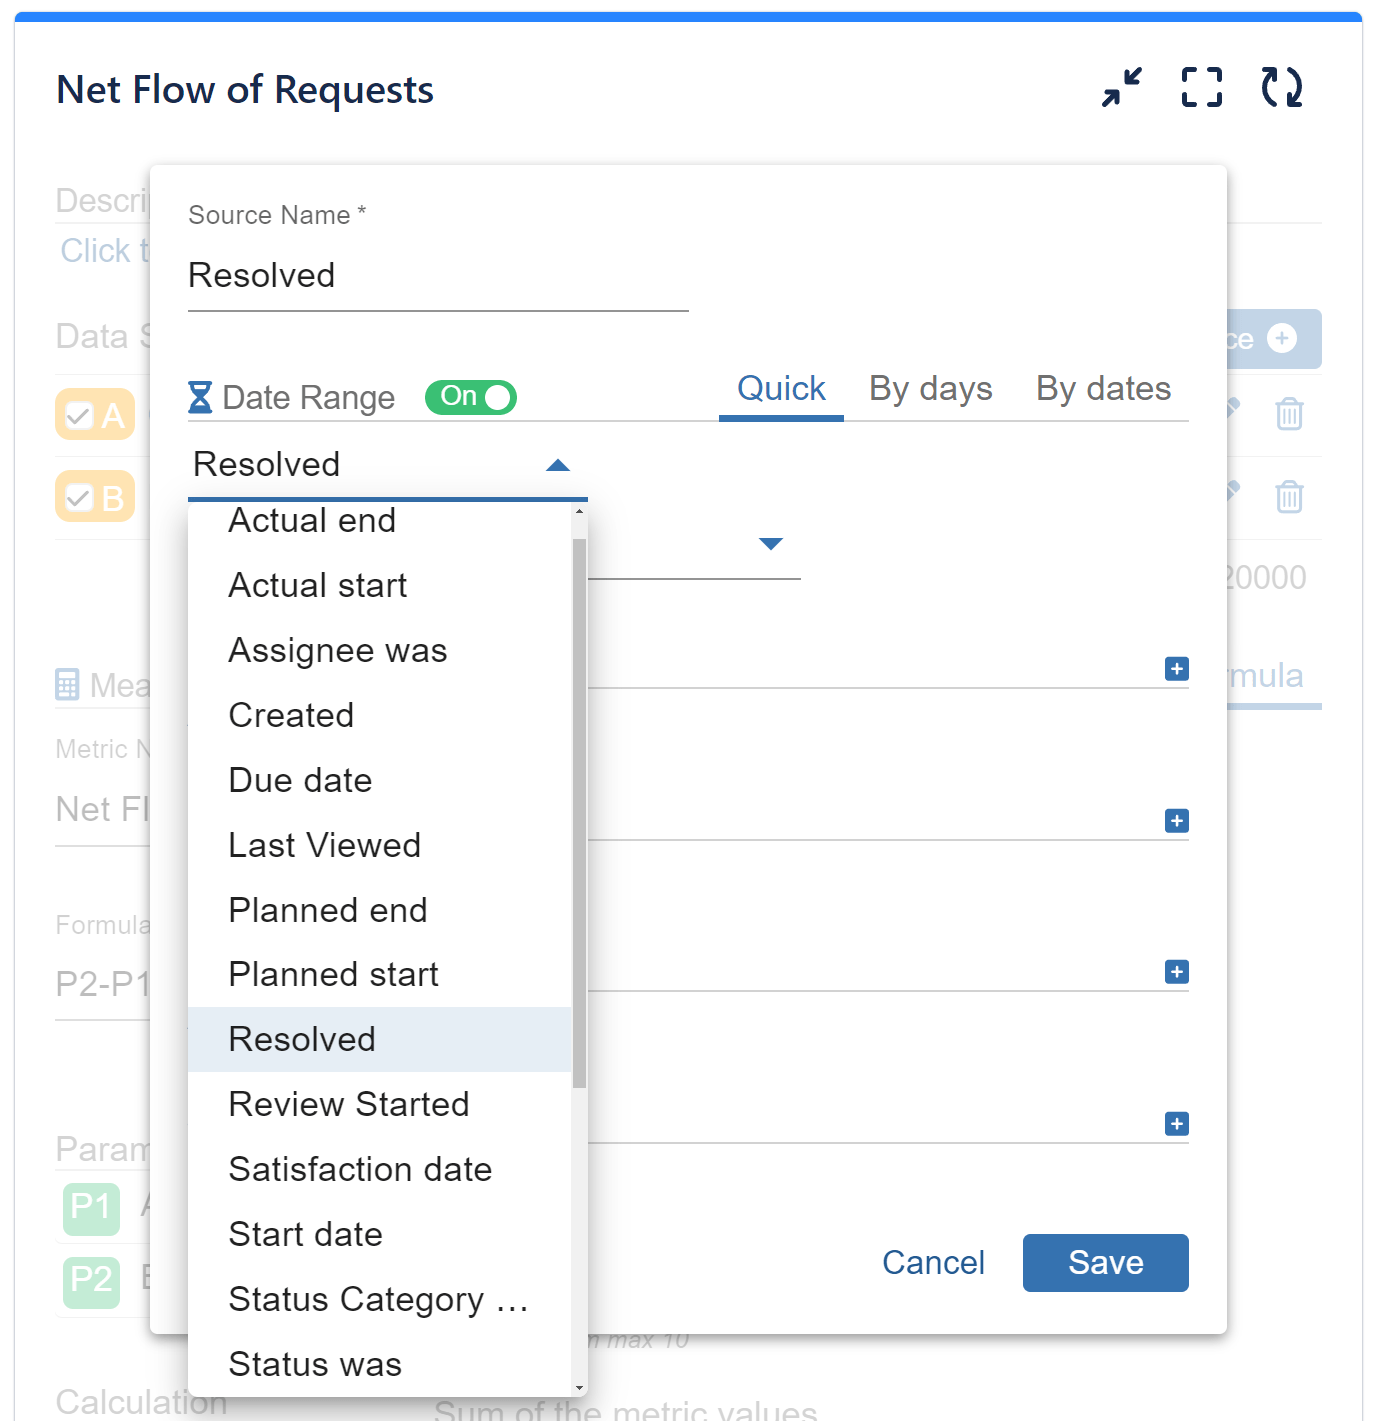
Step 2: Add your second data source, depicting ‘Resolved’ issues for the same matching period as in data source A.
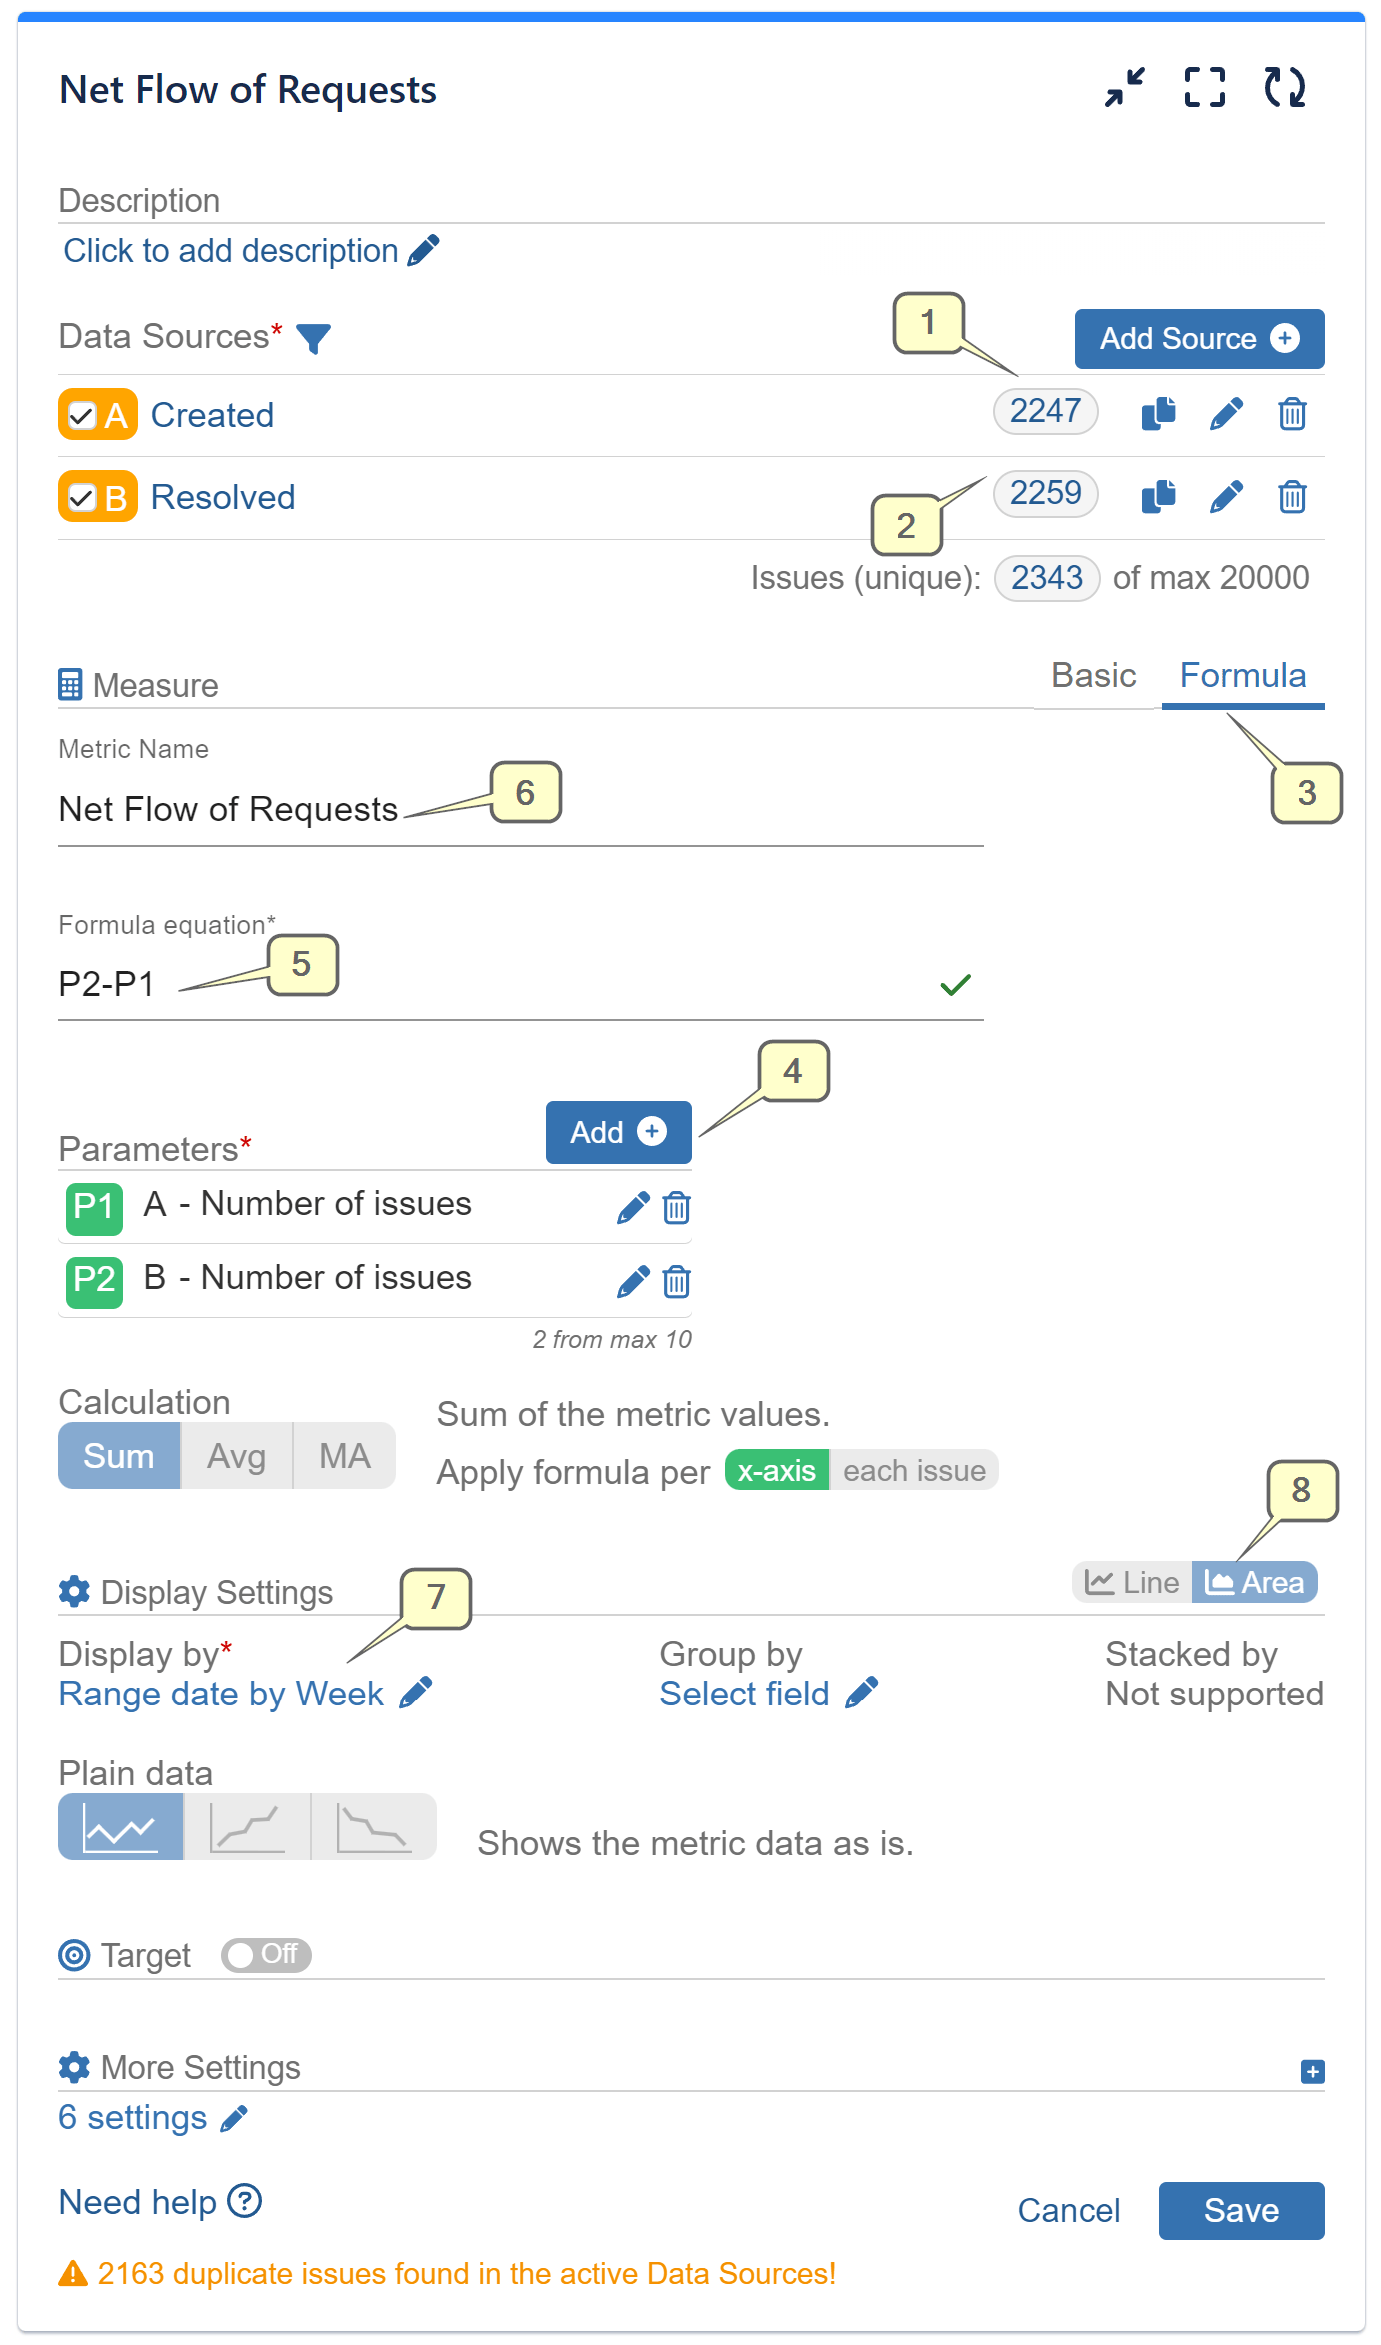
Step 3: Opt for Formula metric calculation.
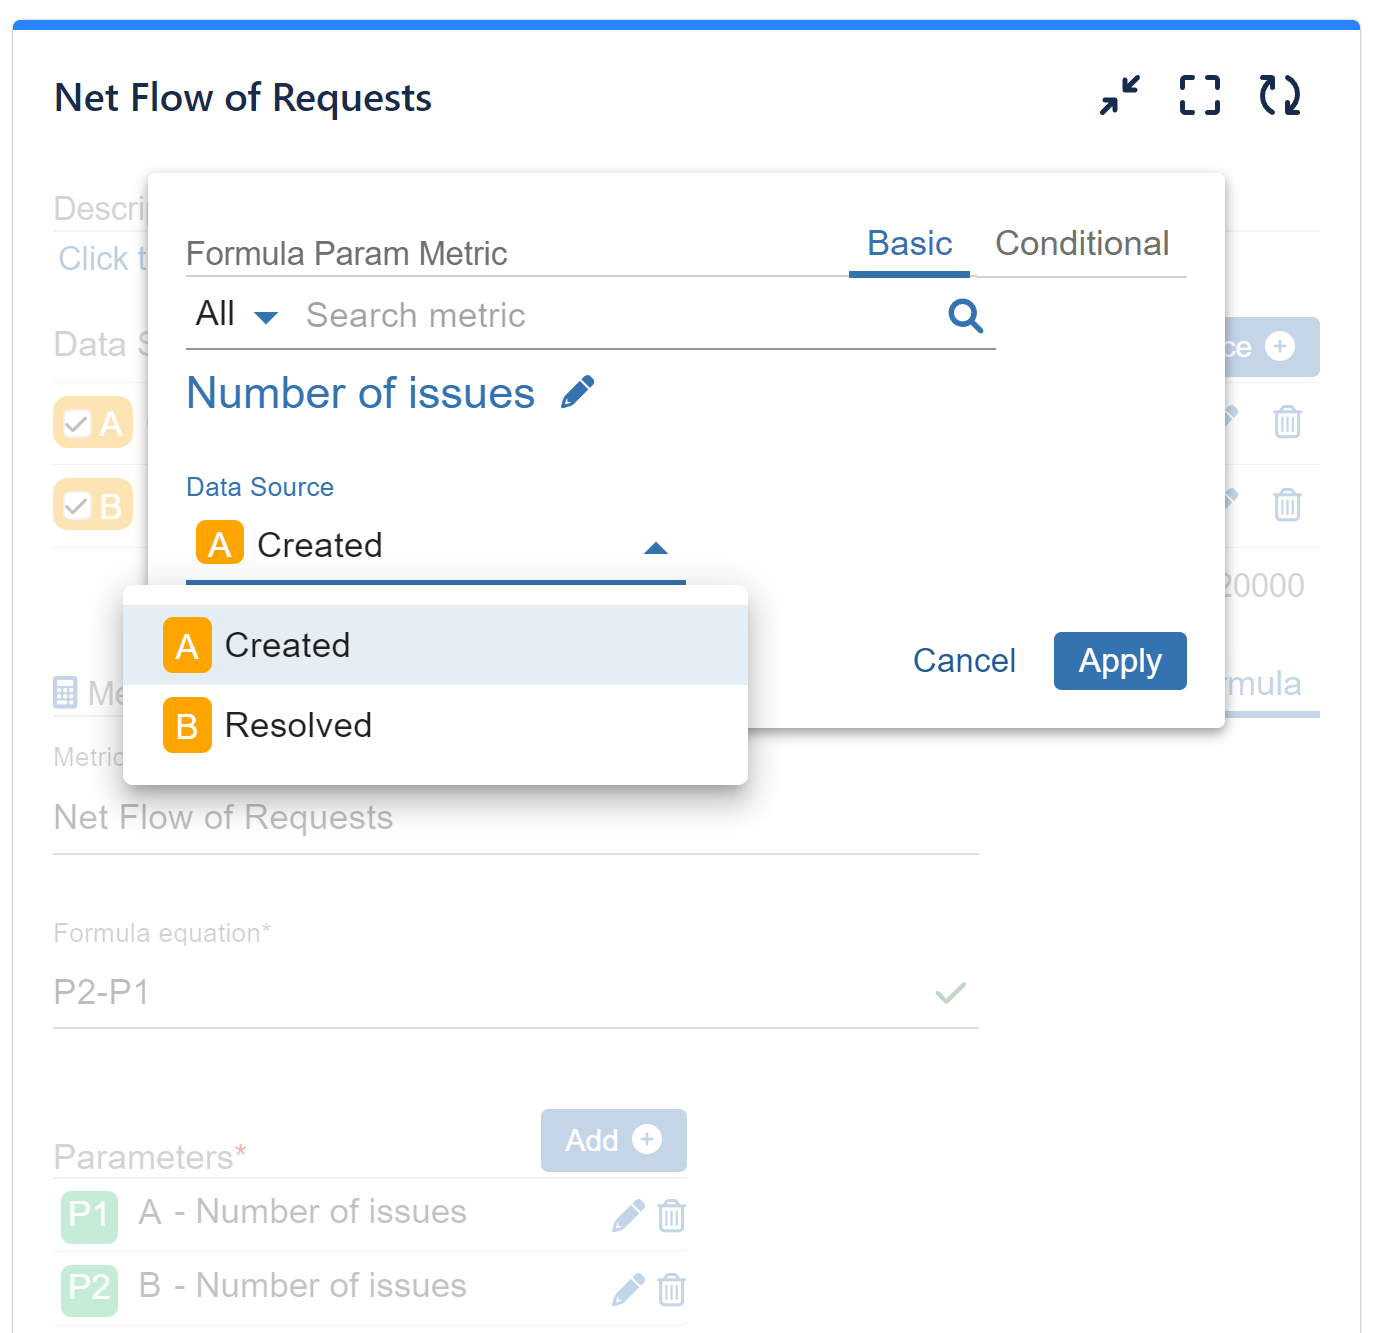
Step 4: Add parameters. In our case P1 = Number of issues from Data Source A (Created), P2= Number of issues from Data source 2 (Resolved)
Step 5: Type the (P2-P1) formula equation.
Step 6: Set a custom name for your newly created formula metric.
Step 7: Choose the ‘Range Date’ field for ‘Display by.’ This field synchronizes all date values from the selected date fields within your data sources. In our case, we have chosen ‘Date by – Week.’
Step 8: Optionally, switch from Line to Area chart view.
Access additional configuration screens for detailed information on steps 1 and 2:
Step 4 in details:
Another excellent example of Range Date utilization is detailed in our “Created vs Resolved vs Any Date” article, where you can learn how to compare more than two date fields, upgrading on the Jira native created vs resolved chart gadget.
If you’d like to delve deeper into the features of Performance Objectives: Charts for Jira, we invite you to explore our User Guide and KPI examples.
Start your 30 days free trial of Performance Objectives: Charts for Jira from Atlassian Marketplace.