Display open issues over time in Jira Dashboard. Keep your ticketing process under control using ‘Number of Issues over time in status‘ metric available in Performance Objectives app.
Create “Open Issues Over Time Report” in Jira
Key settings to create your ‘Open Issues over time’ report in Jira:
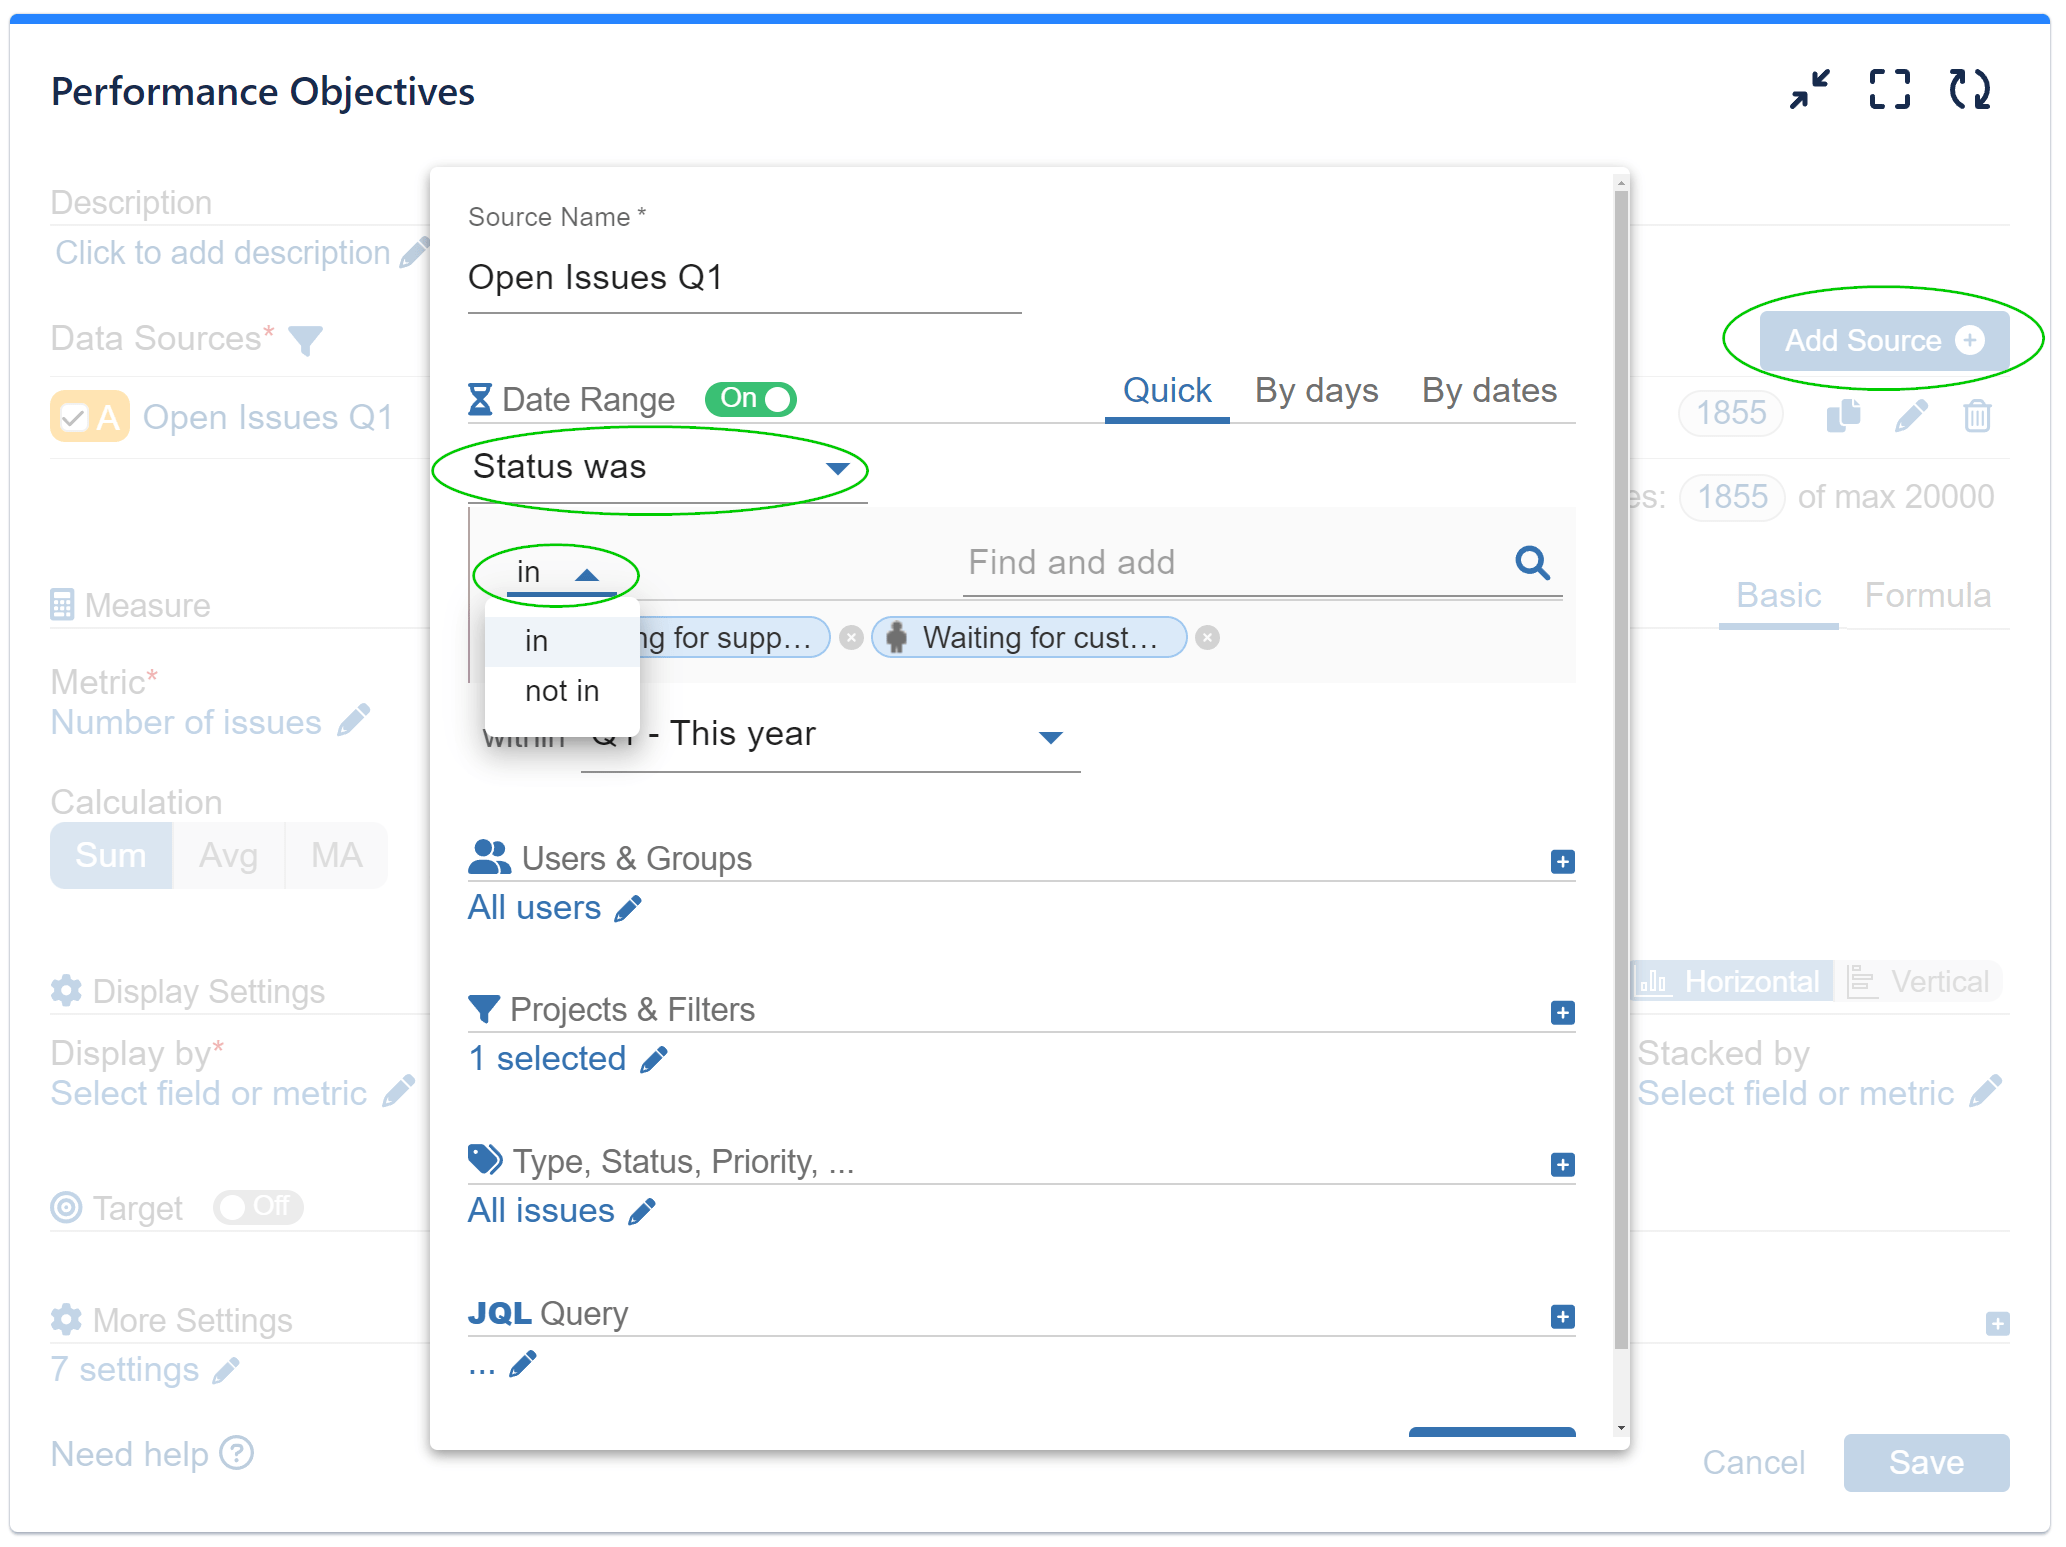
- Data Source – you have 2 options here:
- You can select your date range to fit you exact needs. It may be any date range, e.g. past 30 days, past quarter, etc., depending on your Issue Cycle time. Use the ‘Status was’ in / not in option to customize your data source and choose one or multiple statuses to include or exclude from your report. Using the ‘Status was’ field will help you catch older issues that may have been created before your date range but were still in the reported status(es) within the date range. This option will be also very useful if you have multiple statuses in certain category as you can exclude, for example, status closed/resolved and thus all statuses in category ‘Open’ will be included in your report.
- you can disable the date range, and the app will automatically filter the created issues for the past 2 years.
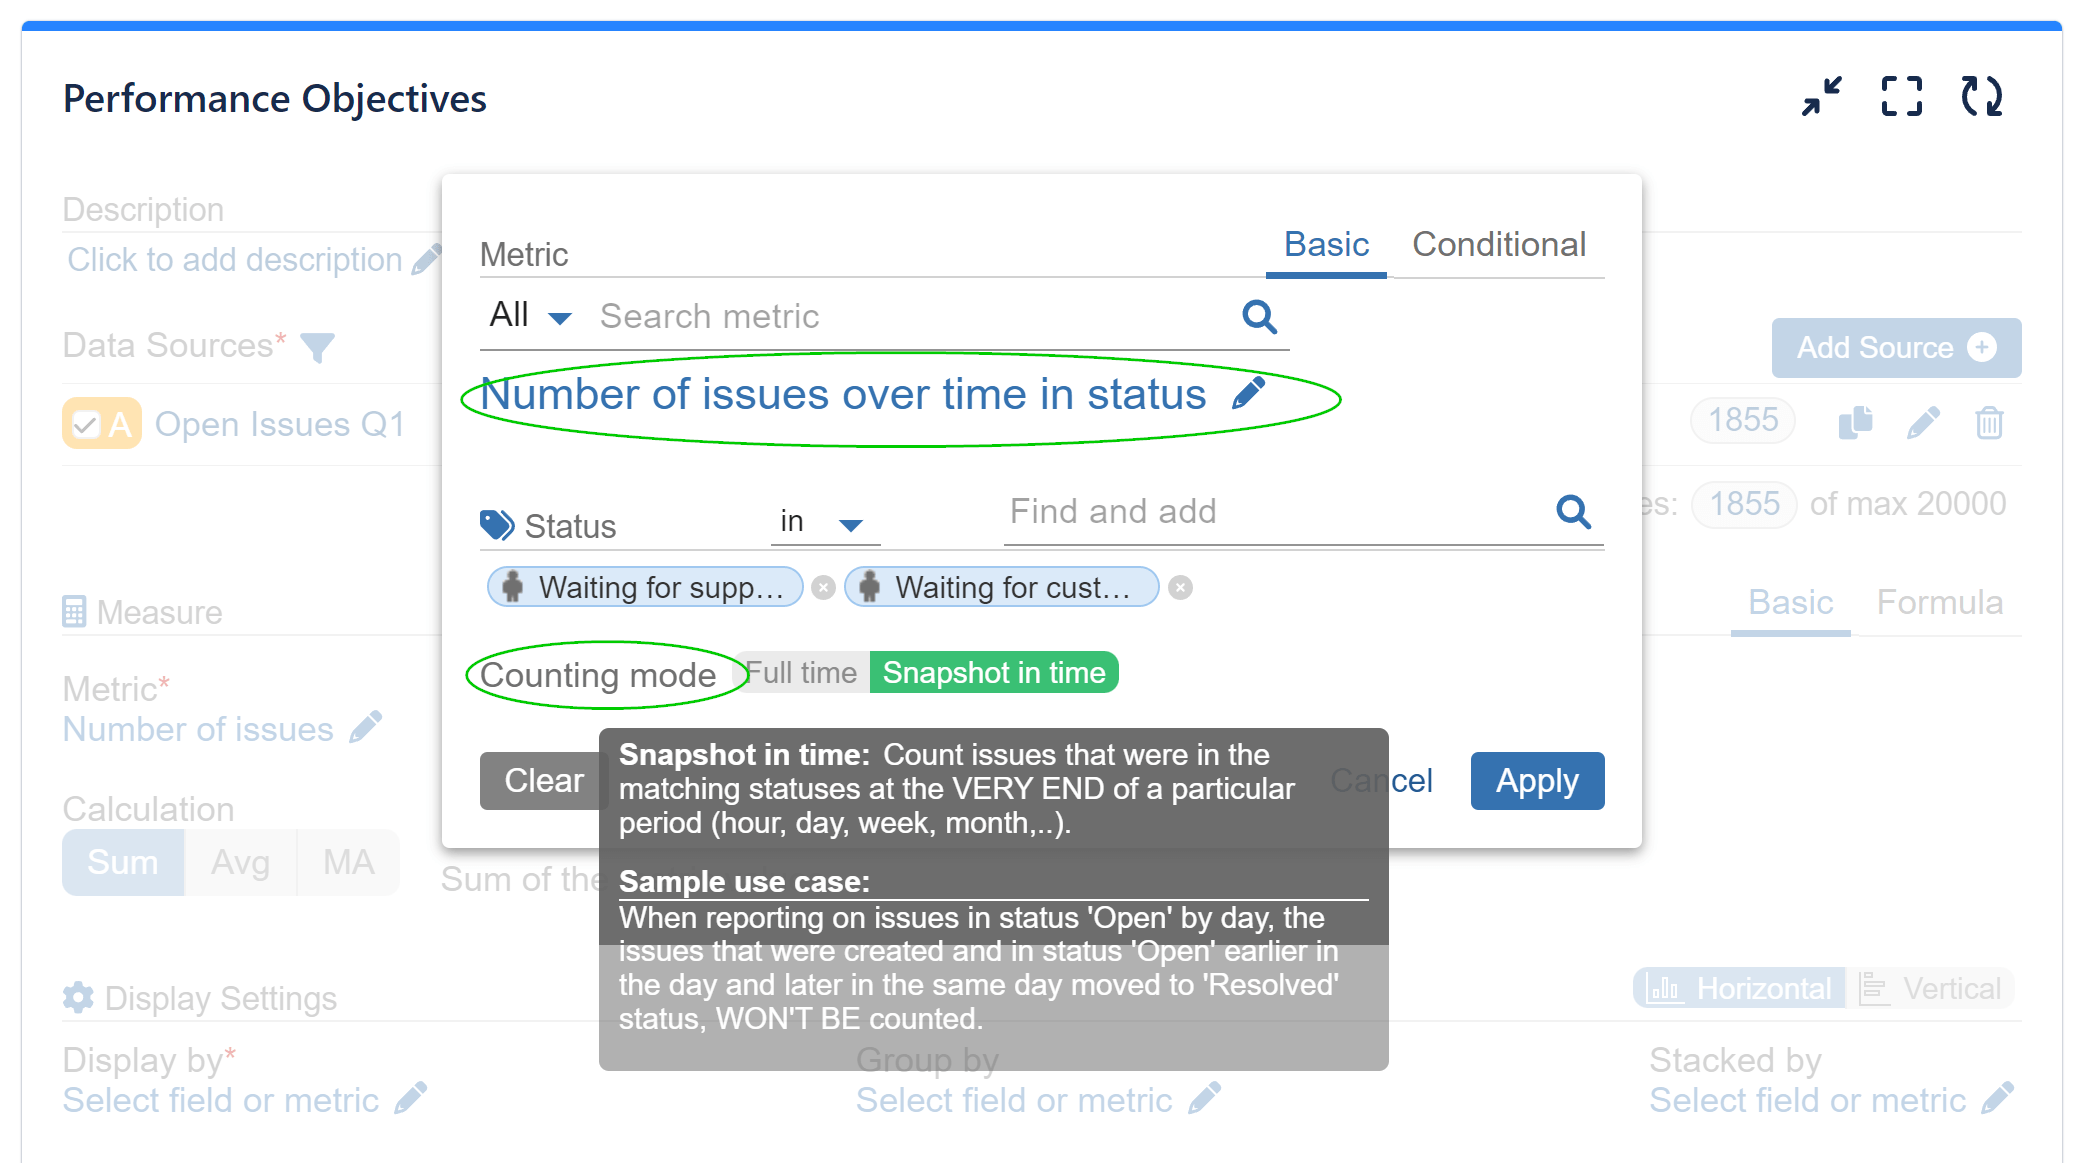
- Metric: Select the ‘Number of Issues over time in status’ metric and filter the same status(es) as in your Data Source. The metric allows you to see your issues over time by any status in different granularities, in one of the following counting modes:
- daily count of open issues in certain status/es as a snapshot in time, i.e. at the very last moment of the selected granularity. If you have chosen status ‘In Progress’ and your granularity is ‘by day’ for the past 30 days to today, your chart will show all issues that were in status ‘In Progress’ at the end of every day for the selected period.
- daily count of open issues with counting mode full time: If you have chosen status ‘In Progress’ and your granularity is ‘by day’ for the past 30 days to today, your chart will show all issues that were in status ‘In Progress’ during the day, no matter that they may have been closed by the end of the day.
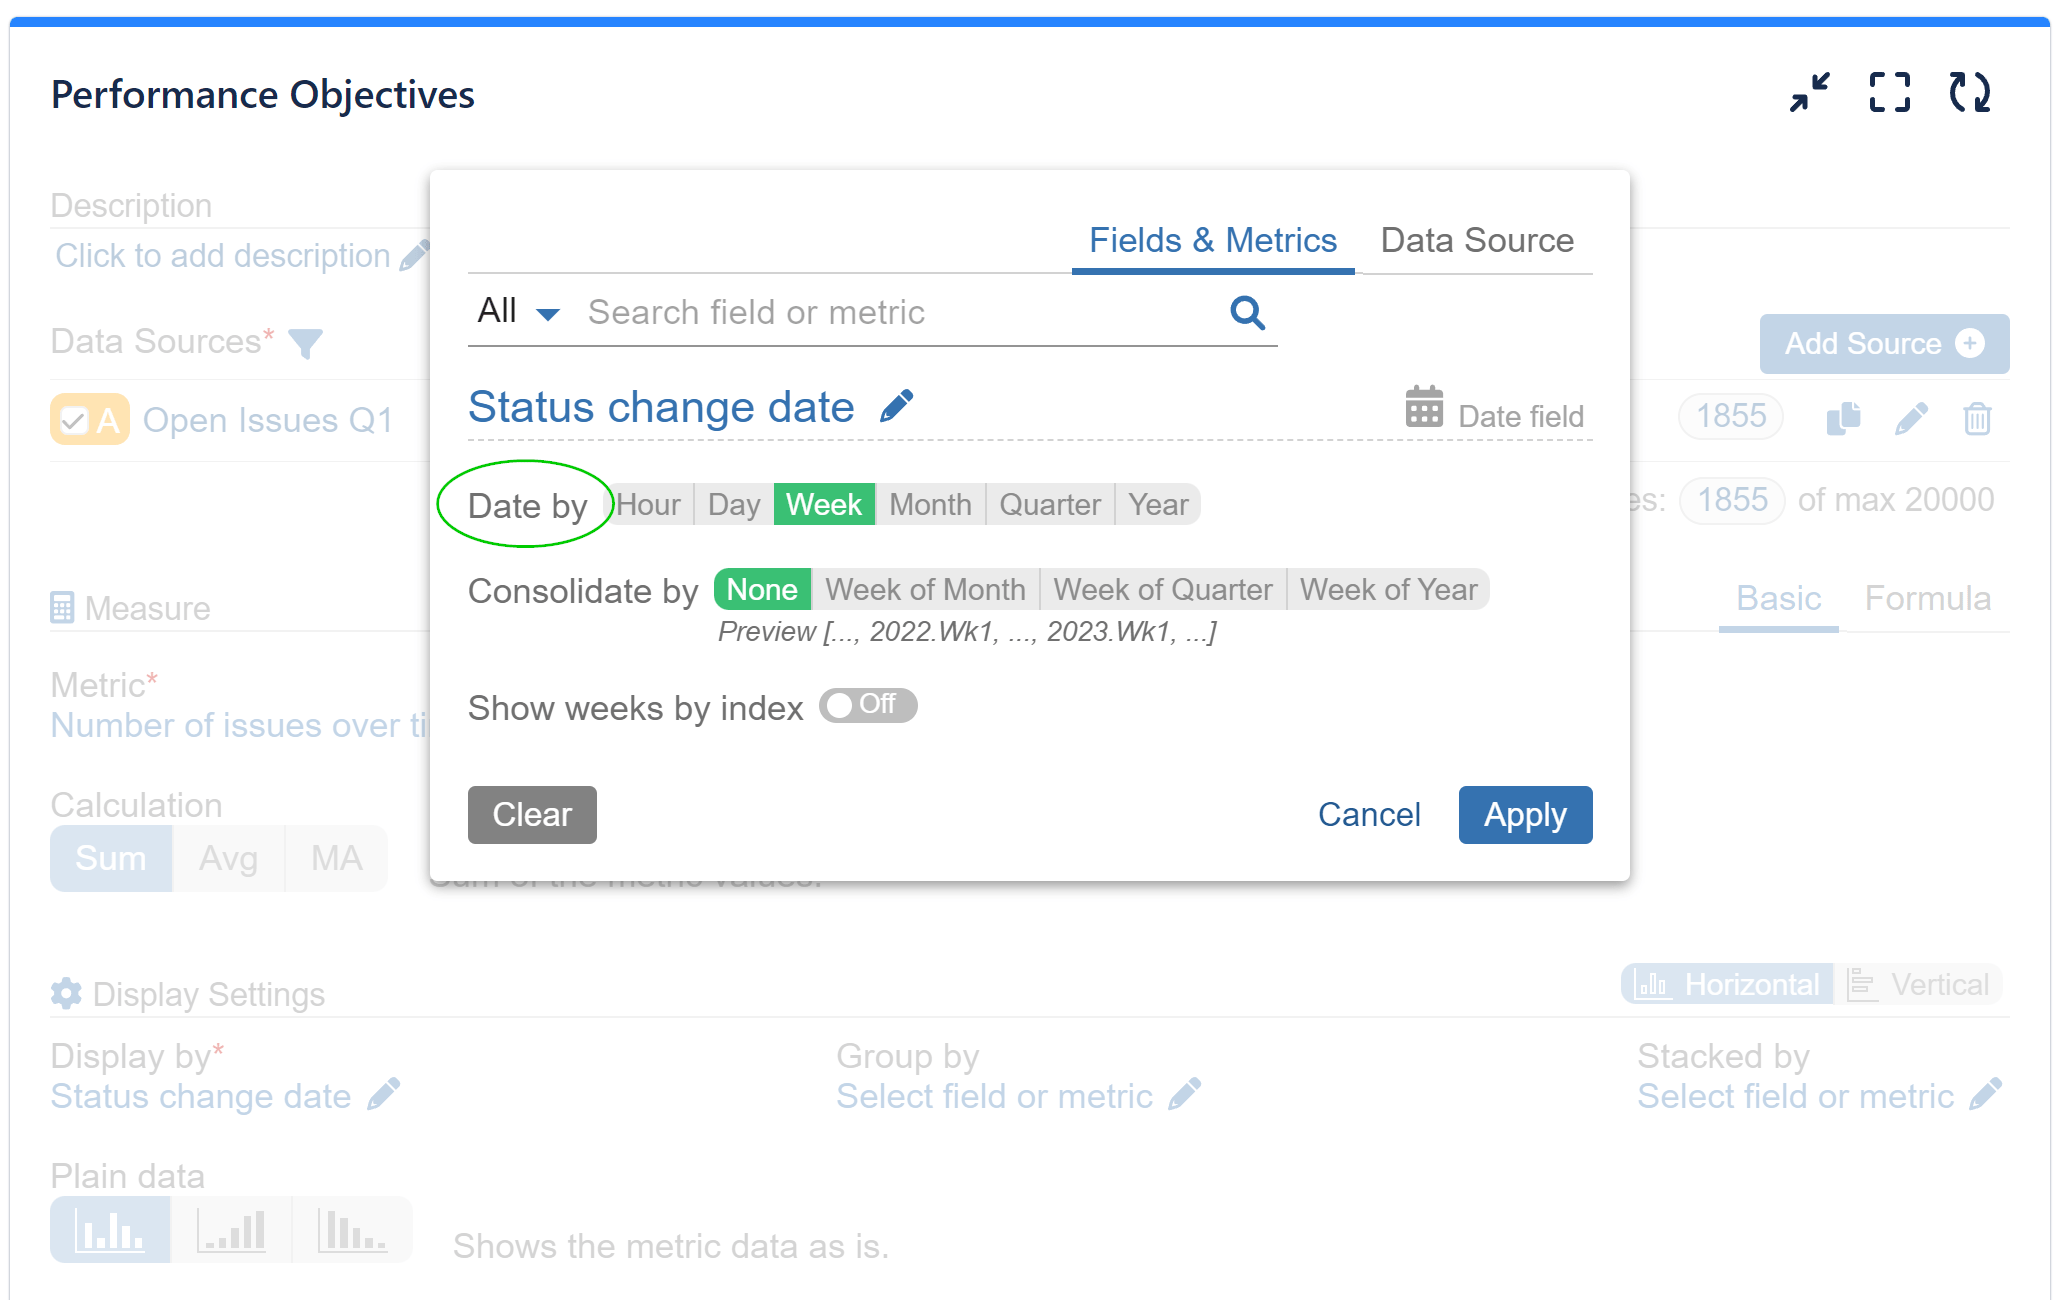
- ‘Display by’ is automatically set to use ‘Status Change Date’, which we advise you to keep as changing it may result in a loss of reporting sense. You can choose your date granularity in the ‘Display by’ field settings, as shown below:
Group by / Stack by options: select your preferred field or metric for ‘Group by’ and ‘Stack by’ options to add additional insights to your Open issues report. For instance, you can use ‘Status (History)’ for Stack by to visualize the statuses of your open issues over the selected period.
Here is a sample visualization for a Jira Service Management project using the Performance Objectives dashboard gadget:
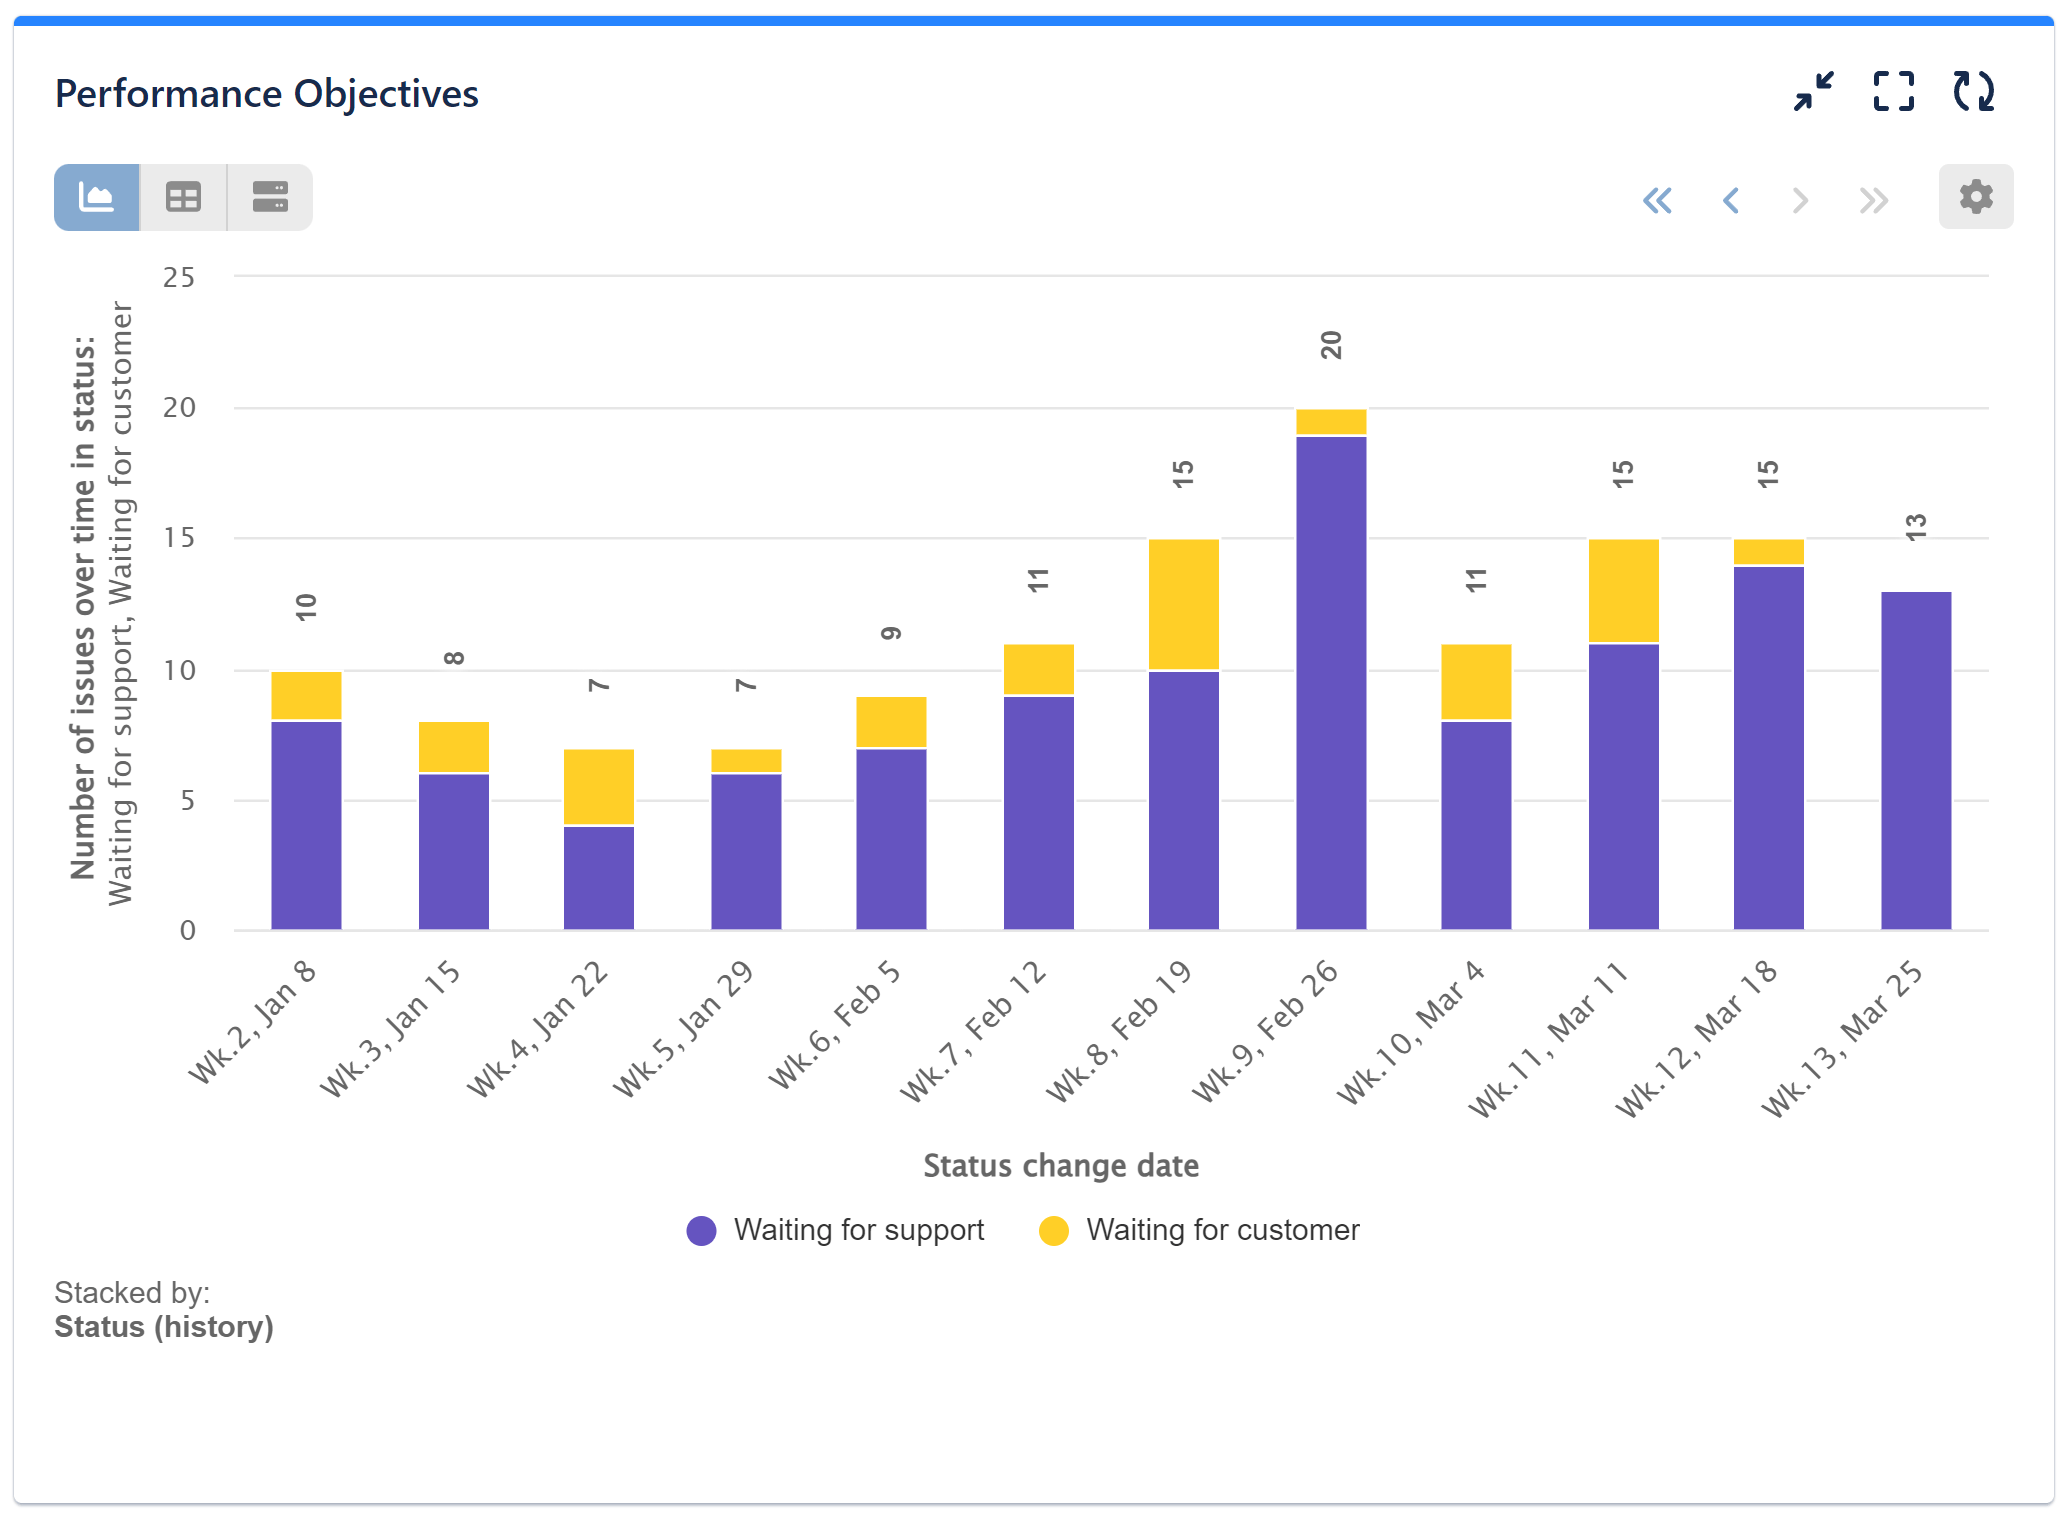
The bar chart is displaying Number of open issues over time in statuses “Waiting for support” and “Waiting for customer”. The granularity is by week for the first quarter of this year, and the counting mode is snapshot in time (only issues that were in the matching statuses at the end of every week are counted):
Explore and utilize the range of metrics available in the Performance Objectives app to identify and monitor trends and bottlenecks in your performance and keep your projects on track.
Start your 30 days free trial of Performance Objectives: Charts for Jira from Atlassian Marketplace.