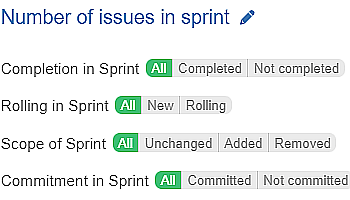
Introducing New Sprint-Related Filtering Options In addition to the wide range of Agile metrics and fields already built into the…
Introducing New Sprint-Related Filtering Options In addition to the wide range of Agile metrics and fields already built into the…
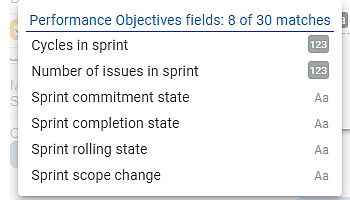
Drive productive sprint retrospectives with valuable reports using our new metrics and fields. Enhance team discussions with data-driven insights.
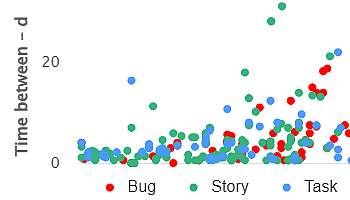
Powerful Data Insights: Harness the Potential of Scatter Charts The Scatter chart, also known as a scatter plot, is a…
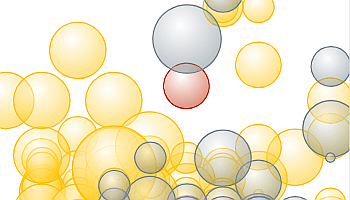
The Bubble chart is among the 12 available chart types within our app, enabling you to visualize tasks using up…
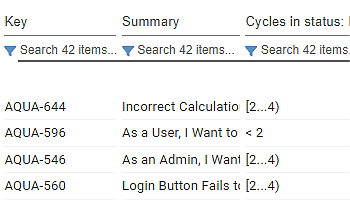
Maximizing Insights with the Issue List View in Scatter & Bubble Gadget The Performance Objectives app for Jira presents a…
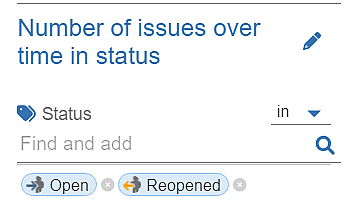
Display open issues over time in Jira Dashboard. Keep your ticketing process under control using ‘Number of Issues over time…
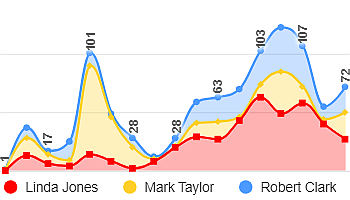
Use Performance Objectives gadgets to create Stacked Area or Stacked Bar charts. Compare data sets within one chart, analyze relationships, and assess relative proportions across categories or dimensions.
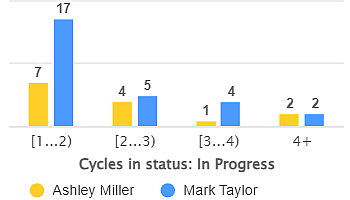
Use ‘Group by’ in Performance Objectives app to break down data by a second dimension, that can be any Jira field, metric, or custom segment.
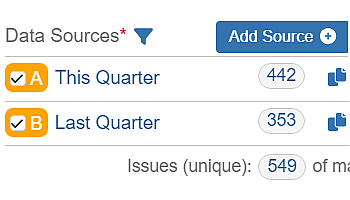
Use Multiple Data Sources for Enhanced Data Segmentation Performance Objectives: Charts for Jira app offers powerful capabilities to segment your…
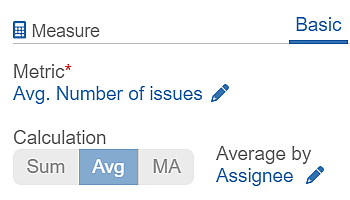
Performance Objectives: Charts for Jira offers three calculation types for metrics, providing unmatching flexibility for your Jira charts and reports.…