Table of Contents
Performance Objectives: Charts for Jira app offers a range of gadgets and chart types designed to meet data visualization and analytics needs across different Jira user groups, including software development teams, ITSM, business operations, and more.
Exploring the Features of the Flagship Performance Objectives Gadget
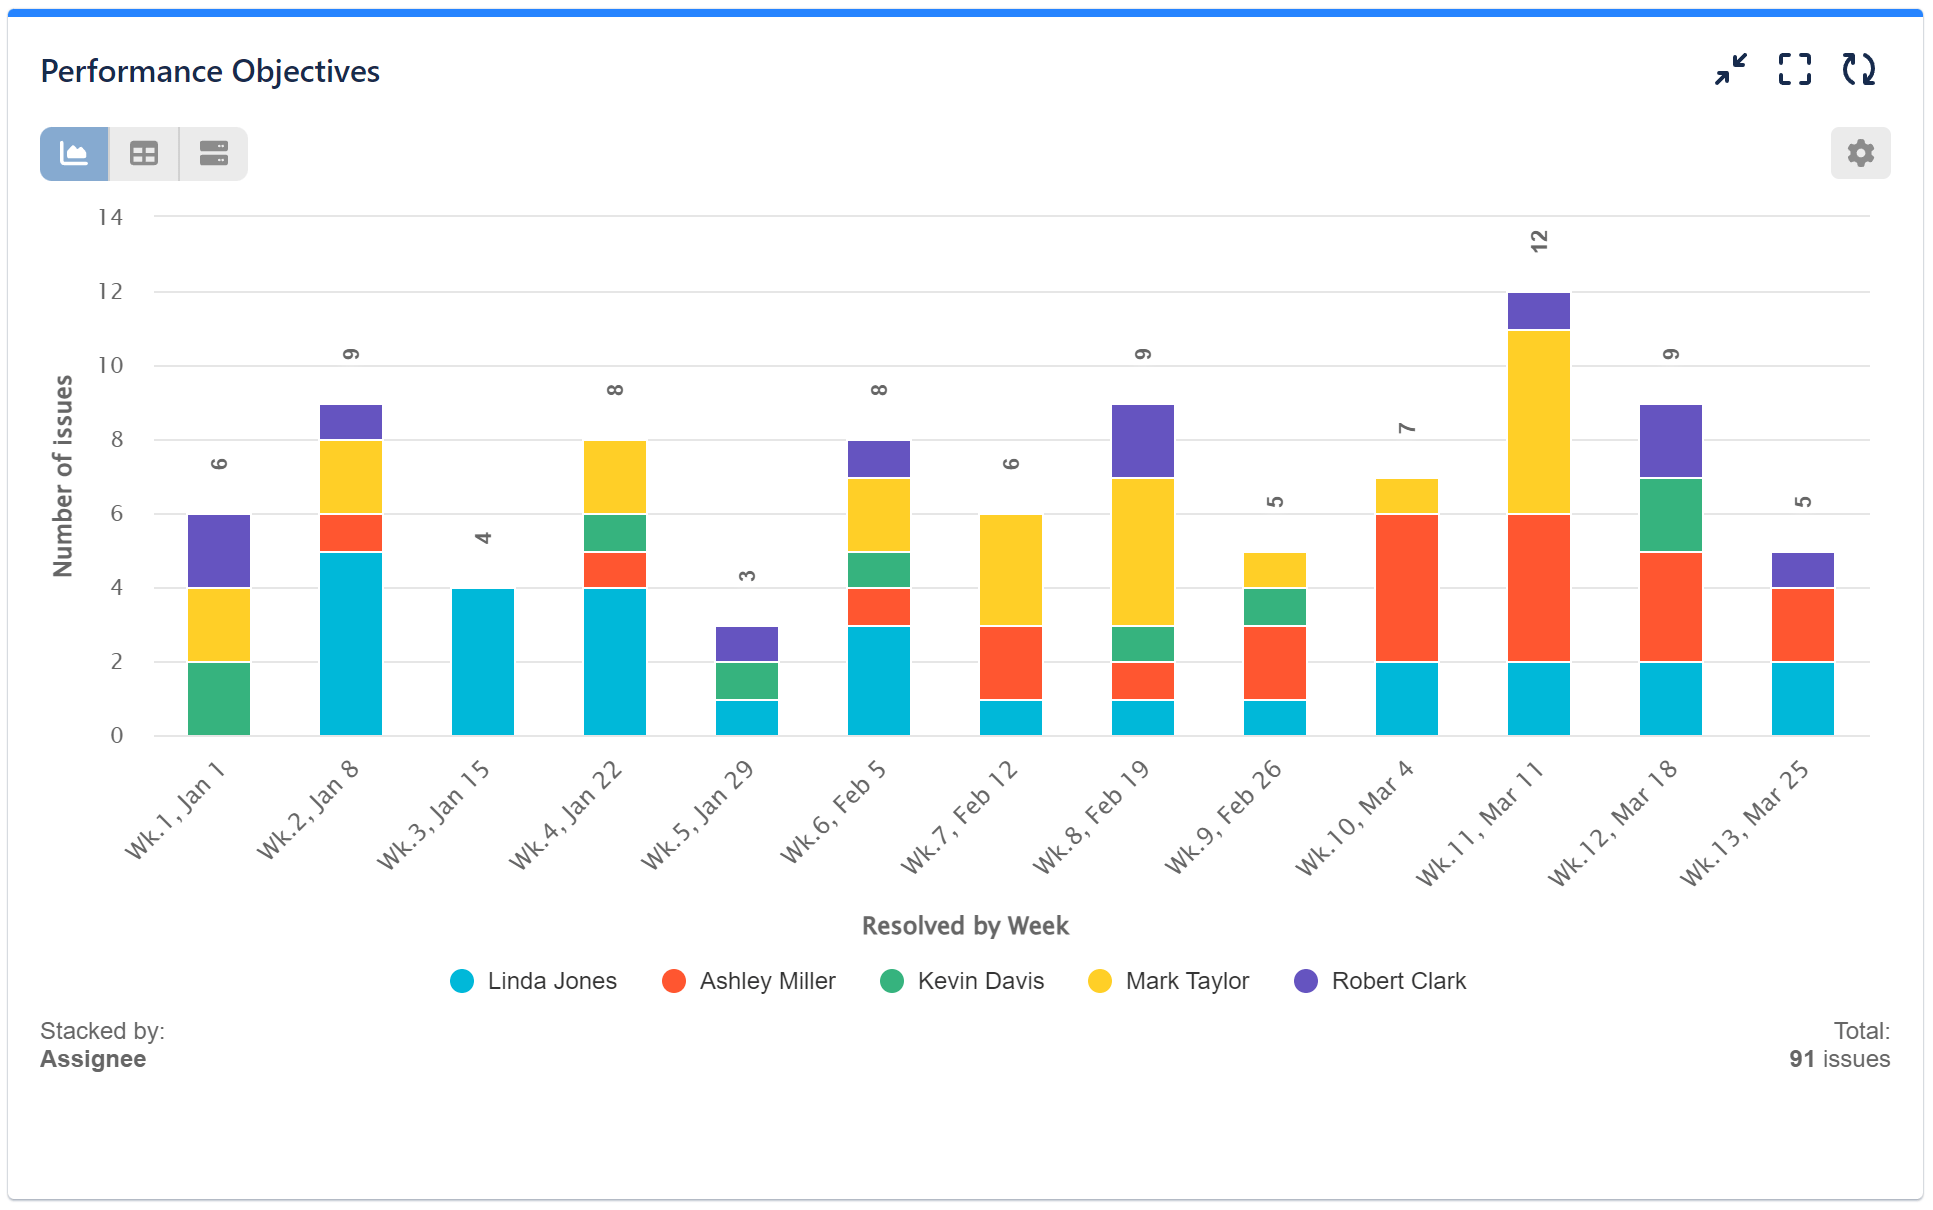
The flagship gadget of the app is Performance Objectives, an impressive dashboard gadget available for Jira Cloud, Server, and Data Center. With its robust features, this gadget serves as a powerful bar charting and reporting tool, catering to the needs of even the most demanding Jira users.
In this article we will explore some of the key features of the gadget.
Data Source Settings
Multiple Data sources
Date ranges
JQL for data segmentation
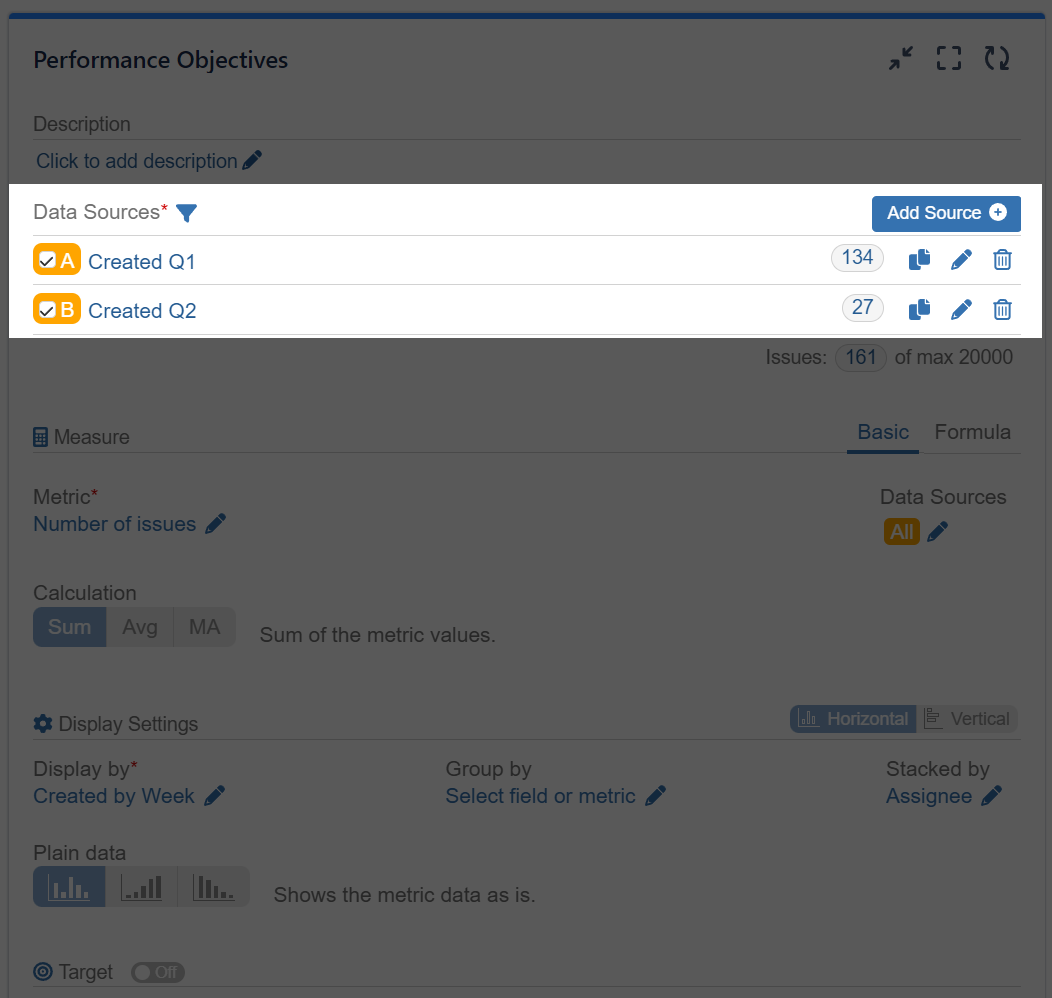
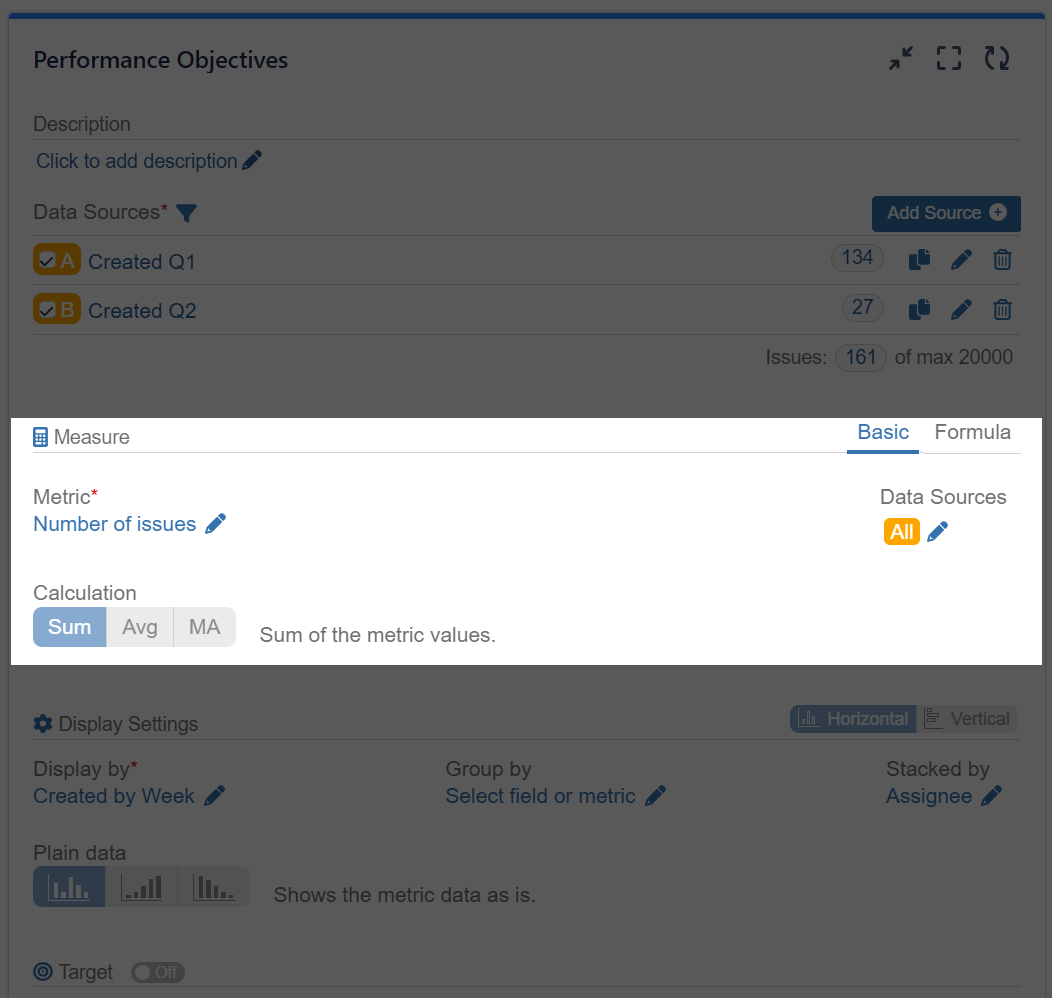
Multiple Data Sources:
- Ability to add multiple data sources.
- Combining multiple data sources and using data sources for the display options allows PoP analysis.
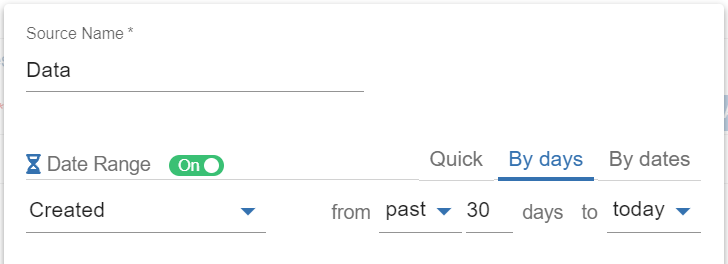
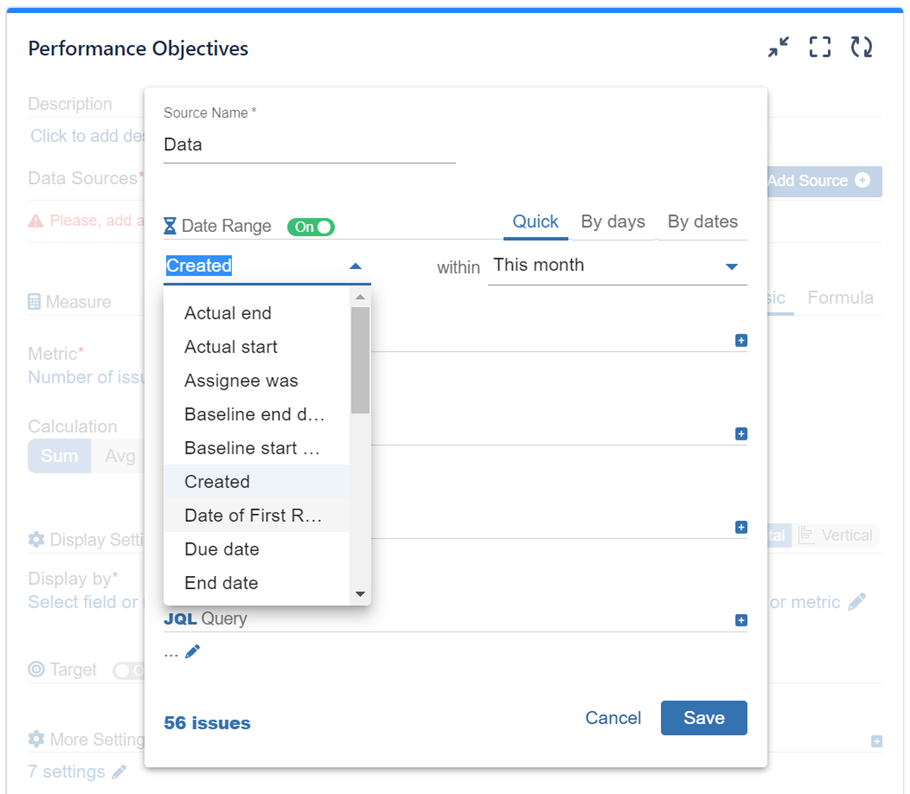
Multiple Date Ranges:
- In the Quick date range, you have the convenience of selecting from a variety of pre-defined periods such as this/last week, this/last month, quarters, the first or second half of this or last year, and more. These options are easy to use and provide quick access to common date ranges.
- If you require more precise date boundaries, you can use the “By days” or “By dates” options. With these choices, you have the flexibility to set up exact start and end dates for your data, allowing for more specific and tailored analysis.
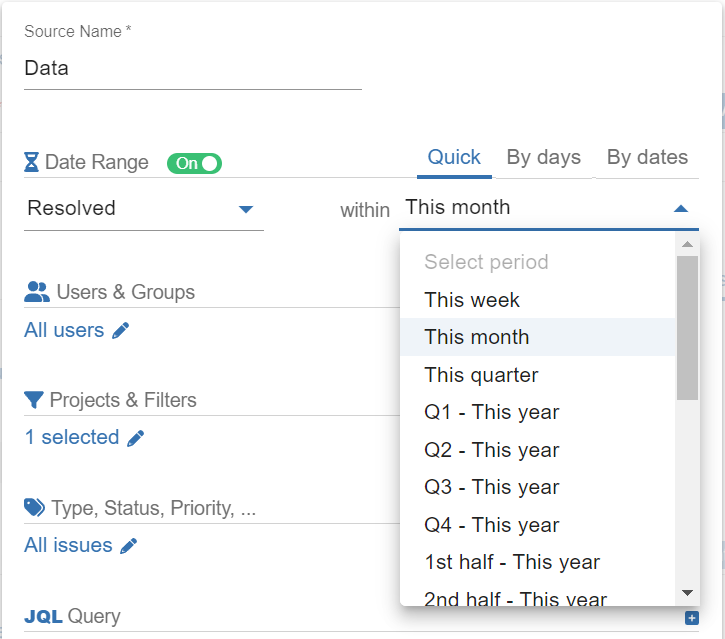
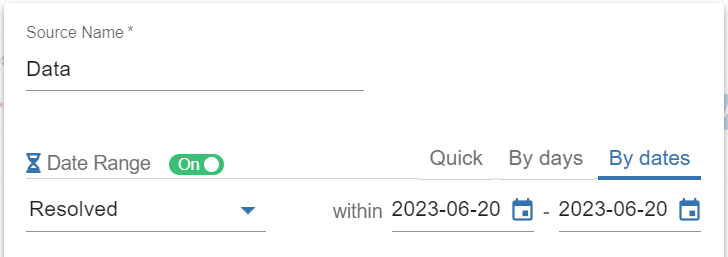
Date Filtering Options
Over 20 quick filters available, including:
- Resolved
- Status/Assignee was
- Work logged
- many more
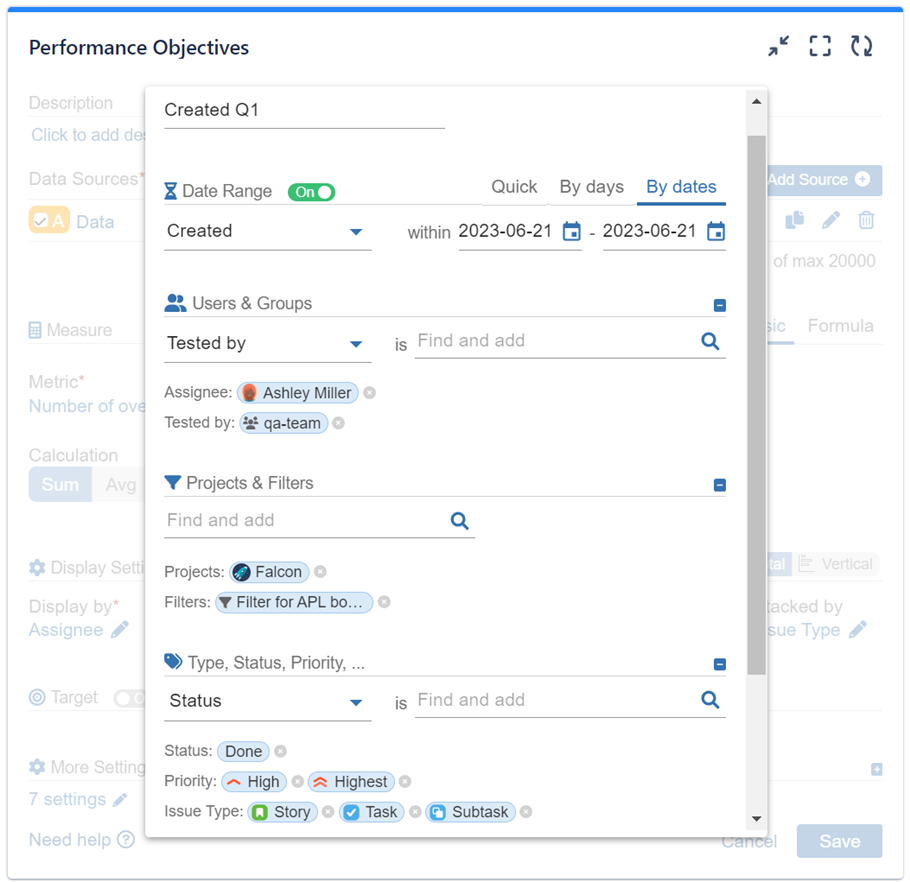
Data Segmentation
JQL data segmentation, segmentation by users, groups, project, issue type, priority, label, resolution. You can also use your saved project filters as Data Source.
Measure Settings
Dynamic Metrics
‘Time in status’
‘Cycles in status’
‘Time in assignee’
‘Cycles in assignee’
‘Time between dates’
‘Number of Issues over time in Status’
The Performance Objectives dashboard gadget offers a wide range of Standard Jira and Dynamic metrics to suit your specific needs. You have the flexibility to choose from various options such as ‘Time/Cycles in Status’ or ‘Number of Issues Over Time in Assignee’, ‘Number of Flagged Issues’, Comments, Votes, and ‘Work Logged Time (h)’.
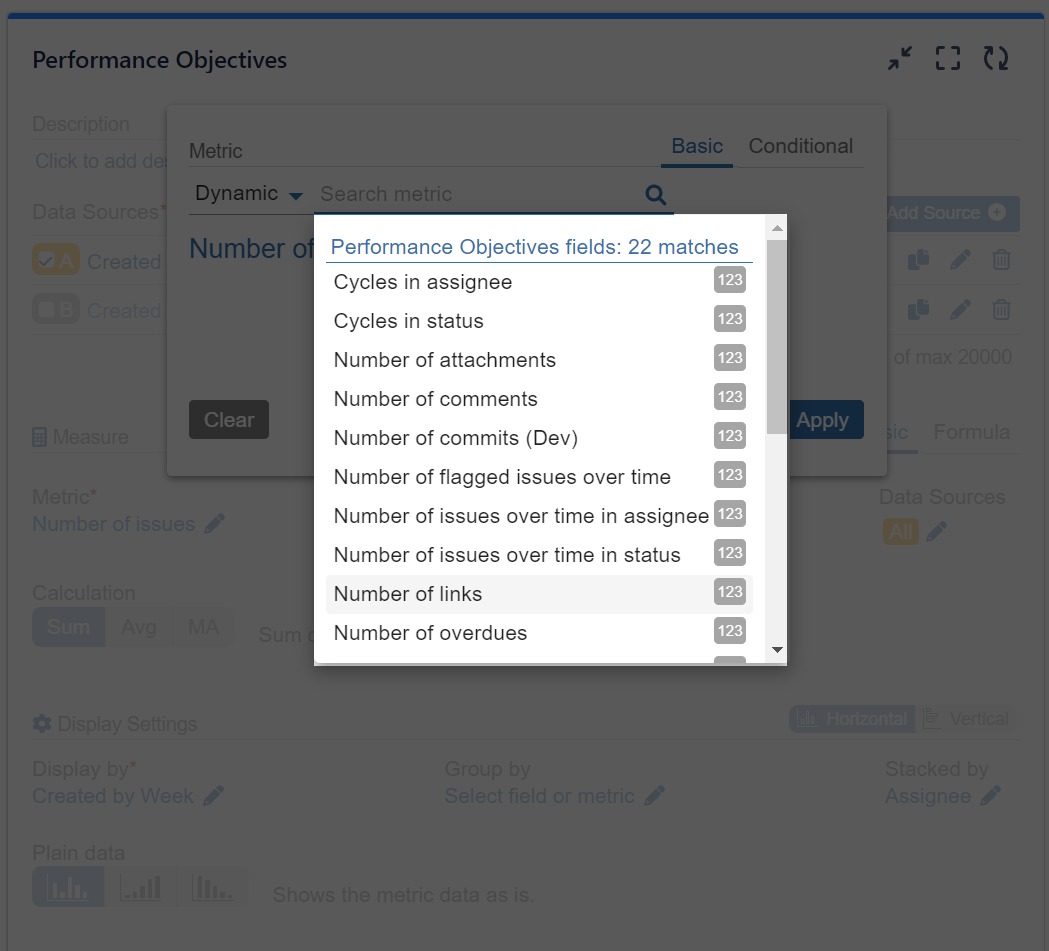
These metrics are just a glimpse of the 22 Dynamic metrics available with the gadget, which in turn unlock additional over 30 dynamic fields like Status or Assignee (history), First Date in Status, Assignee Change Date, and many more that can be found in the display settings, enhancing your analysis capabilities.
The Dynamic group of metrics can be found in the basic option of the metrics settings, along with six other groups, including Time, Number, System, Custom, JSM, and ALL metrics.
The conditional metrics feature enables you to set conditional expressions and metric aliases, allowing you to further filter issues and customize the displayed results.
With formula metrics, you can combine multiple metrics using mathematical equations. This allows you to create more complex calculations and derive meaningful insights by combining different metrics in your reports.
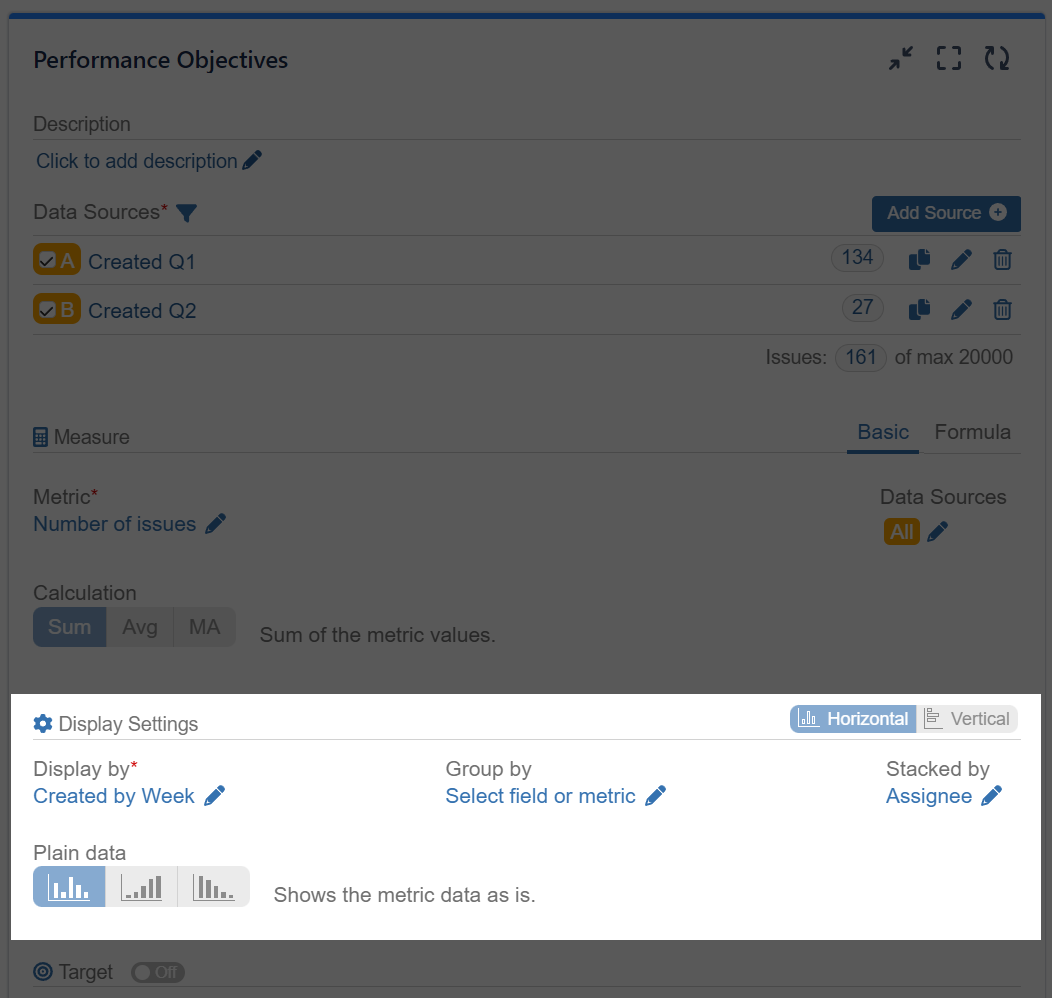
Additionally, you have the option to choose the type of calculation, including sum, average, or moving average.
Display Settings
Display by
Group by
Stack by
With Performance Objectives dashboard gadget you can choose between a horizontal or vertical view to optimize the presentation of your charts.
There are three data view options available: display by, group by, and stack by. With these options, you can select how the issues are displayed and organized based on existing fields and metrics or data from multiple data sources.
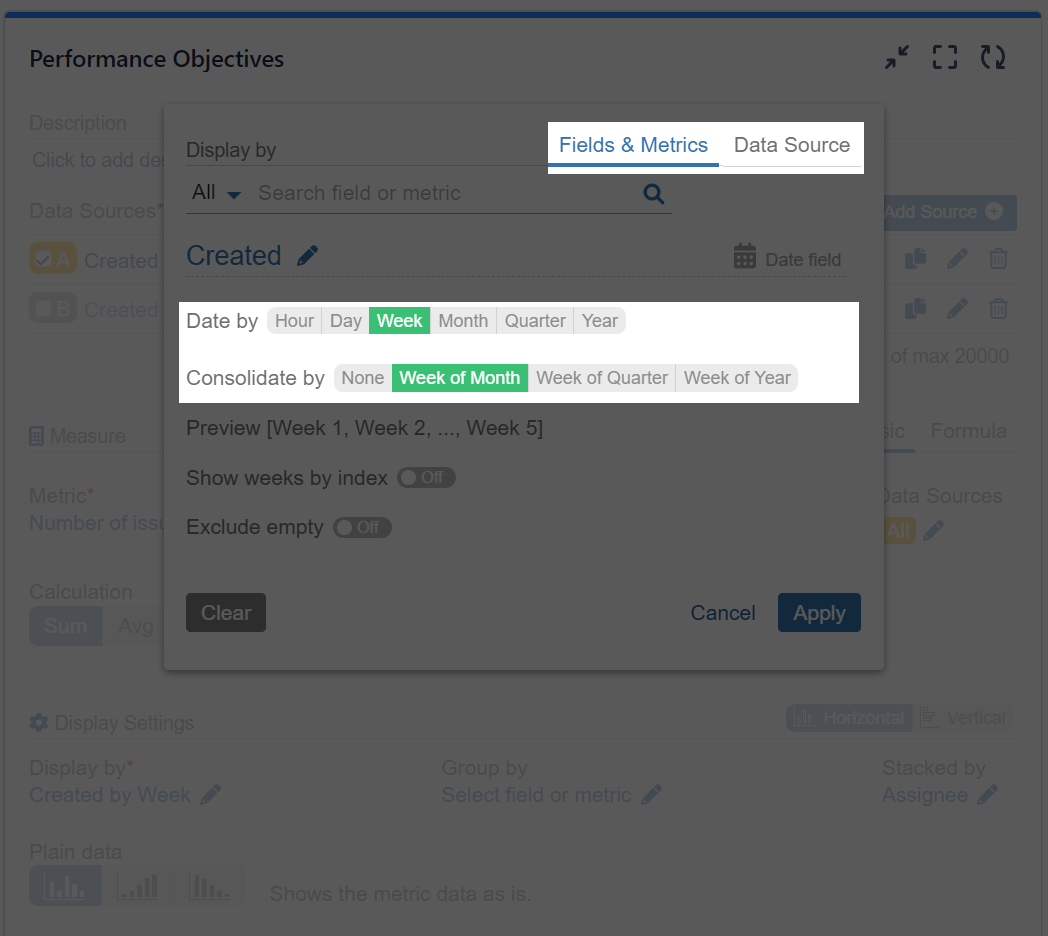
Furthermore, there are multiple options for Date by and Consolidate by settings, allowing you to configure how date fields are represented in the chart. You also have an Exclude empty option for text, date, and user fields.
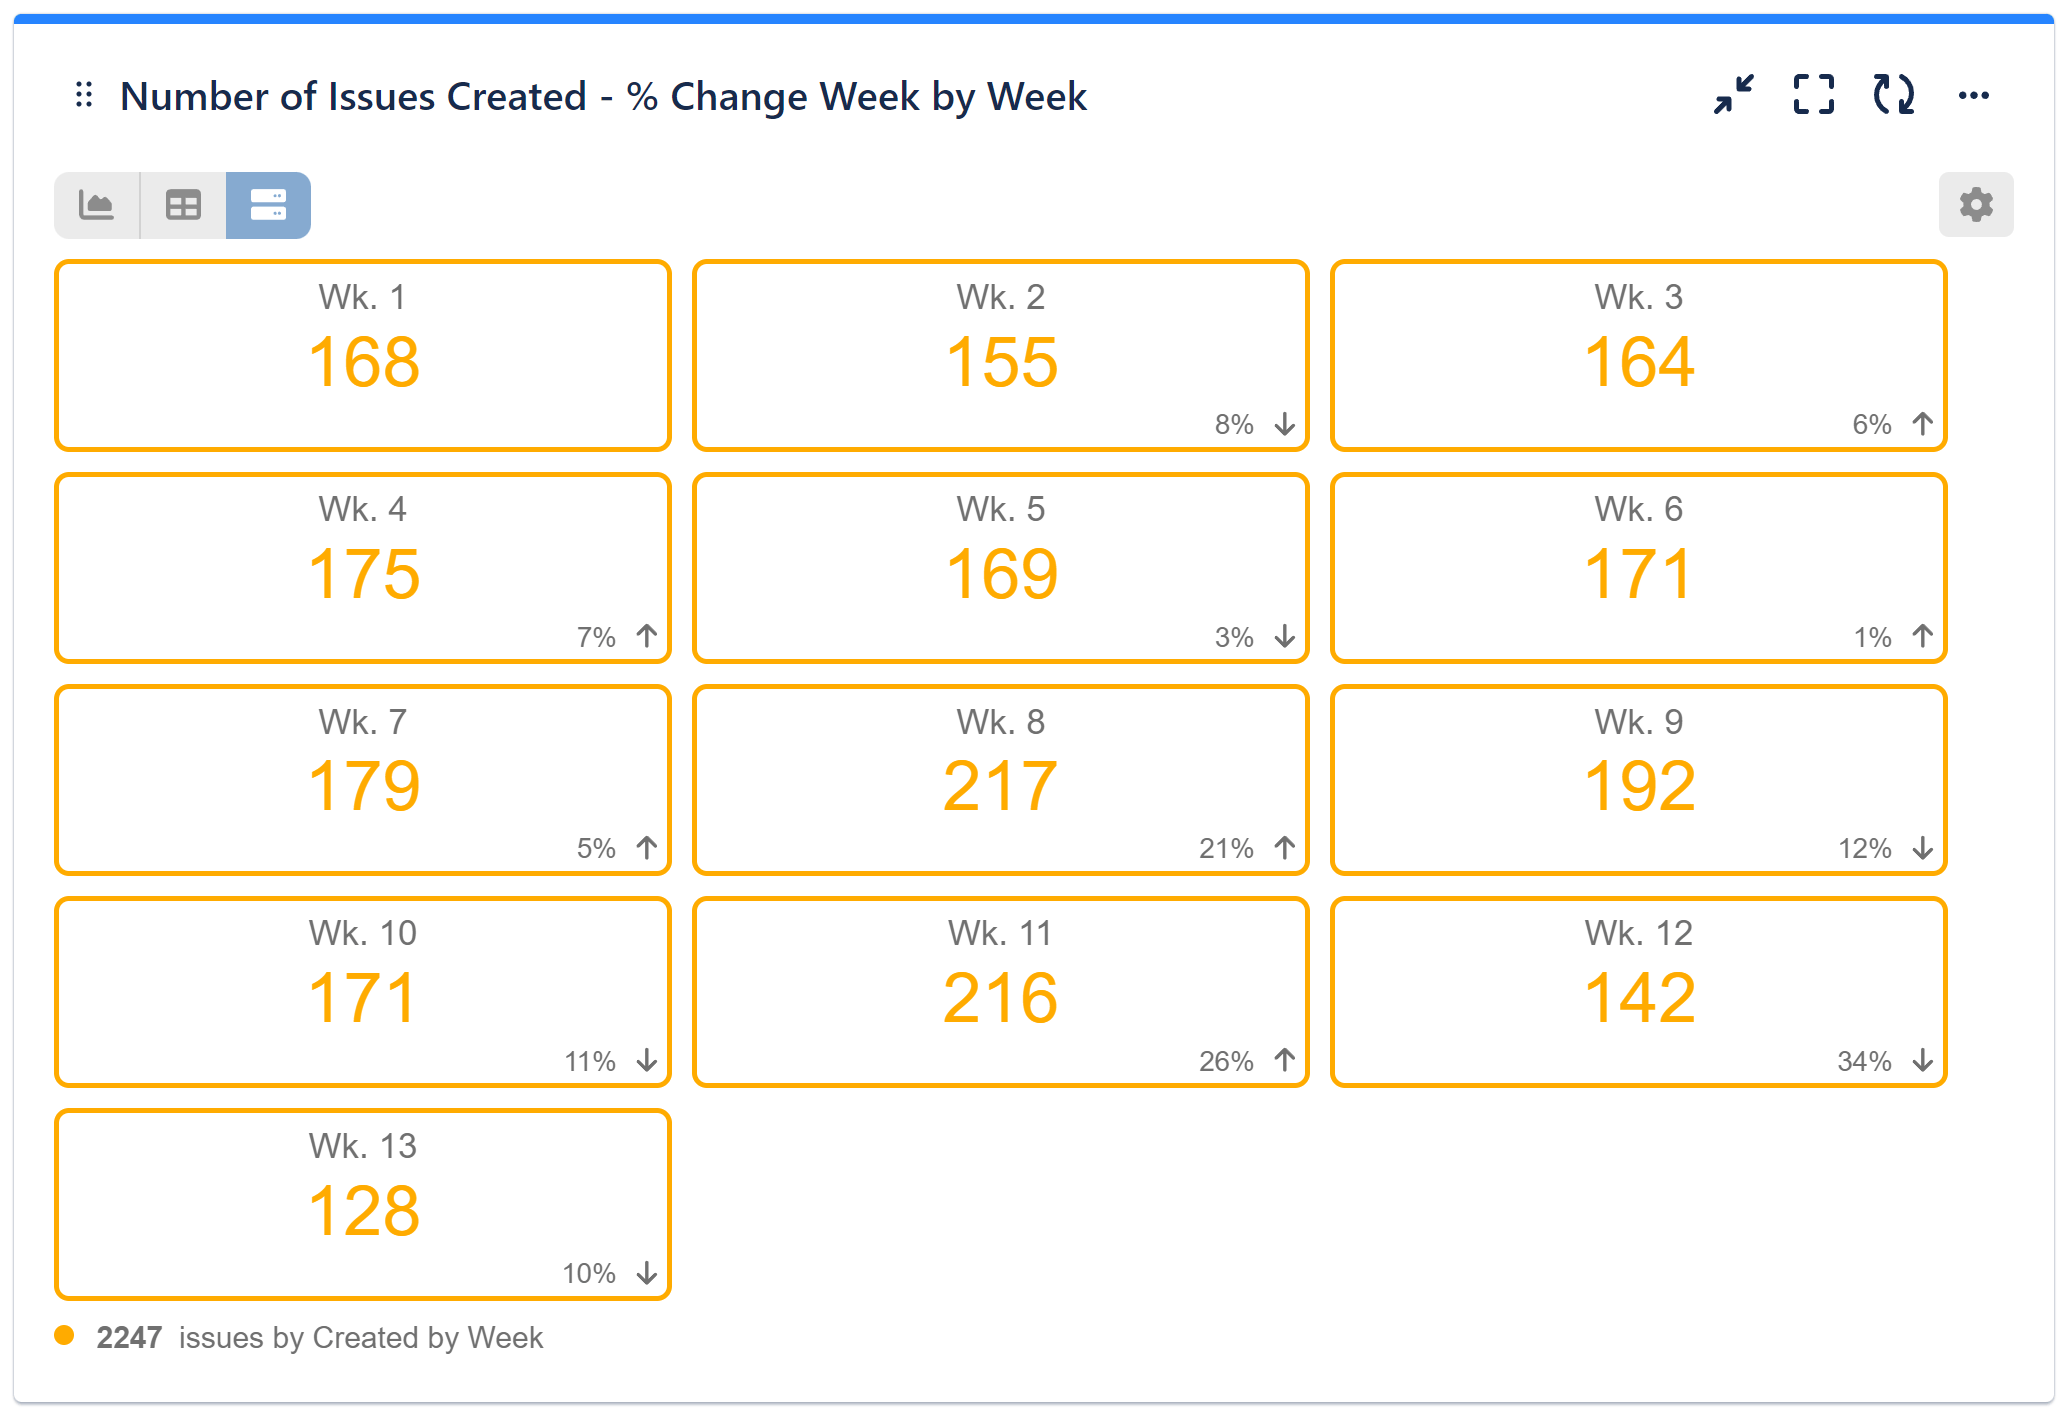
Opting for Tiles View of the Performance Objectives gadget to visualize your Jira data unlocks additional insights. Within this view, any date-type fields designated for “Display by” (or serving as the x-axis of your chart) automatically integrate a percent change indicator. This indicator calculates changes relative to the previous date segment displayed on your chart, providing valuable context for your analysis.
Metric Distribution Slots feature is available for all custom and standard metrics allowing you to set custom slot splitters to break metric data by user-defined ranges.
Lastly, you have the choice to view your data in Plain, Cumulative, or Declining mode, providing different perspectives on the performance trends and patterns.
Target Settings
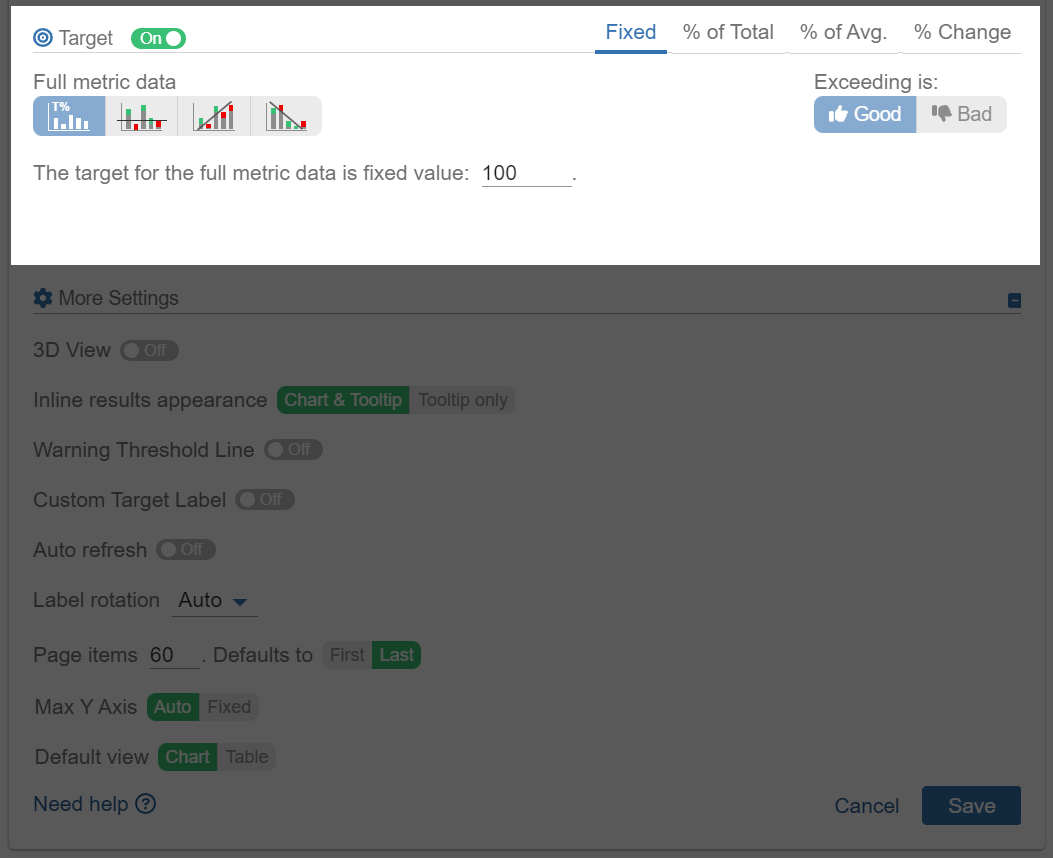
set TARGETS to support your OKR strategy & performance goals
With Performance Objectives dashboard gadget you can set and align targets with your specific goals and objectives.
You can choose from the Fixed value target option, where you specify a specific value as the target. Alternatively, you can set the target as a Percentage of total, Percentage of Average, or Percentage change, providing flexibility in defining targets relative to the data.
Additionally, you have the ability to customize whether exceeding the defined target is considered Good or Bad.
More Settings
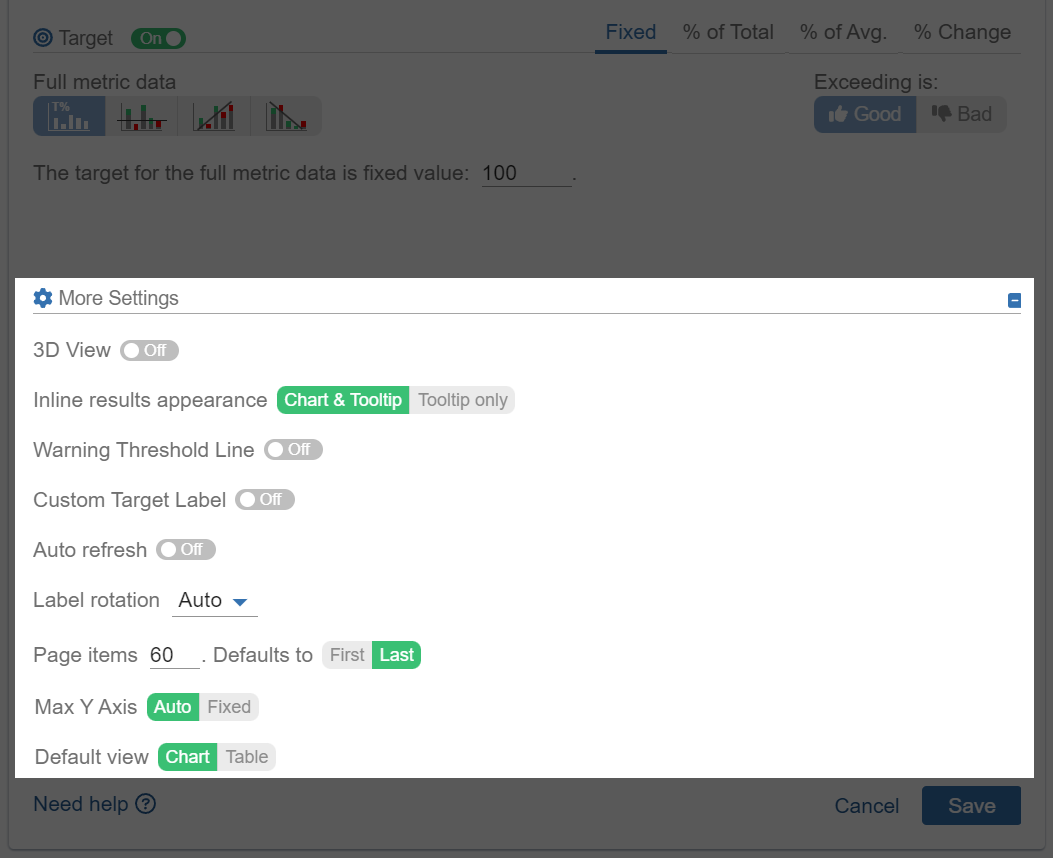
More Settings for deeper customization
Under the “More settings” section, you have additional customization options available to tailor your charts and reports in Performance Objectives dashboard gadget.
Enable a 3D view, display additional information within the chart itself when hovering over specific data points with tooltip settings, add Custom target labels and threshold line, use label rotation to improve readability, or set maximum value on the y-axis.
Learn more


Start your 30 days free trial of Performance Objectives: Charts for Jira from Atlassian Marketplace.