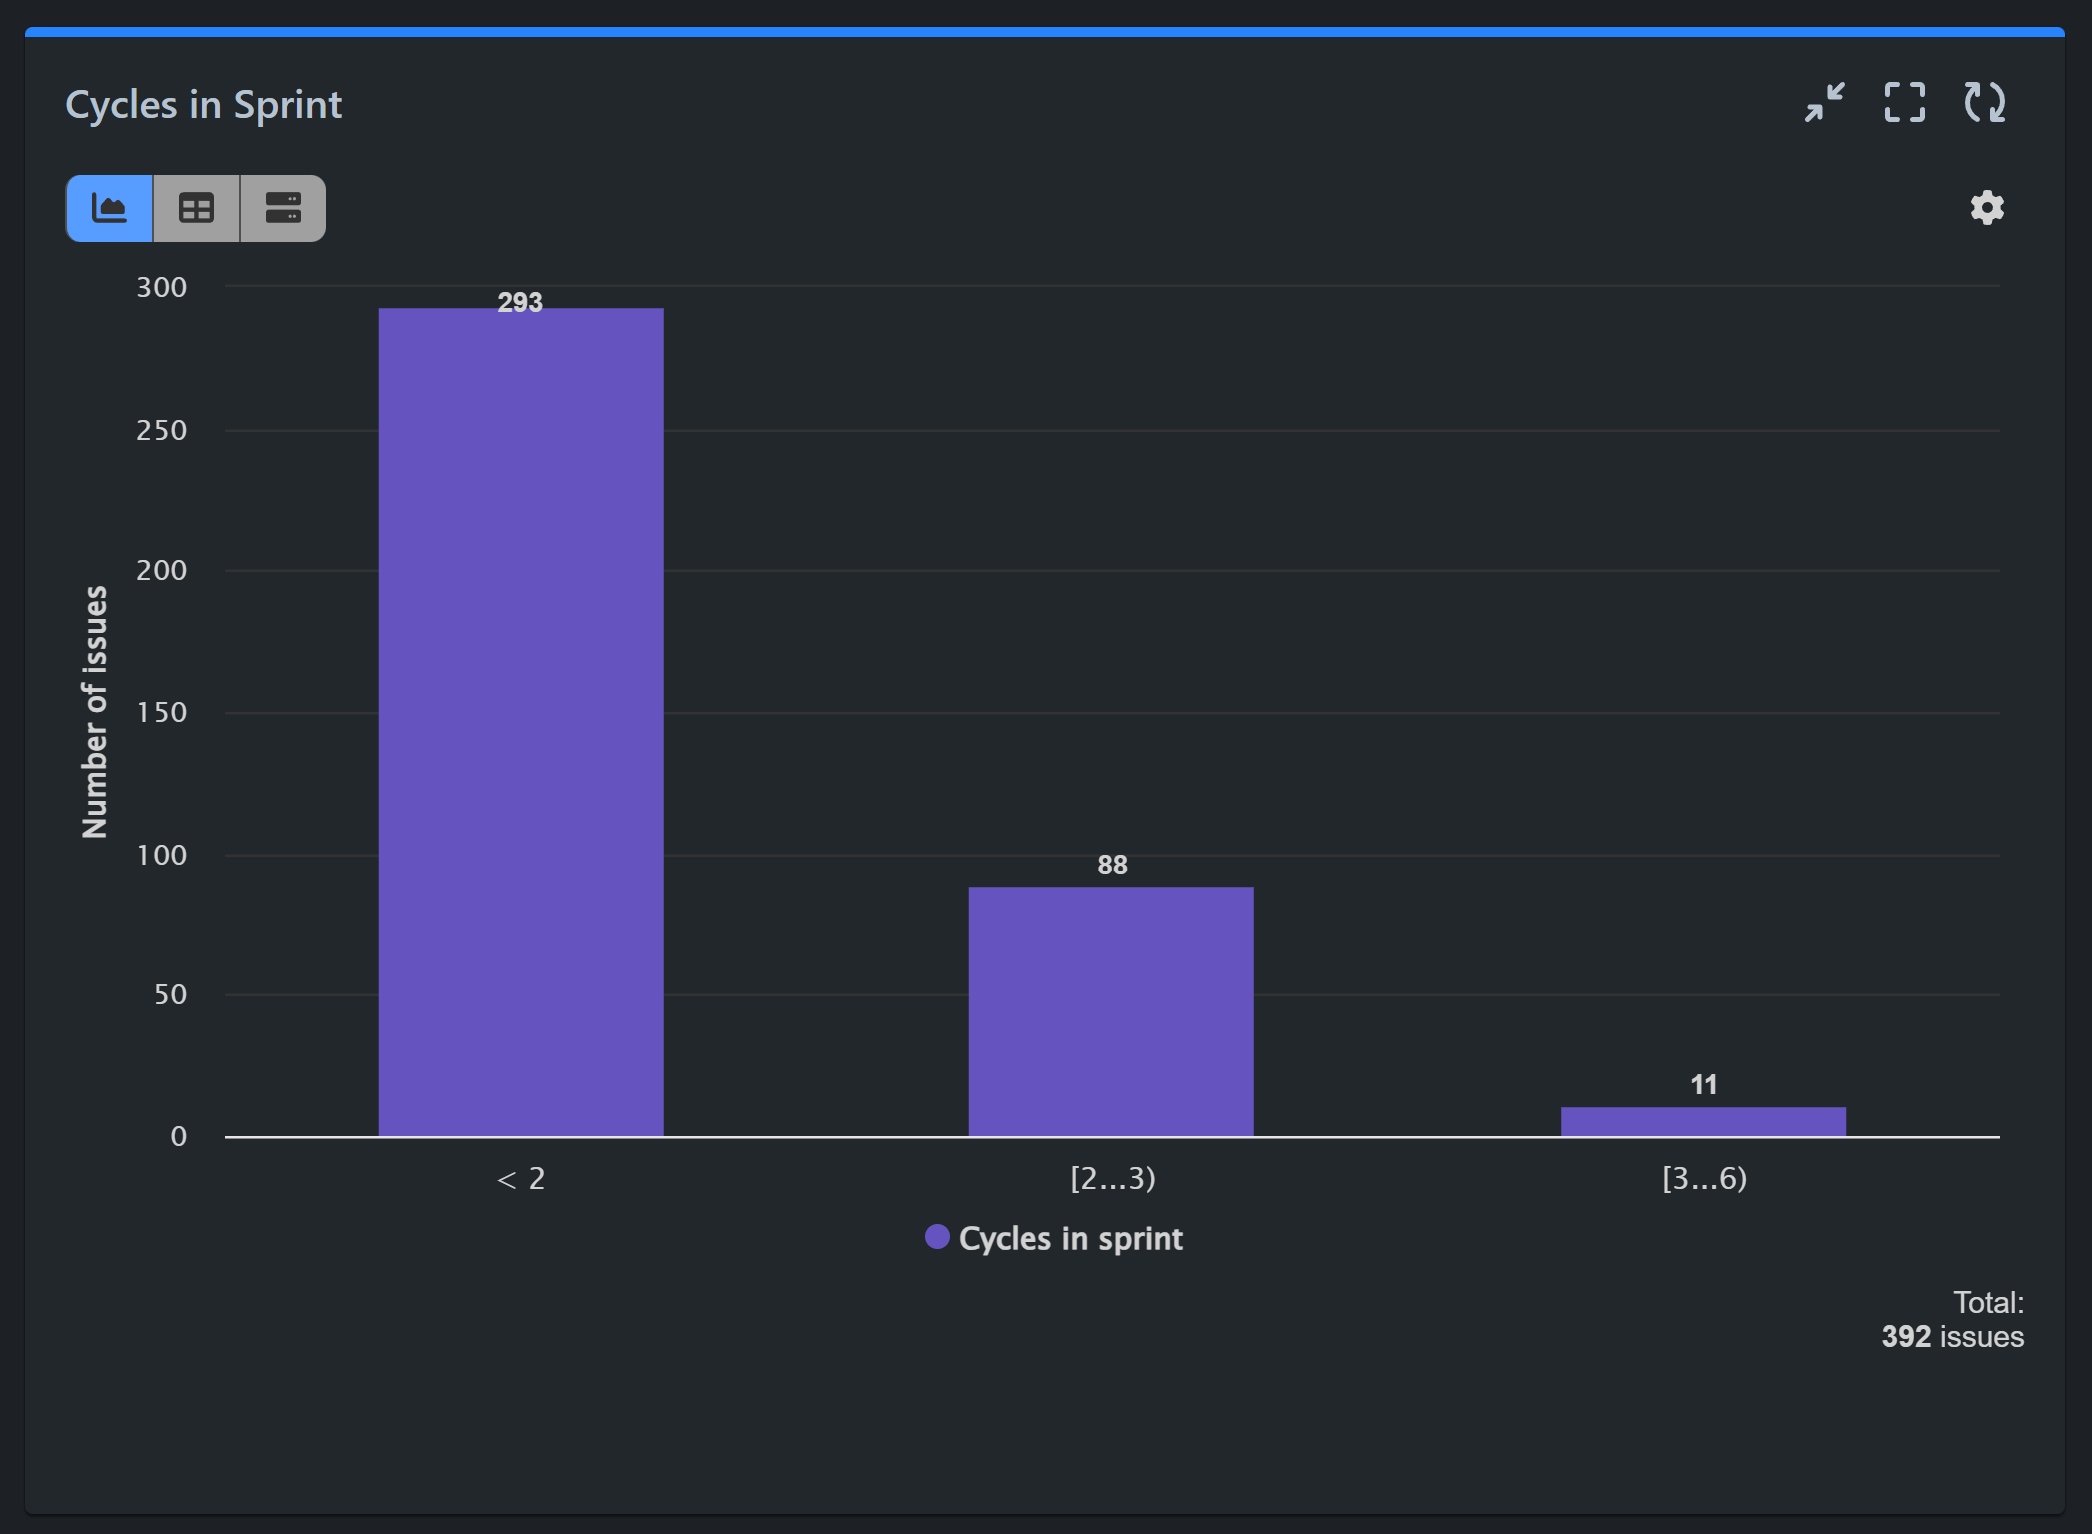
The ‘Cycles in Sprint’ metric, supported by the Performance Objectives app for Jira provides valuable insights into how many times stories moved from one sprint to another sprint, indicating the frequency of movement between different sprints rather than the change of statuses within the workflow of a single sprint. Let’s explore a sample report utilizing this metric and understand its benefits.
Maximizing Agile Efficiency with a Cycles in Sprint Report in Jira
When stories roll from sprint to sprint more than a certain number of times, it’s imperative for the team to conduct a thorough investigation into the root causes, address underlying issues, and implement corrective actions to enhance workflow efficiency and delivery predictability. Constant rollouts may signify unclear requirements or scope, inaccurate estimations, frequent blockers, delays in approvals, or inadequate collaboration among team members. This could also be a sign of poor prioritization: stories may continue rolling over if the team doesn’t prioritize effectively, resulting in lower-priority tasks being repeatedly postponed.
By reducing the number of cycles, or the times stories roll from sprint to sprint, teams can improve workflow efficiency, facilitate better communication, and support continuous improvement efforts. The Performance Objectives app allows you to create a Cycles in Sprint report in Jira in a few easy steps. This report enhances visibility and accountability, enabling teams to monitor progress and set improvement goals effectively.

In our sample chart, we observe that 11 issues moved from sprint to sprint more than three times. These are the issues we want to focus on to understand the reasons behind this repeated sprint rollover.
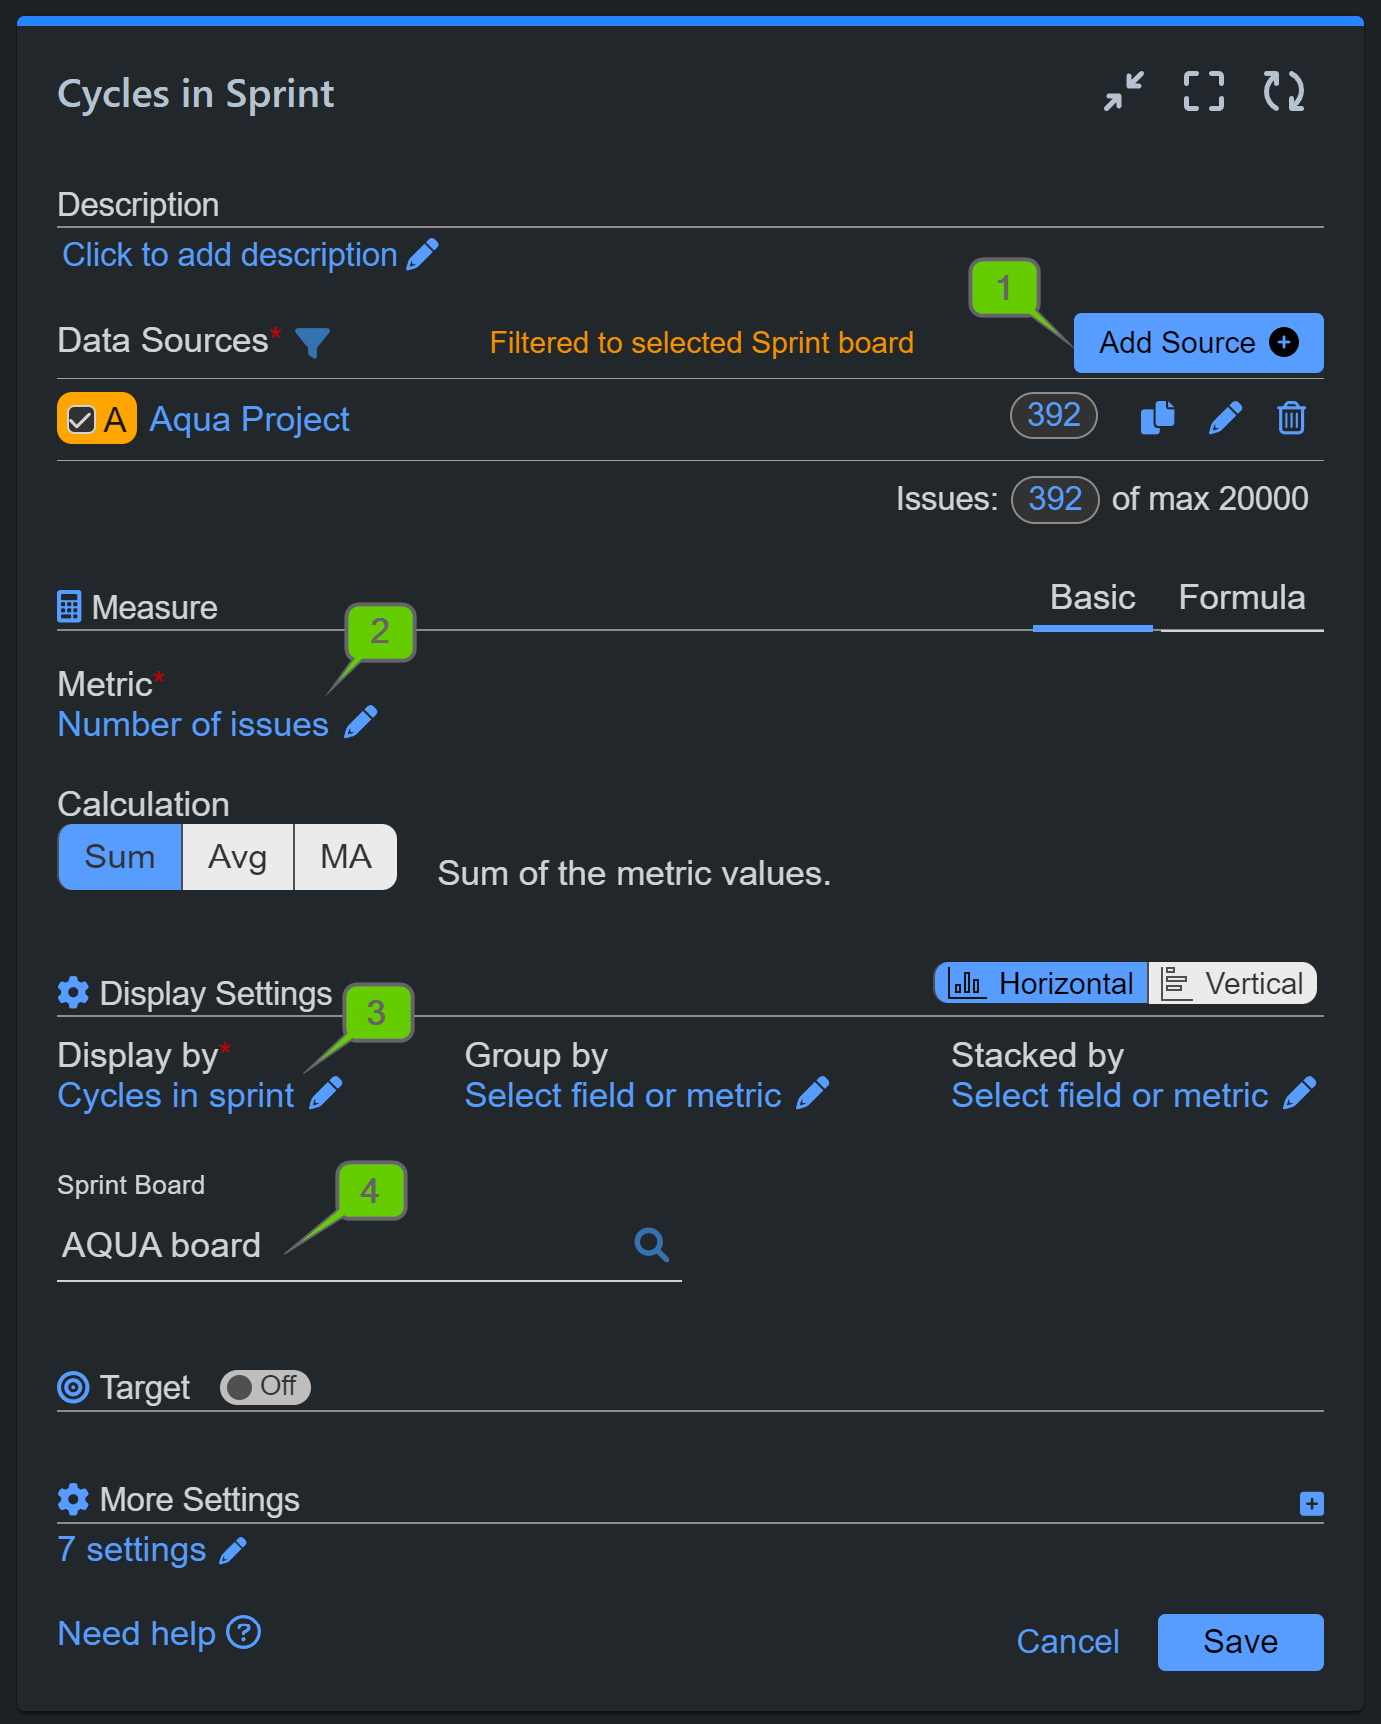
Here are the steps for configuring this report:

Step 1: Add a Data Source. In our example, we’ve filtered our demo project “AQUA” and disabled the date range to view all previous sprints.
Step 2: Opt for the default ‘Number of issues’ metric.
Step 3: Choose ‘Cycles in Sprint’ for the ‘Display by’ field and define your own slot splitters. In our example, we want to count issues that had less than 2 cycles, more than 3, and more than 6.
Step 4: Select a sprint board you want to analyze.
Step 5: Optionally, you can stack by any relevant field for better insights.
Here’s a step-by-step configuration video for this report:
Check out this overview of sprint-related metrics, fields, and reports built with the Performance Objectives app. Learn more about our new filtering options and metrics, or browse all the powerful features supported by the app in our User Guide.
Start your 30 days free trial of Performance Objectives: Charts for Jira from Atlassian Marketplace.