‘Time between’ is one of the dynamic metrics supported by the Performance Objectives: Charts for Jira app. It empowers users to gain valuable insights from their Jira data by tracking the time difference between any two date fields.
By calculating the time taken between essential workflow events, teams can assess their process efficiency. For example, they can measure the time between issue creation and transitioning to being actively worked on, or the time it takes for an issue to move from the ‘Review started’ status to ‘Resolved’.
Analyzing time intervals with this metric also aids in identifying bottlenecks in workflows. If certain stages take significantly longer than others, it may indicate areas that require improvement. This metric can be utilized to enhance planning and resource allocation.
Let’s explore some use cases of the ‘Time between’ metric with different date fields.
Average Time Between Issue Creation and First Day in Status ‘In Progress’
Measure how long it takes on average for an issue to transition from its initial creation to entering the ‘In Progress’ status. Understanding this time interval provides valuable insights into the efficiency of task initiation and workflow management within the project.
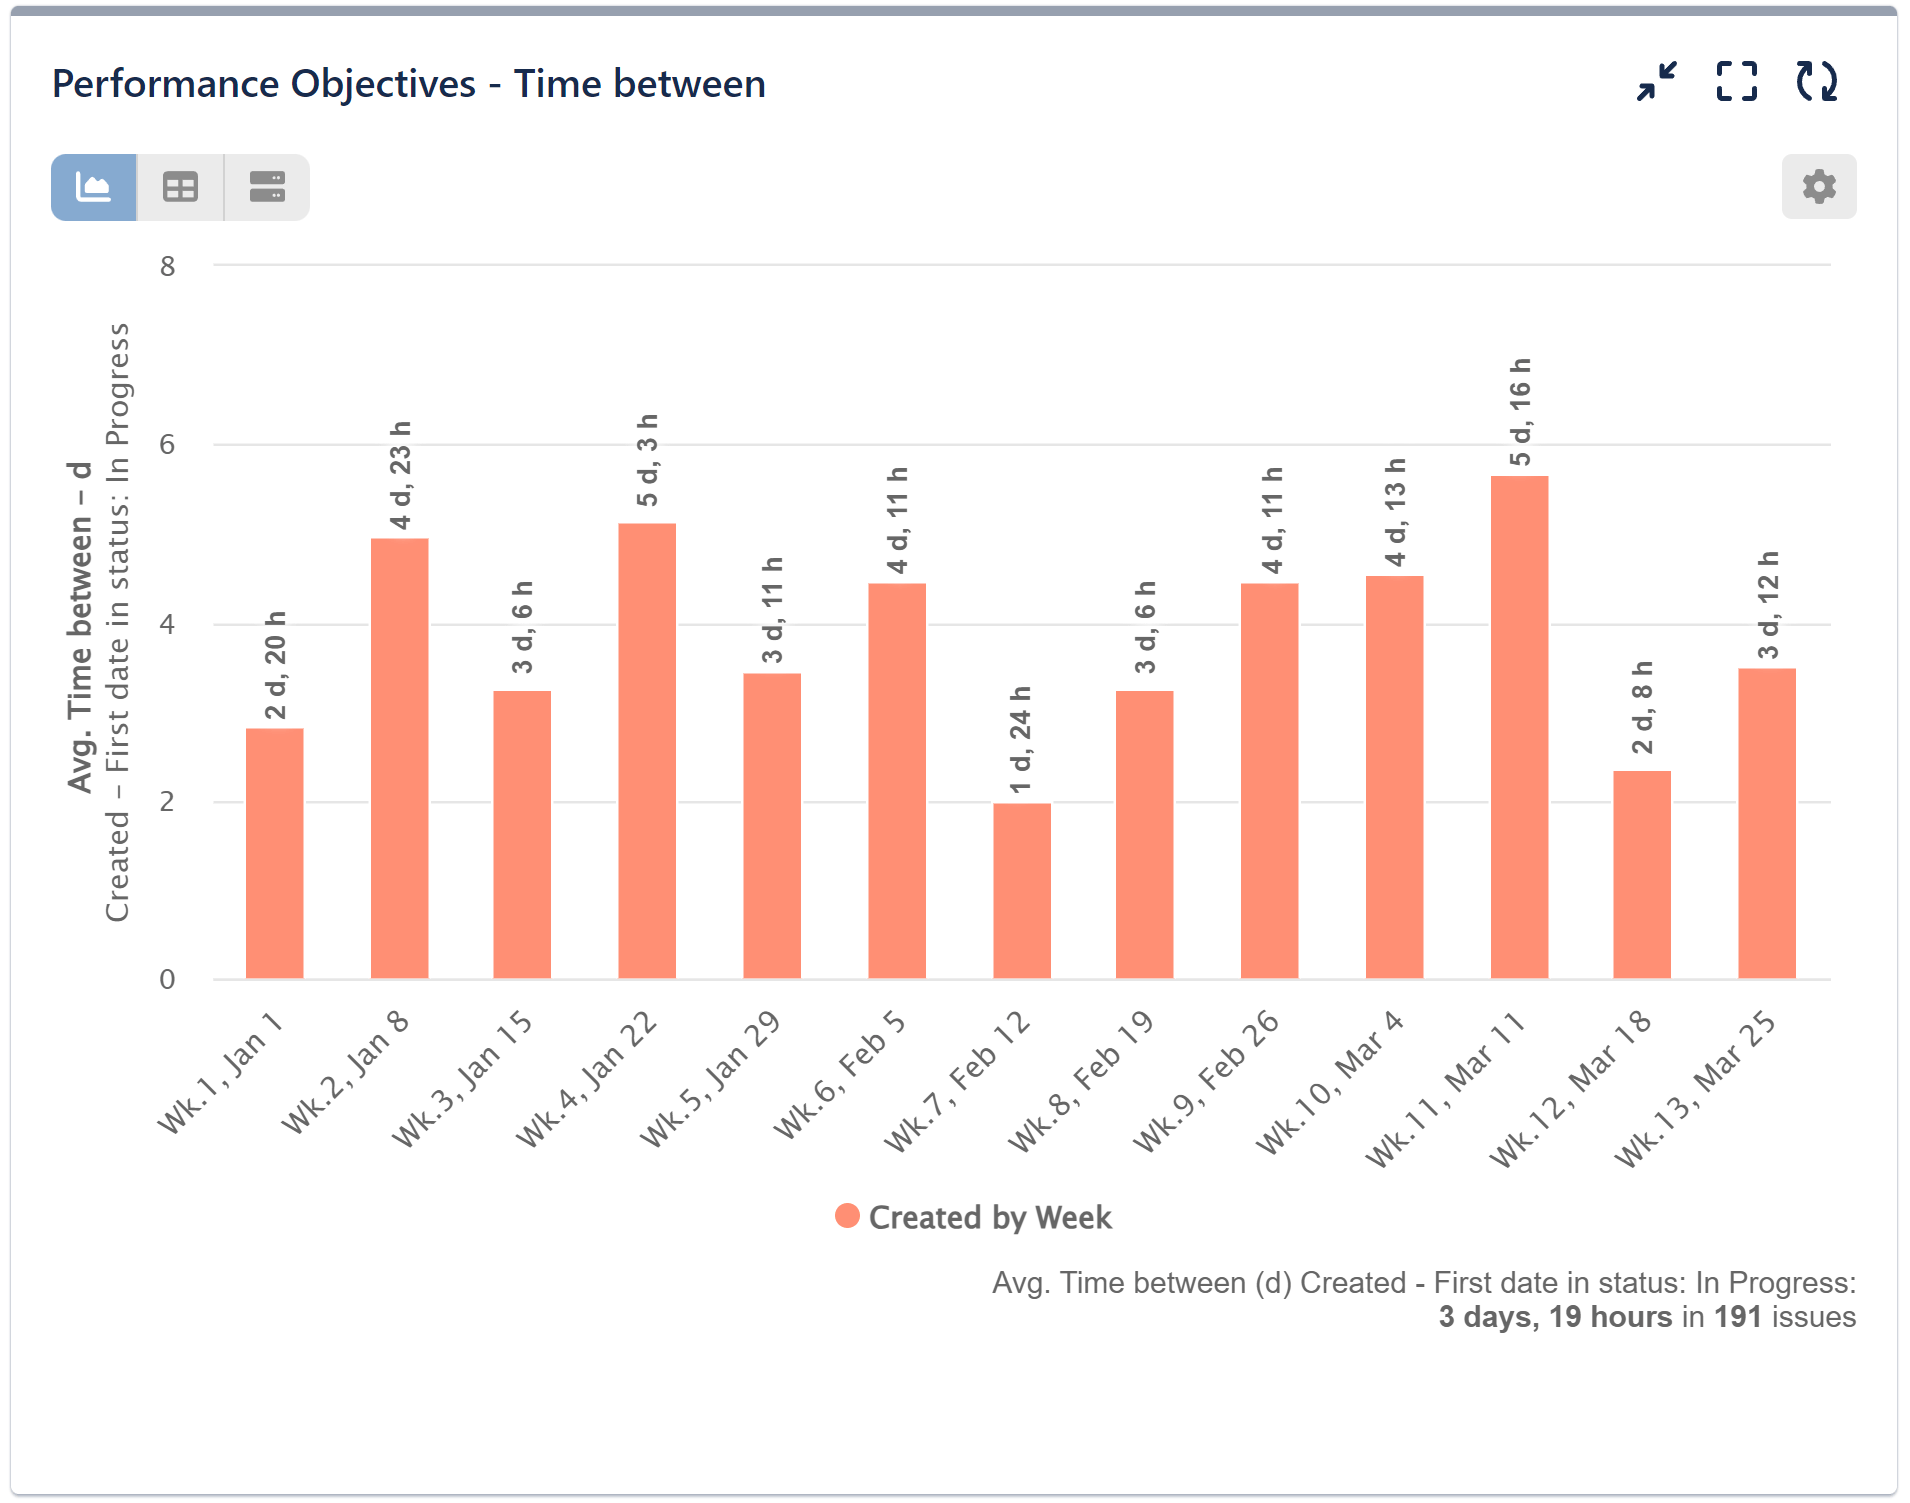
Check the configuration screen with ‘Time between’ metric selection options and date fields Created and First date in status. Keep in mind that you have the flexibility to choose any existing date field for this metric, allowing for versatile analysis and insights into your Jira data.
For a comprehensive list of date fields supported by the app, please refer to Configuration Overview.
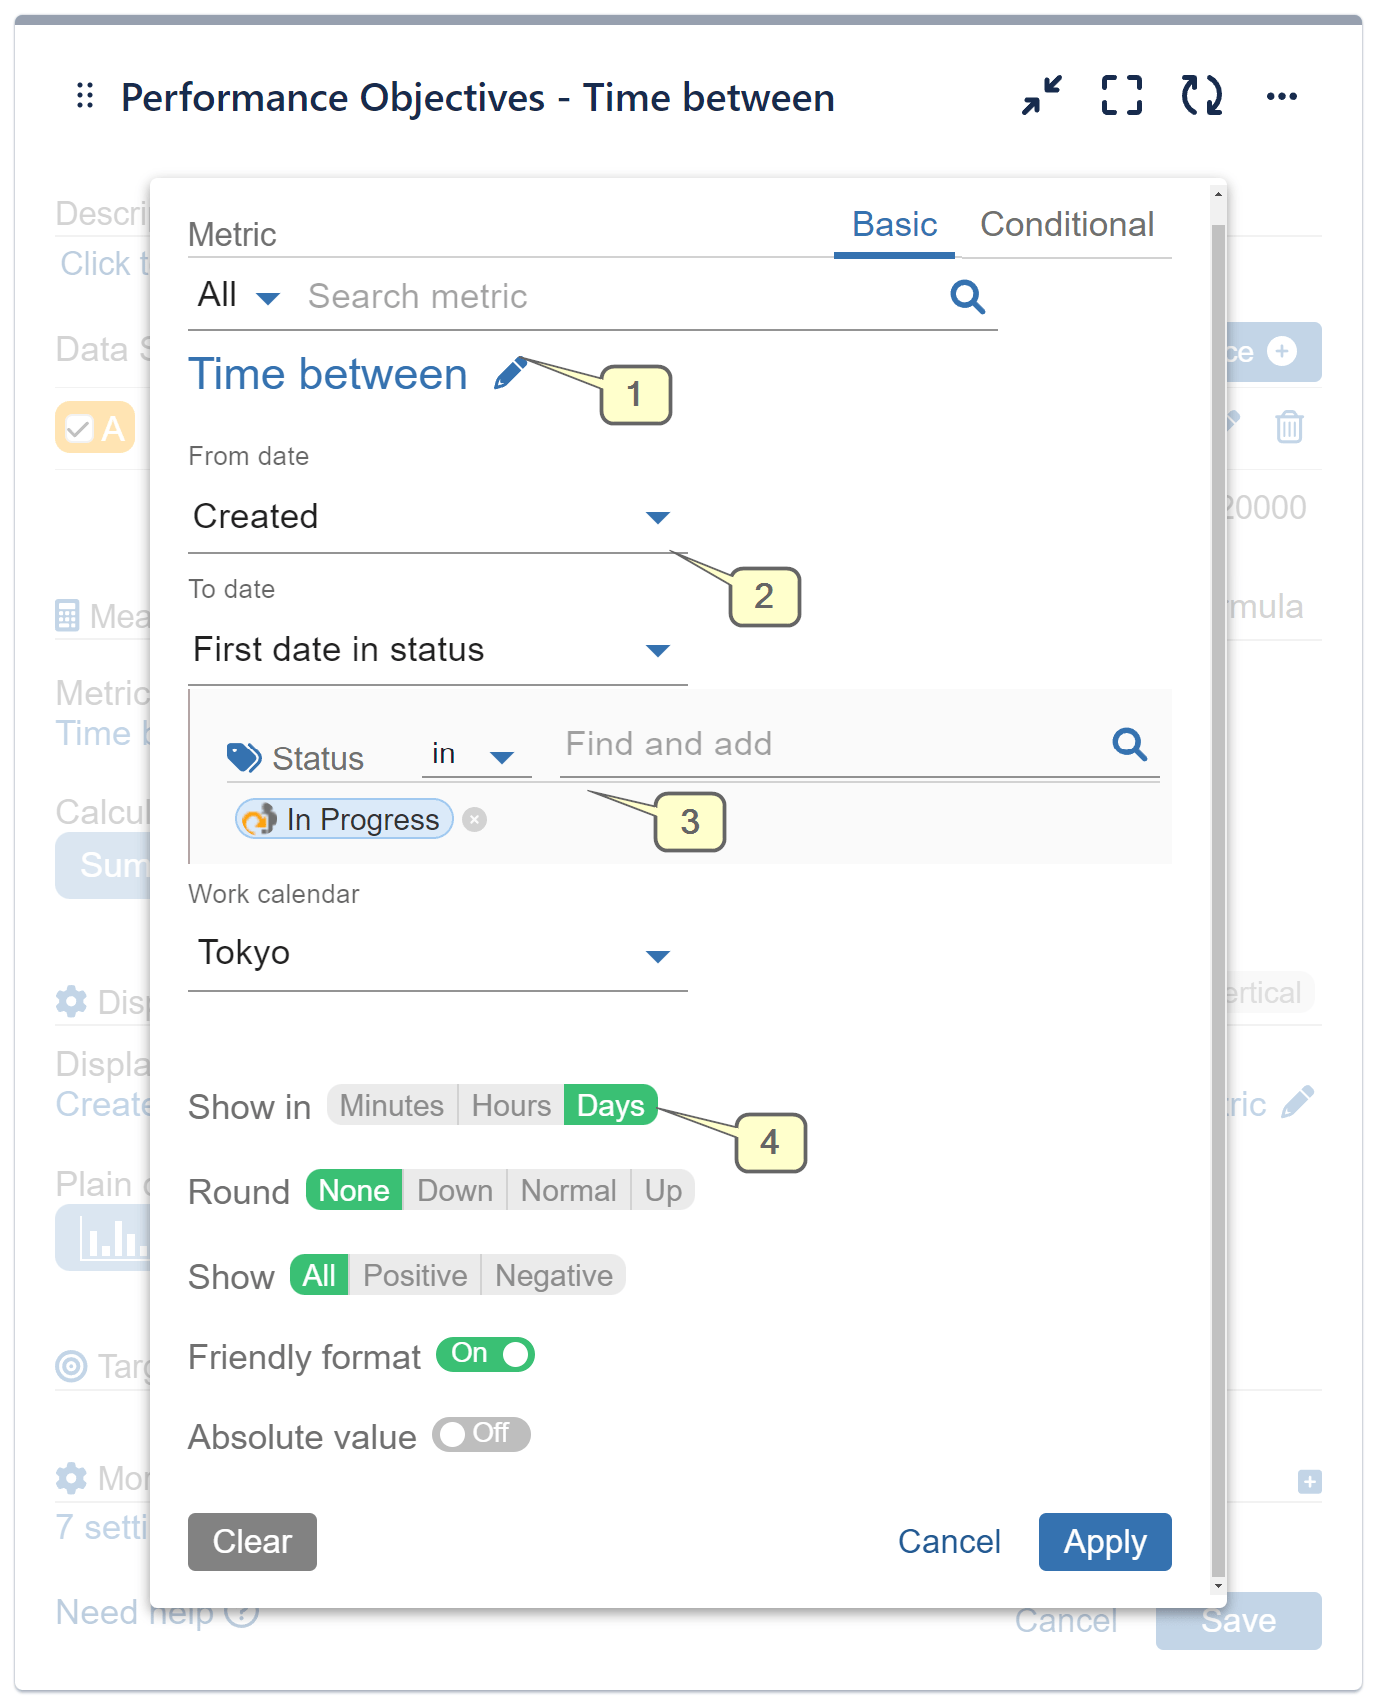
Step 1: Choose the ‘Time between’ metric from the available options.
Step 2: Select “Created” as the “From date” field.
Step 3: For the “To date” field, choose “First date in status” and select the “In Progress” status.
Step 4: Opt for “Shown in Days” and customize your results further, if necessary (toggle friendly format, exclude items with 0 metric values, change chart colors, etc.)
“First date in status” and “Last date in status” are date fields that can be best utilized with ‘Time between’ and ‘Time since’ metrics. You can select one or multiple statuses, and for multiple statuses, the first date when the issue transitions to any status in the list is considered.
Similarly, with “First date in assignee” and “Last date in assignee,” you can display the time between ‘Created’ and the first date when an issue is assigned to one or multiple assignees. Alternatively, you can track the last day in ‘Unassigned’, among other use cases.
Check the recording below for this configuration:
Average Time from Resolved to Due Date
Let’s explore how the average time from Resolved to Due Date appears on a chart.
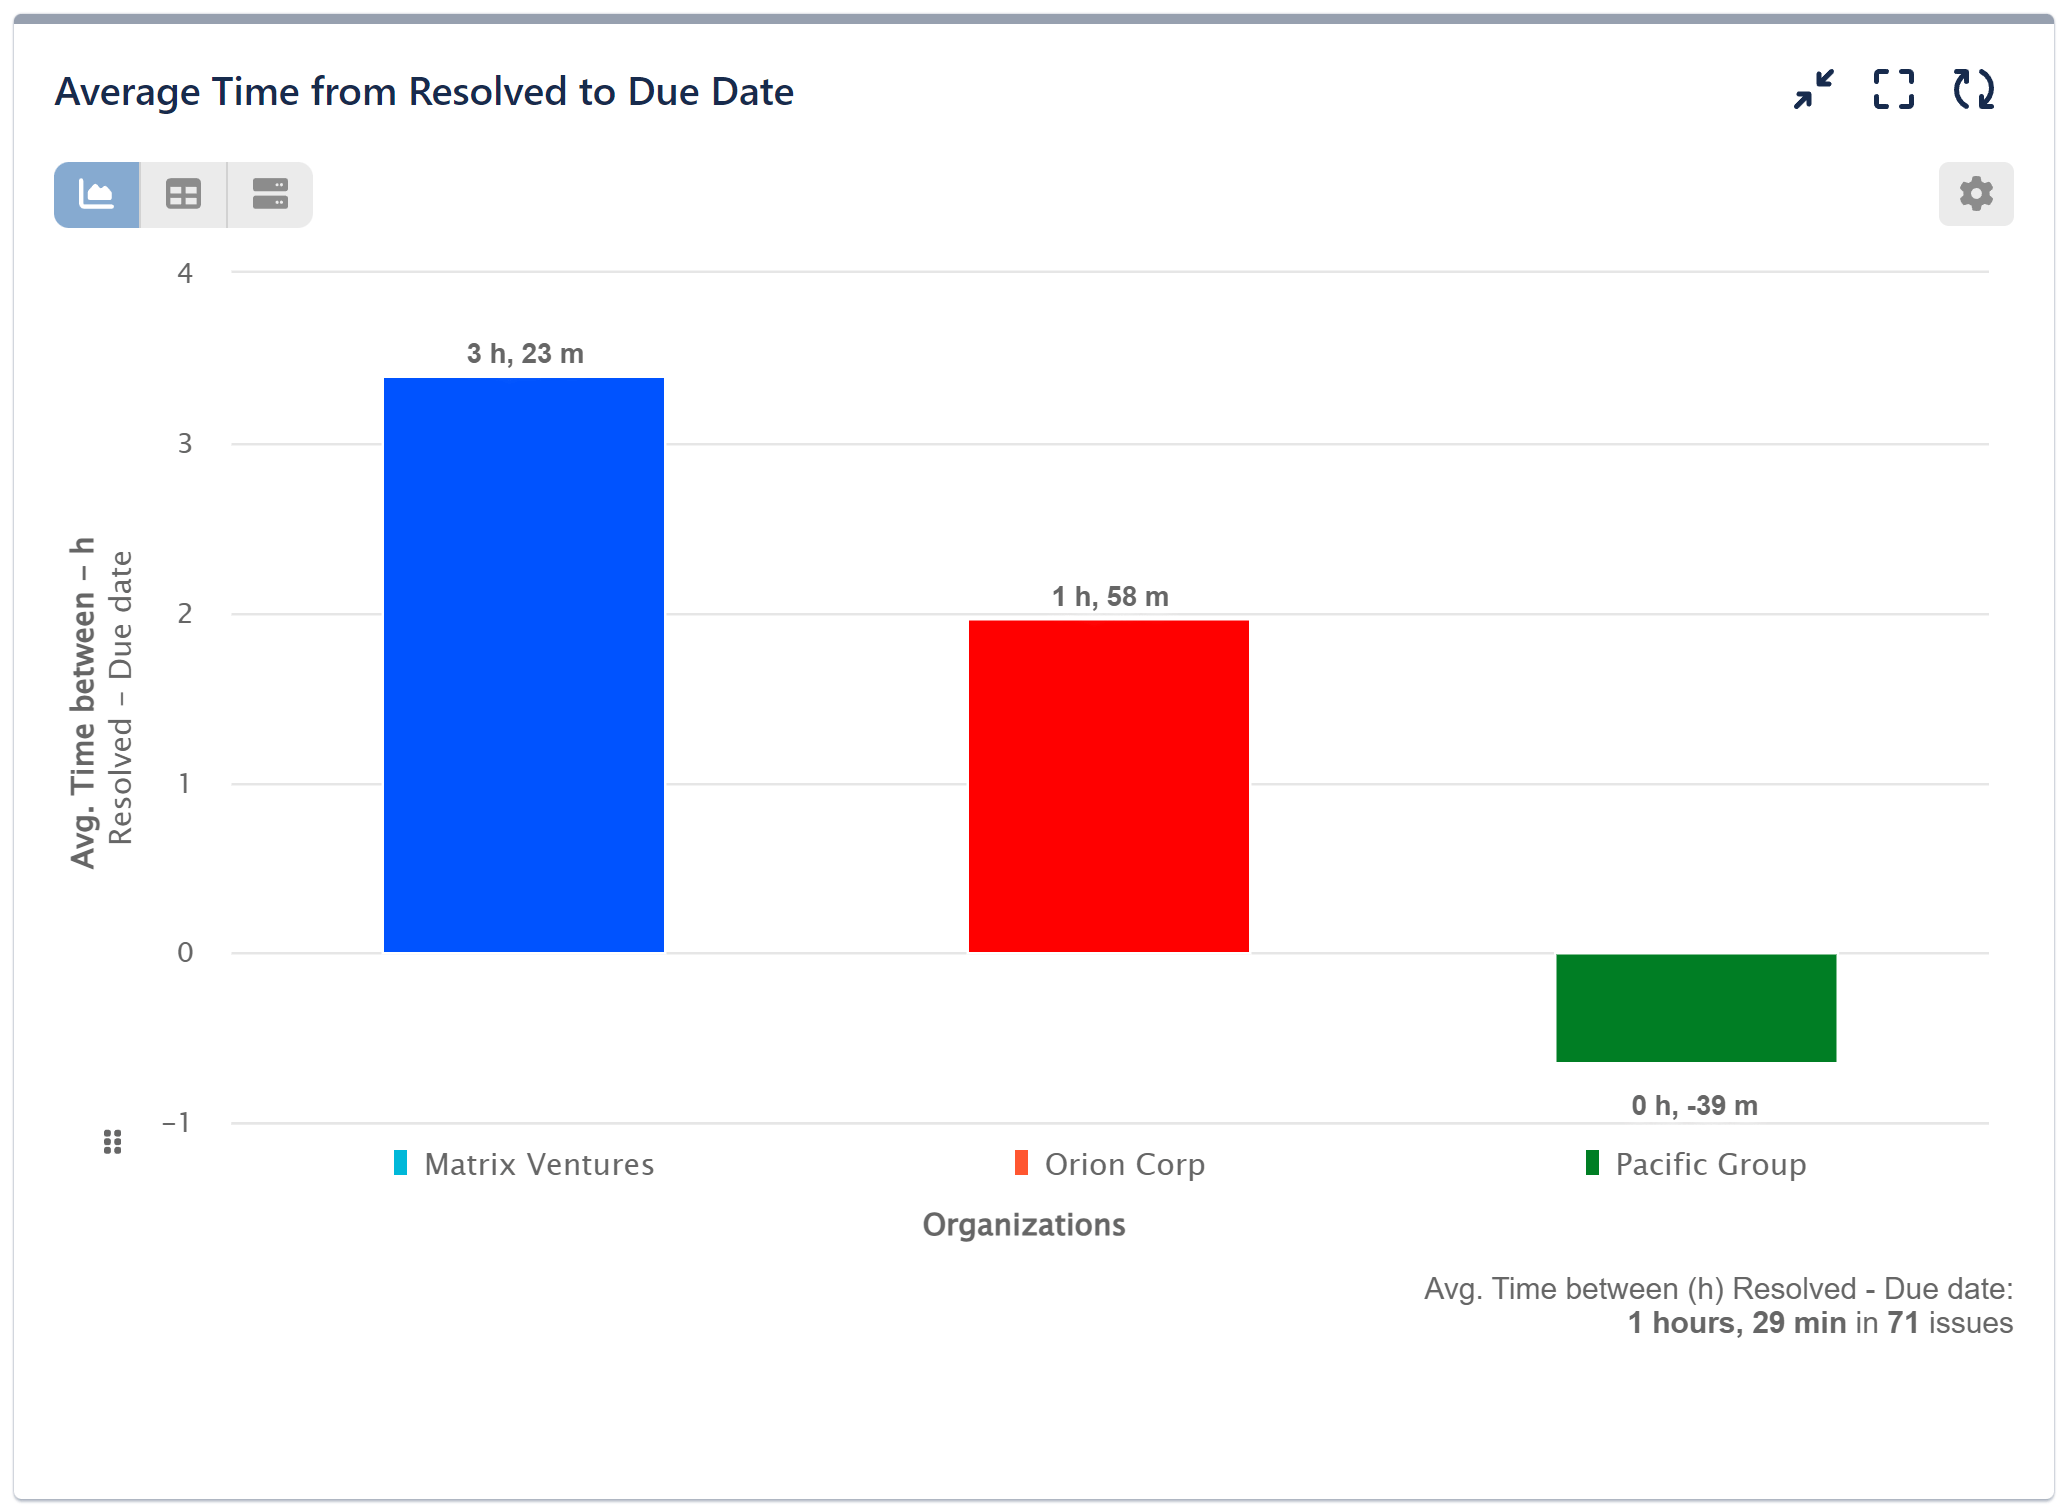
In this chart, we have chosen Average calculation and “Organization” for the Display by, but you can select any field relevant to your analysis, such as “Reporter,” “Issue Type,” and more.
Here are some additional use cases to measure time between dates in Jira, providing deeper insights into your workflow:
- Time from ‘Created’ to ‘First Date in Assignee’
- Time from ‘Review Started’ to ‘Resolved’
Each of these use cases allows you to track the duration between crucial events in your Jira projects, enabling better understanding and optimization of your team’s processes.
Customizing Time Between Date Fields results
With the Performance Objectives: Charts for Jira app, you have plenty of customization options at your disposal. Tailor your ‘Time Between’ report according to your needs by showing the results in minutes, hours, or days. Round the result or toggle the Friendly format to view an easy to read and grasp form of dates and numbers. You can also select the type of calculation, whether it’s sum, average, or moving average. These flexible settings allow you to present the data in a way that best suits your reporting and analysis needs.
Explore additional KPI reports based on this powerful metric in the following articles: Mean Time to Resolution, Cycle Time Report, First Response Time.
Related topics: Cycles in status, Time in assignee, Cycles in assignee, Time since, Work calendars.
Start your 30 days free trial of Performance Objectives: Charts for Jira from Atlassian Marketplace.