Performance Objectives: Charts for Jira offers extensive support for dynamic fields and metrics, facilitating comprehensive time-tracking Jira reporting. Among the powerful metrics available is ‘Time since,’ which enables you to track the time elapsed since a specific date field, such as ‘Created,’ ‘Updated,’ ‘Resolved,’ in Jira, and more. For a comprehensive list of date fields compatible with the ‘Time since’ metric, please scroll down to the bottom of the page.
Now, let’s delve into some sample chart configurations utilizing the ‘Time since’ time field.
Create Average Age Report with ‘Time Since’ Metric
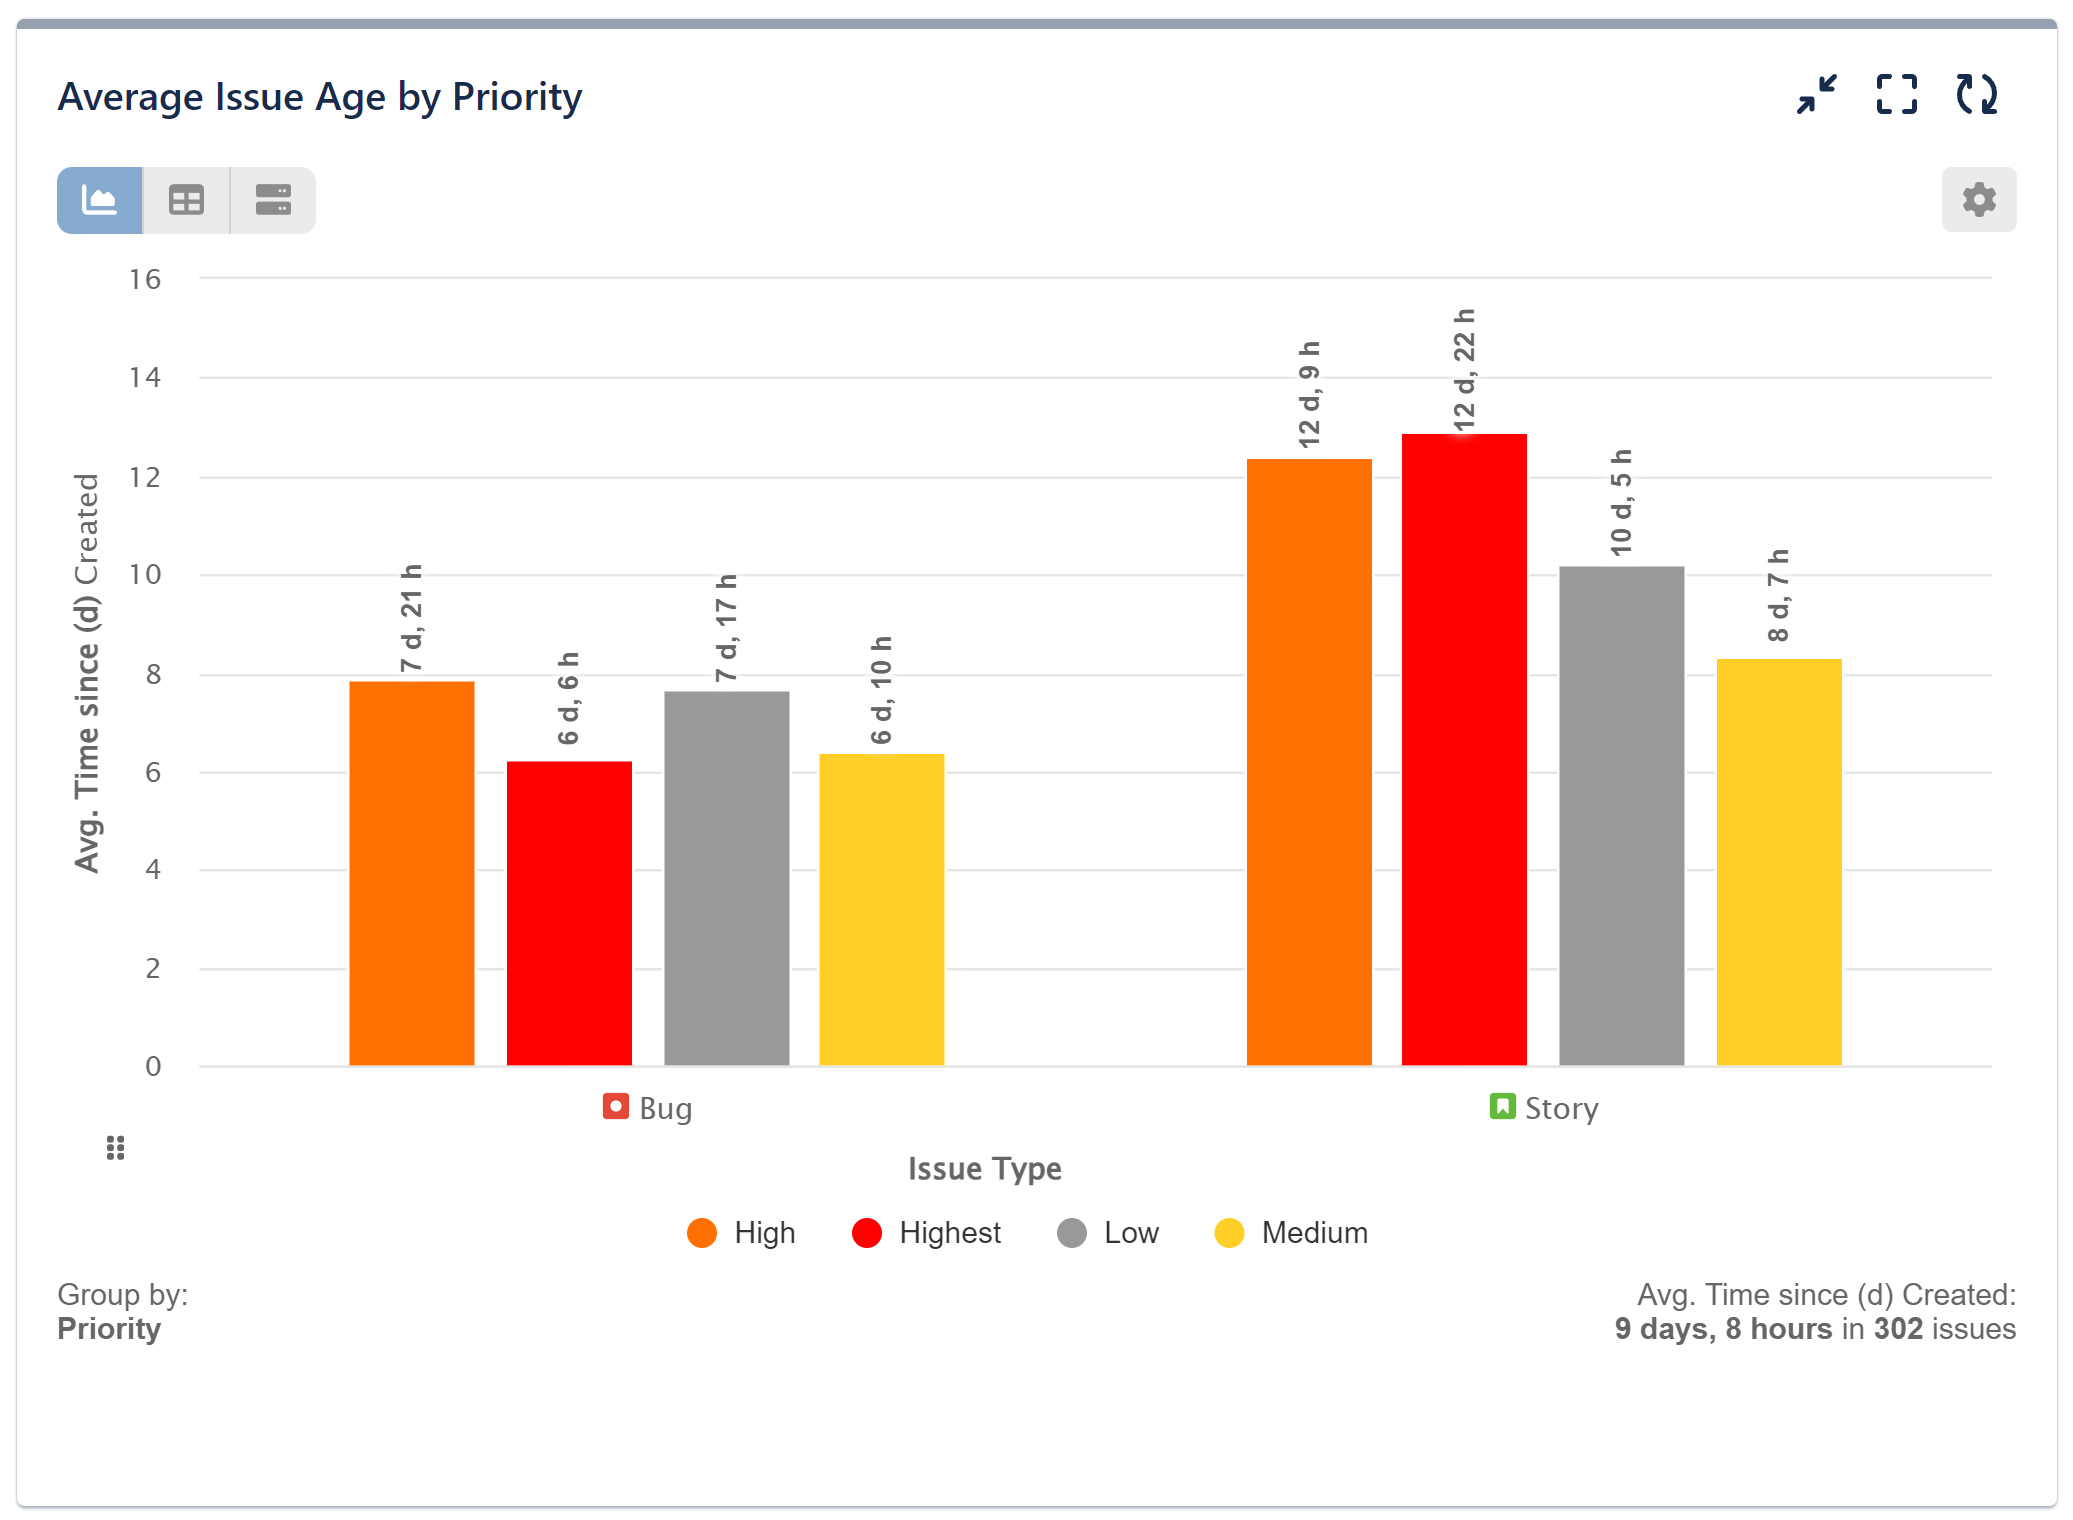
Analyzing and tracking issues’ age with the ’Time Since’ metric not only ensures better issue management but also leads to more efficient workflows, improved team accountability, and data-driven decision-making. Here’s a sample “Average Issue Age” report, detailing the average number of days that Bug and Story issues remained open after being created, grouped by priority.
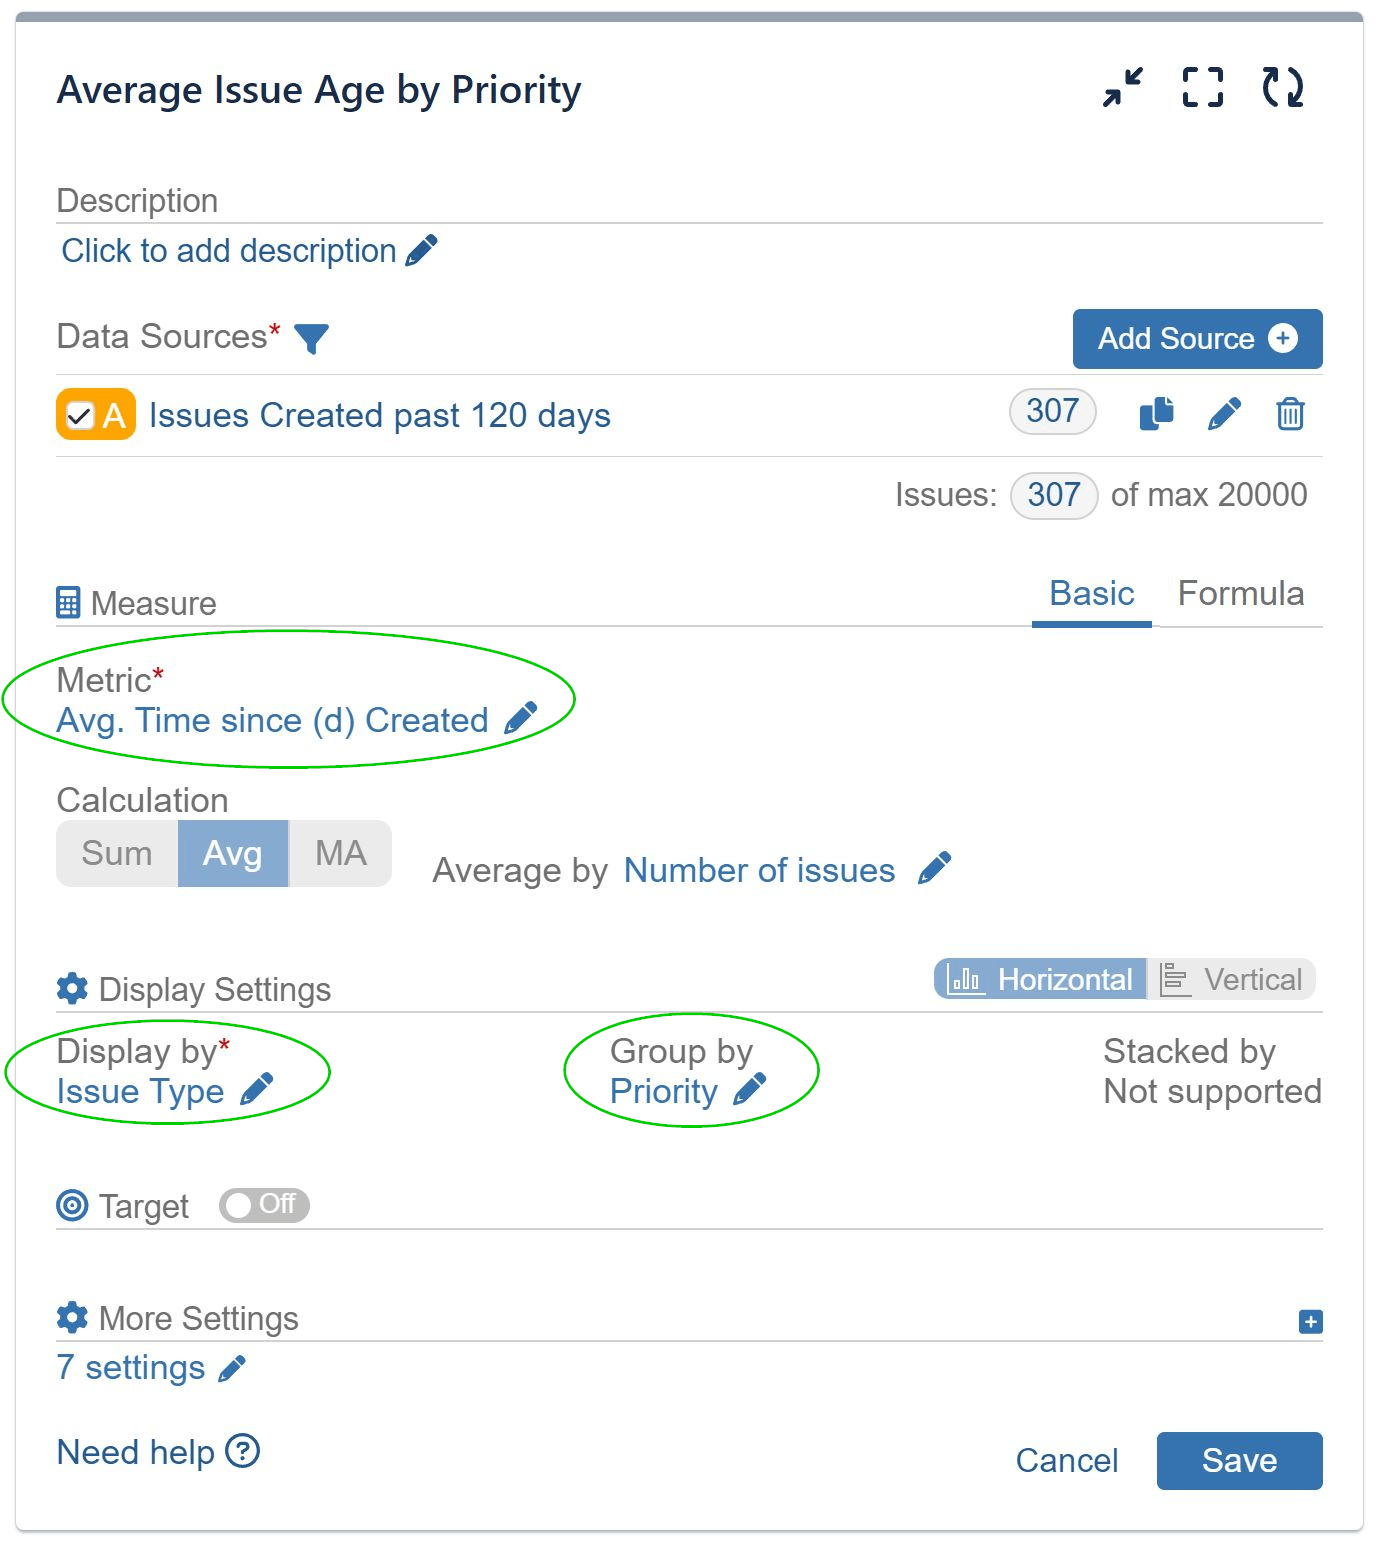
In our example chart, we’ve selected the Average calculation for the ‘Time Since’ metric. The ‘Issue Type’ field is selected for Display by, and we have further grouped by ‘Priority’.
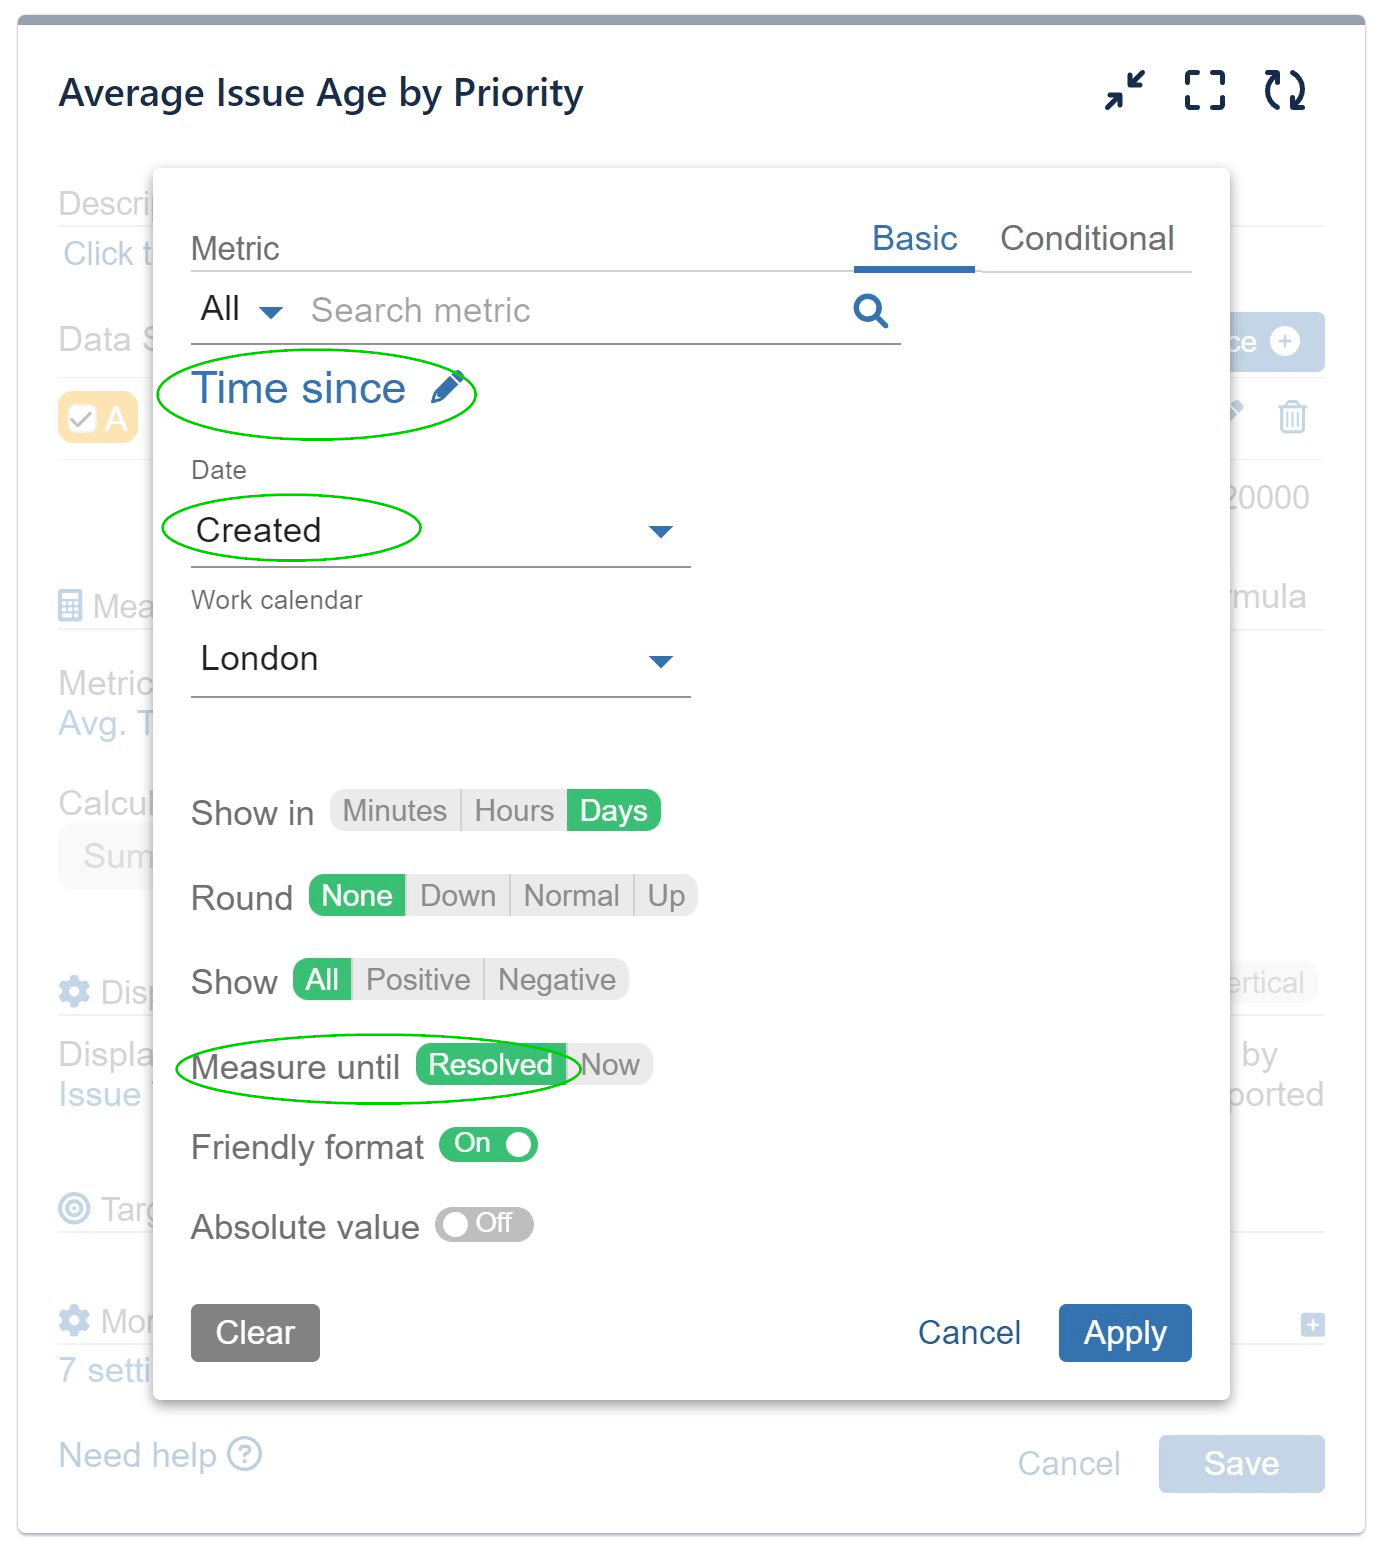
In this report, we utilize the ‘Time since’ metric to calculate the average age of all issues filtered within the data source, irrespective of their resolution status.When setting up the metric, you’ll notice that the “Measure until Resolved” button is selected by default, which calculates time in the following way:
for resolved issues, it measures the time elapsed from creation to resolution
for open issues, it calculates the time from creation until the present moment
Should you wish to assess the age of the issues exclusively for closed or open issues, you can customize this within your data source settings. Additionally, in certain contexts, you may find it beneficial to utilize the “until now” selection.
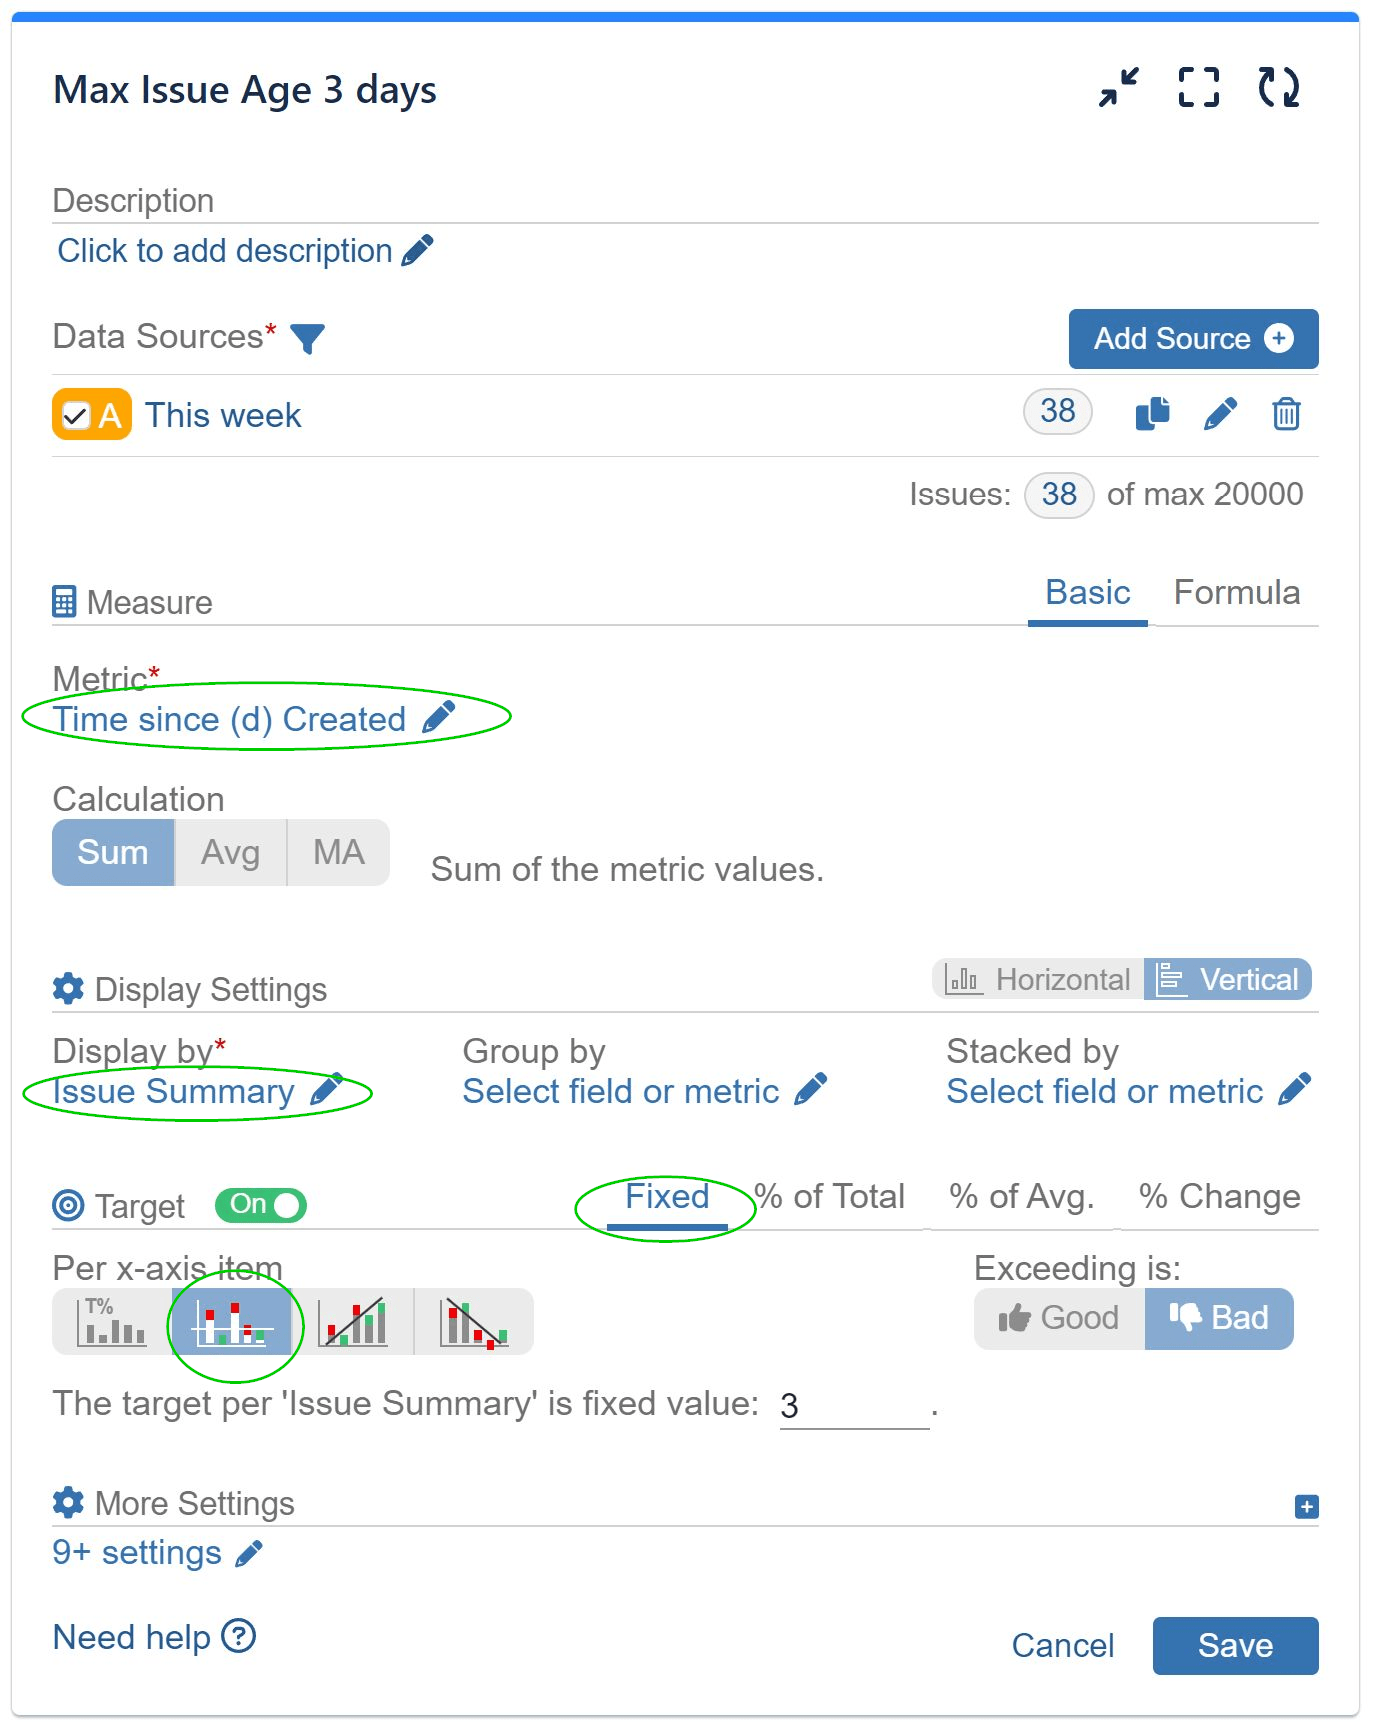
Combining ‘Time Since’ Metric with Target Feature for ‘Max Issue Age’ KPI Report
The Performance Objectives app goes beyond tracking elapsed time by offering the option to define a ‘max issue age’ target. Slot splitters and target feature, along with various customization options, are what sets our app capabilities apart the native Jira Time Since Issues chart, where those options are missing.
Targets feature allows teams to establish performance objectives related to issue age and ensures that timely resolutions are achieved. By combining the ‘Time since’ metric and a target for max issue age, businesses can optimize their performance, proactively identify and address bottlenecks, and significantly improve workflow efficiency.
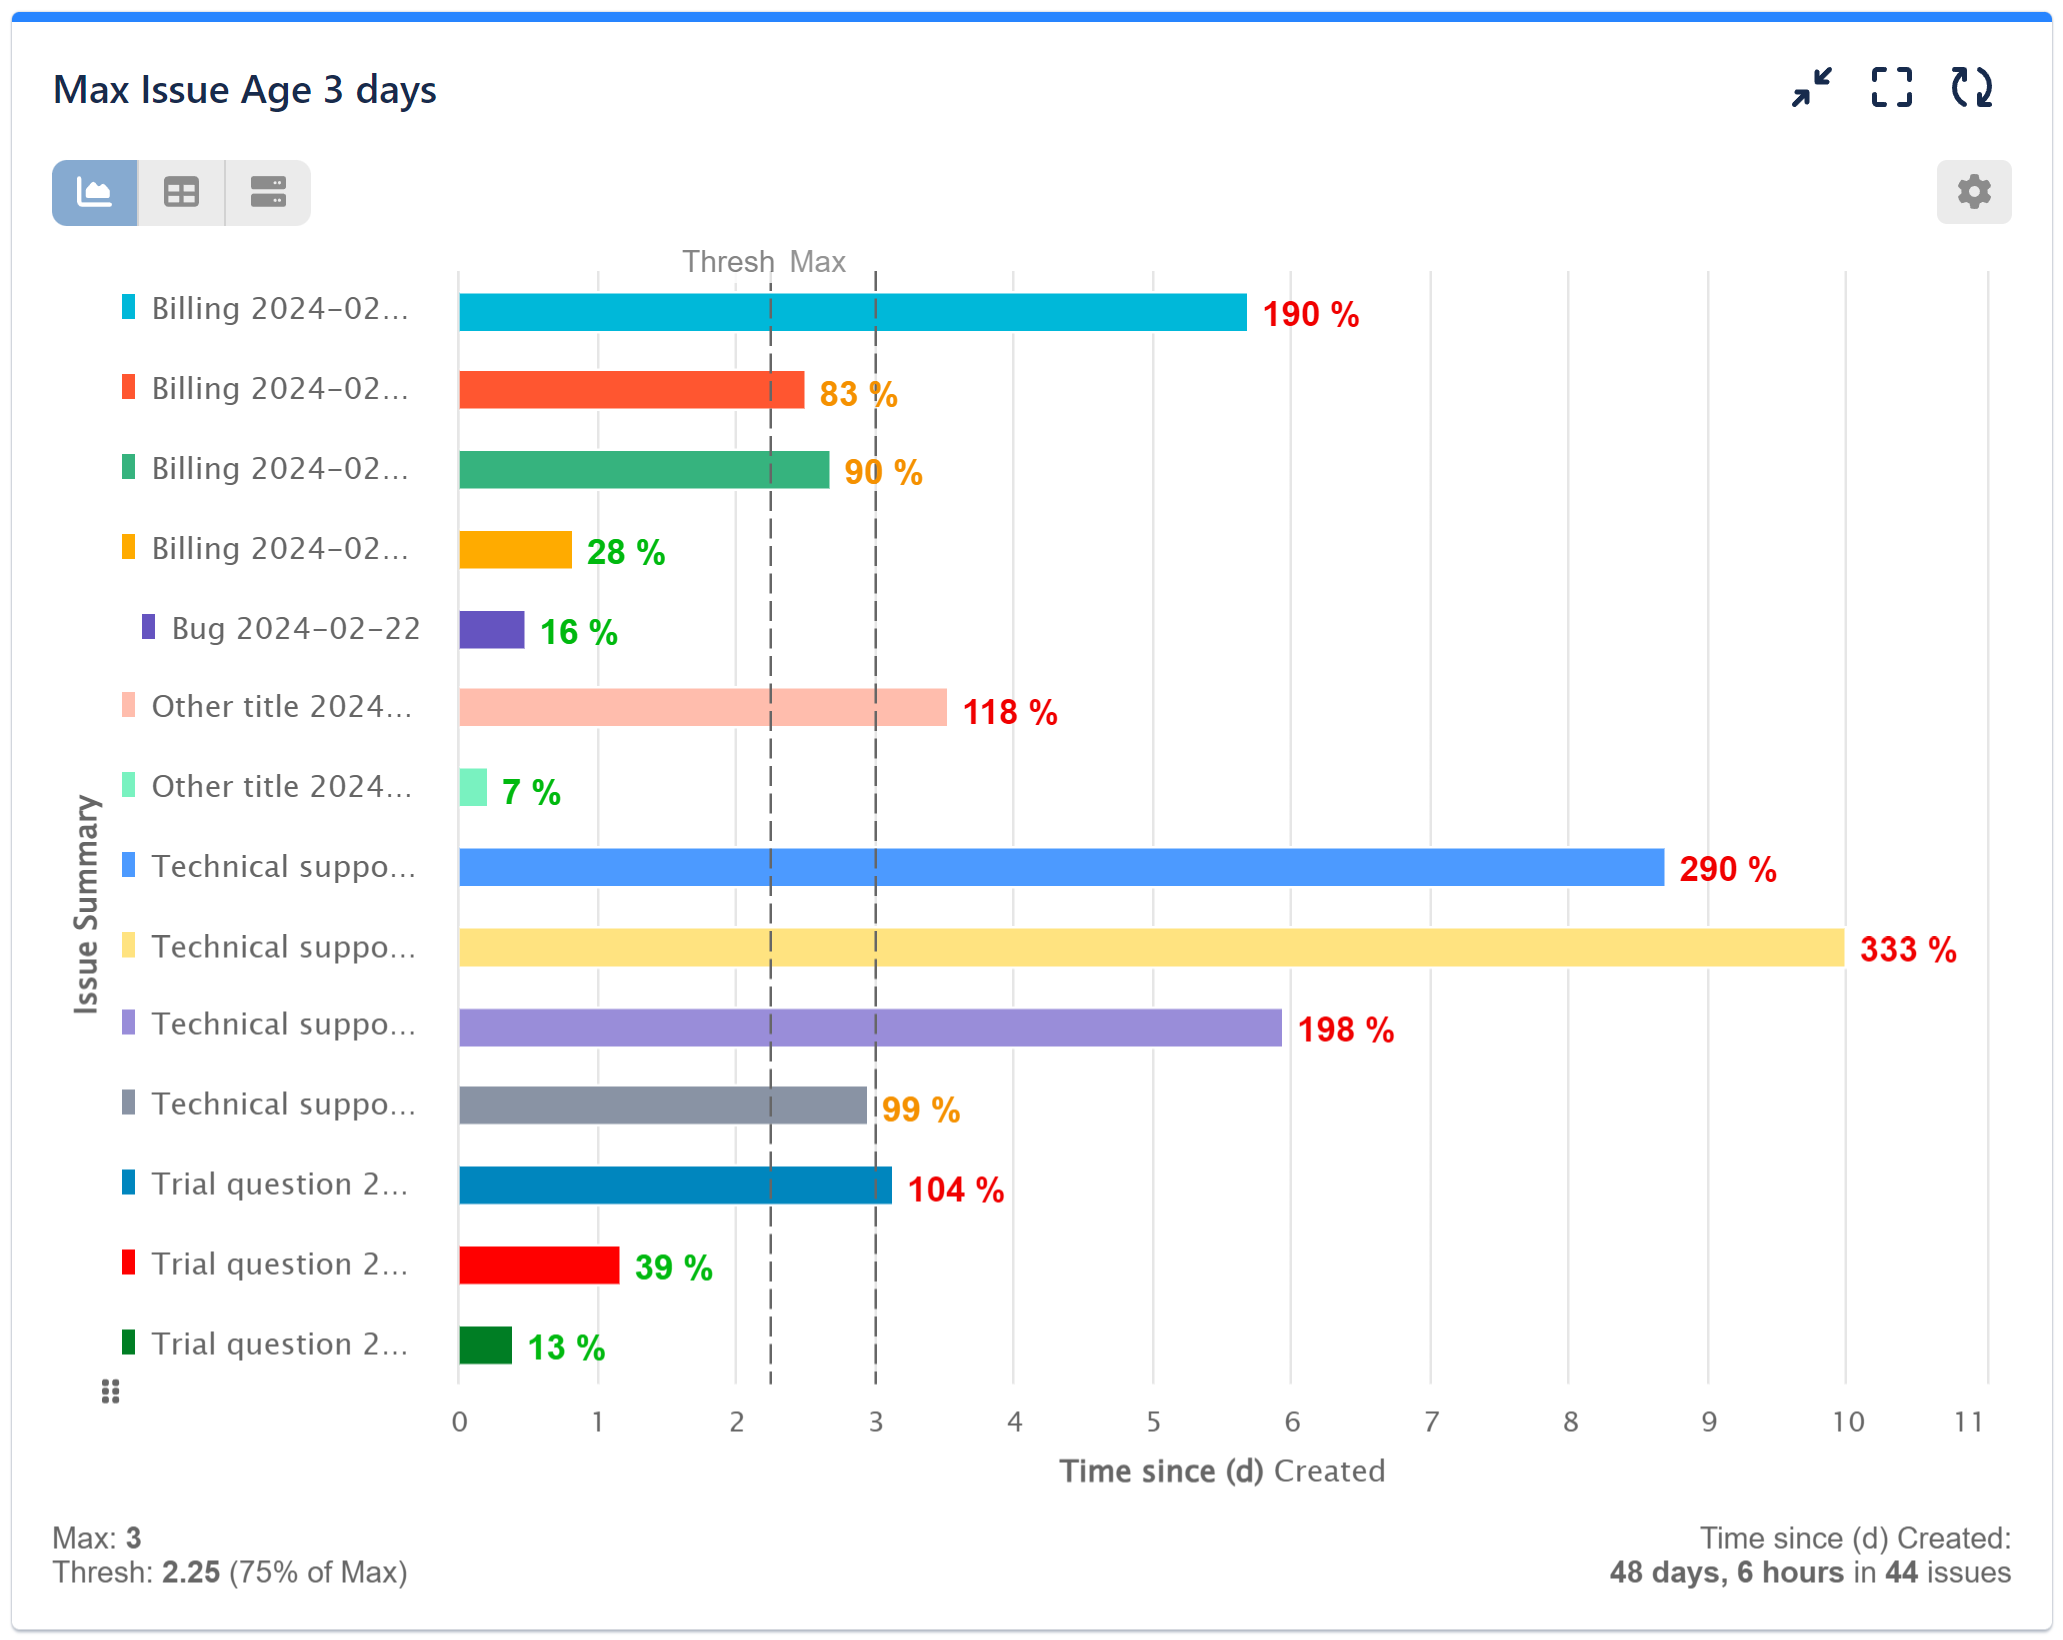
In our sample KPI report, we’ve specified the open issues from the data source. We’ve employed the ‘Time Since’ – Created metric, measured in days, for detailed analysis. The ‘Display By’ parameter is configured to ‘Issue Summary’ to provide further insight into the characteristics of the issues. Additionally, we’ve enabled the ‘Target’ feature, set it to ‘Fixed,’ and established a fixed threshold of 3 days. Exceeding this target is considered undesirable.
Date Fields Supported by ‘Time Since’ Metric for Enhanced Time-Tracking in Jira
Field Name
Usage
Compatibility
1.
Approval Completed
calendar_month F
stacked_bar_chart area_chart donut_small ssid_chart shape_line scatter_plot space_dashboard join_full blur_on history
2.
Approval Created
calendar_month F
stacked_bar_chart area_chart donut_small ssid_chart shape_line scatter_plot space_dashboard join_full blur_on history
3.
Assignee change date
calendar_month F lock_open
stacked_bar_chart area_chart donut_small ssid_chart shape_line scatter_plot space_dashboard join_full blur_on history
4.
Actual end
calendar_month F
stacked_bar_chart area_chart donut_small ssid_chart shape_line scatter_plot space_dashboard join_full blur_on history
5.
Actual start
calendar_month F
stacked_bar_chart area_chart donut_small ssid_chart shape_line scatter_plot space_dashboard join_full blur_on history
6.
Created
calendar_month F
stacked_bar_chart area_chart donut_small ssid_chart shape_line scatter_plot space_dashboard join_full blur_on history
7.
Date of first response
calendar_month F
stacked_bar_chart area_chart donut_small ssid_chart shape_line scatter_plot space_dashboard join_full blur_on history
8.
Due date
calendar_month F
stacked_bar_chart area_chart donut_small ssid_chart shape_line scatter_plot space_dashboard join_full blur_on history
9.
First date in status
calendar_month F
stacked_bar_chart area_chart donut_small ssid_chart shape_line scatter_plot space_dashboard join_full blur_on history
10.
First date flagged
calendar_month F
stacked_bar_chart area_chart donut_small ssid_chart shape_line scatter_plot space_dashboard join_full blur_on history
11.
First date in assignee
calendar_month F
stacked_bar_chart area_chart donut_small ssid_chart shape_line scatter_plot space_dashboard join_full blur_on history
12.
First sprint start date
calendar_month F
stacked_bar_chart area_chart donut_small ssid_chart shape_line scatter_plot space_dashboard join_full blur_on history
13.
First work log
calendar_month F
stacked_bar_chart area_chart donut_small ssid_chart shape_line scatter_plot space_dashboard join_full blur_on history
14.
Flagged change date
calendar_month F
stacked_bar_chart area_chart donut_small ssid_chart shape_line scatter_plot space_dashboard join_full blur_on history
15.
Last viewed
calendar_month F
stacked_bar_chart area_chart donut_small ssid_chart shape_line scatter_plot space_dashboard join_full blur_on history
16.
Last date in status
calendar_month F
stacked_bar_chart area_chart donut_small ssid_chart shape_line scatter_plot space_dashboard join_full blur_on history
17.
Last date flagged
calendar_month F
stacked_bar_chart area_chart donut_small ssid_chart shape_line scatter_plot space_dashboard join_full blur_on history
18.
Last date in assignee
calendar_month F
stacked_bar_chart area_chart donut_small ssid_chart shape_line scatter_plot space_dashboard join_full blur_on history
19.
Last dev commit date
calendar_month F
stacked_bar_chart area_chart donut_small ssid_chart shape_line scatter_plot space_dashboard join_full blur_on history
20.
Last sprint end date
calendar_month F
stacked_bar_chart area_chart donut_small ssid_chart shape_line scatter_plot space_dashboard join_full blur_on history
21.
Last work log
calendar_month F
stacked_bar_chart area_chart donut_small ssid_chart shape_line scatter_plot space_dashboard join_full blur_on history
22.
Planned end
calendar_month F
stacked_bar_chart area_chart donut_small ssid_chart shape_line scatter_plot space_dashboard join_full blur_on history
23.
Planned start
calendar_month F
stacked_bar_chart area_chart donut_small ssid_chart shape_line scatter_plot space_dashboard join_full blur_on history
24.
Resolved
calendar_month F
stacked_bar_chart area_chart donut_small ssid_chart shape_line scatter_plot space_dashboard join_full blur_on history
Additionally, in our KPI examples section, you can access detailed instructions on creating various KPI reports, including the Max Issue Age KPI report, among numerous others.