Table of Contents
KPIs, or Key Performance Indicators, are essential metrics used to measure and evaluate business performance. By tracking specific KPIs, businesses gain valuable insights to make data-driven decisions and improve operations, productivity, and overall success.
In this comprehensive guide, we explore the ‘Max Issue Age’ KPI and how efficiently tracking elapsed time since a designated event date can provide valuable insights. The ‘Time since’ metric, available in the Performance Objectives: Charts for Jira app, allows businesses to closely monitor issue age, optimize performance objectives, identify bottlenecks, improve workflow efficiency, and enhance customer satisfaction through timely issue resolution.
Tracking Time Since any Date Field in Jira with ‘Time since’ Metric
Jira users often rely on the built-in Average Age chart to determine the average age of issues based on specific event dates, such as issue creation or resolution. This chart provides some insights into the overall aging of issues. However, the Performance Objectives app takes this functionality a step further by introducing the ‘Time since’ metric. This metric empowers you to track the time that has passed since a designated event date. The event date can be any standard or custom Jira date field, such as Created, Updated, Resolved, or any other relevant milestone within your workflow.
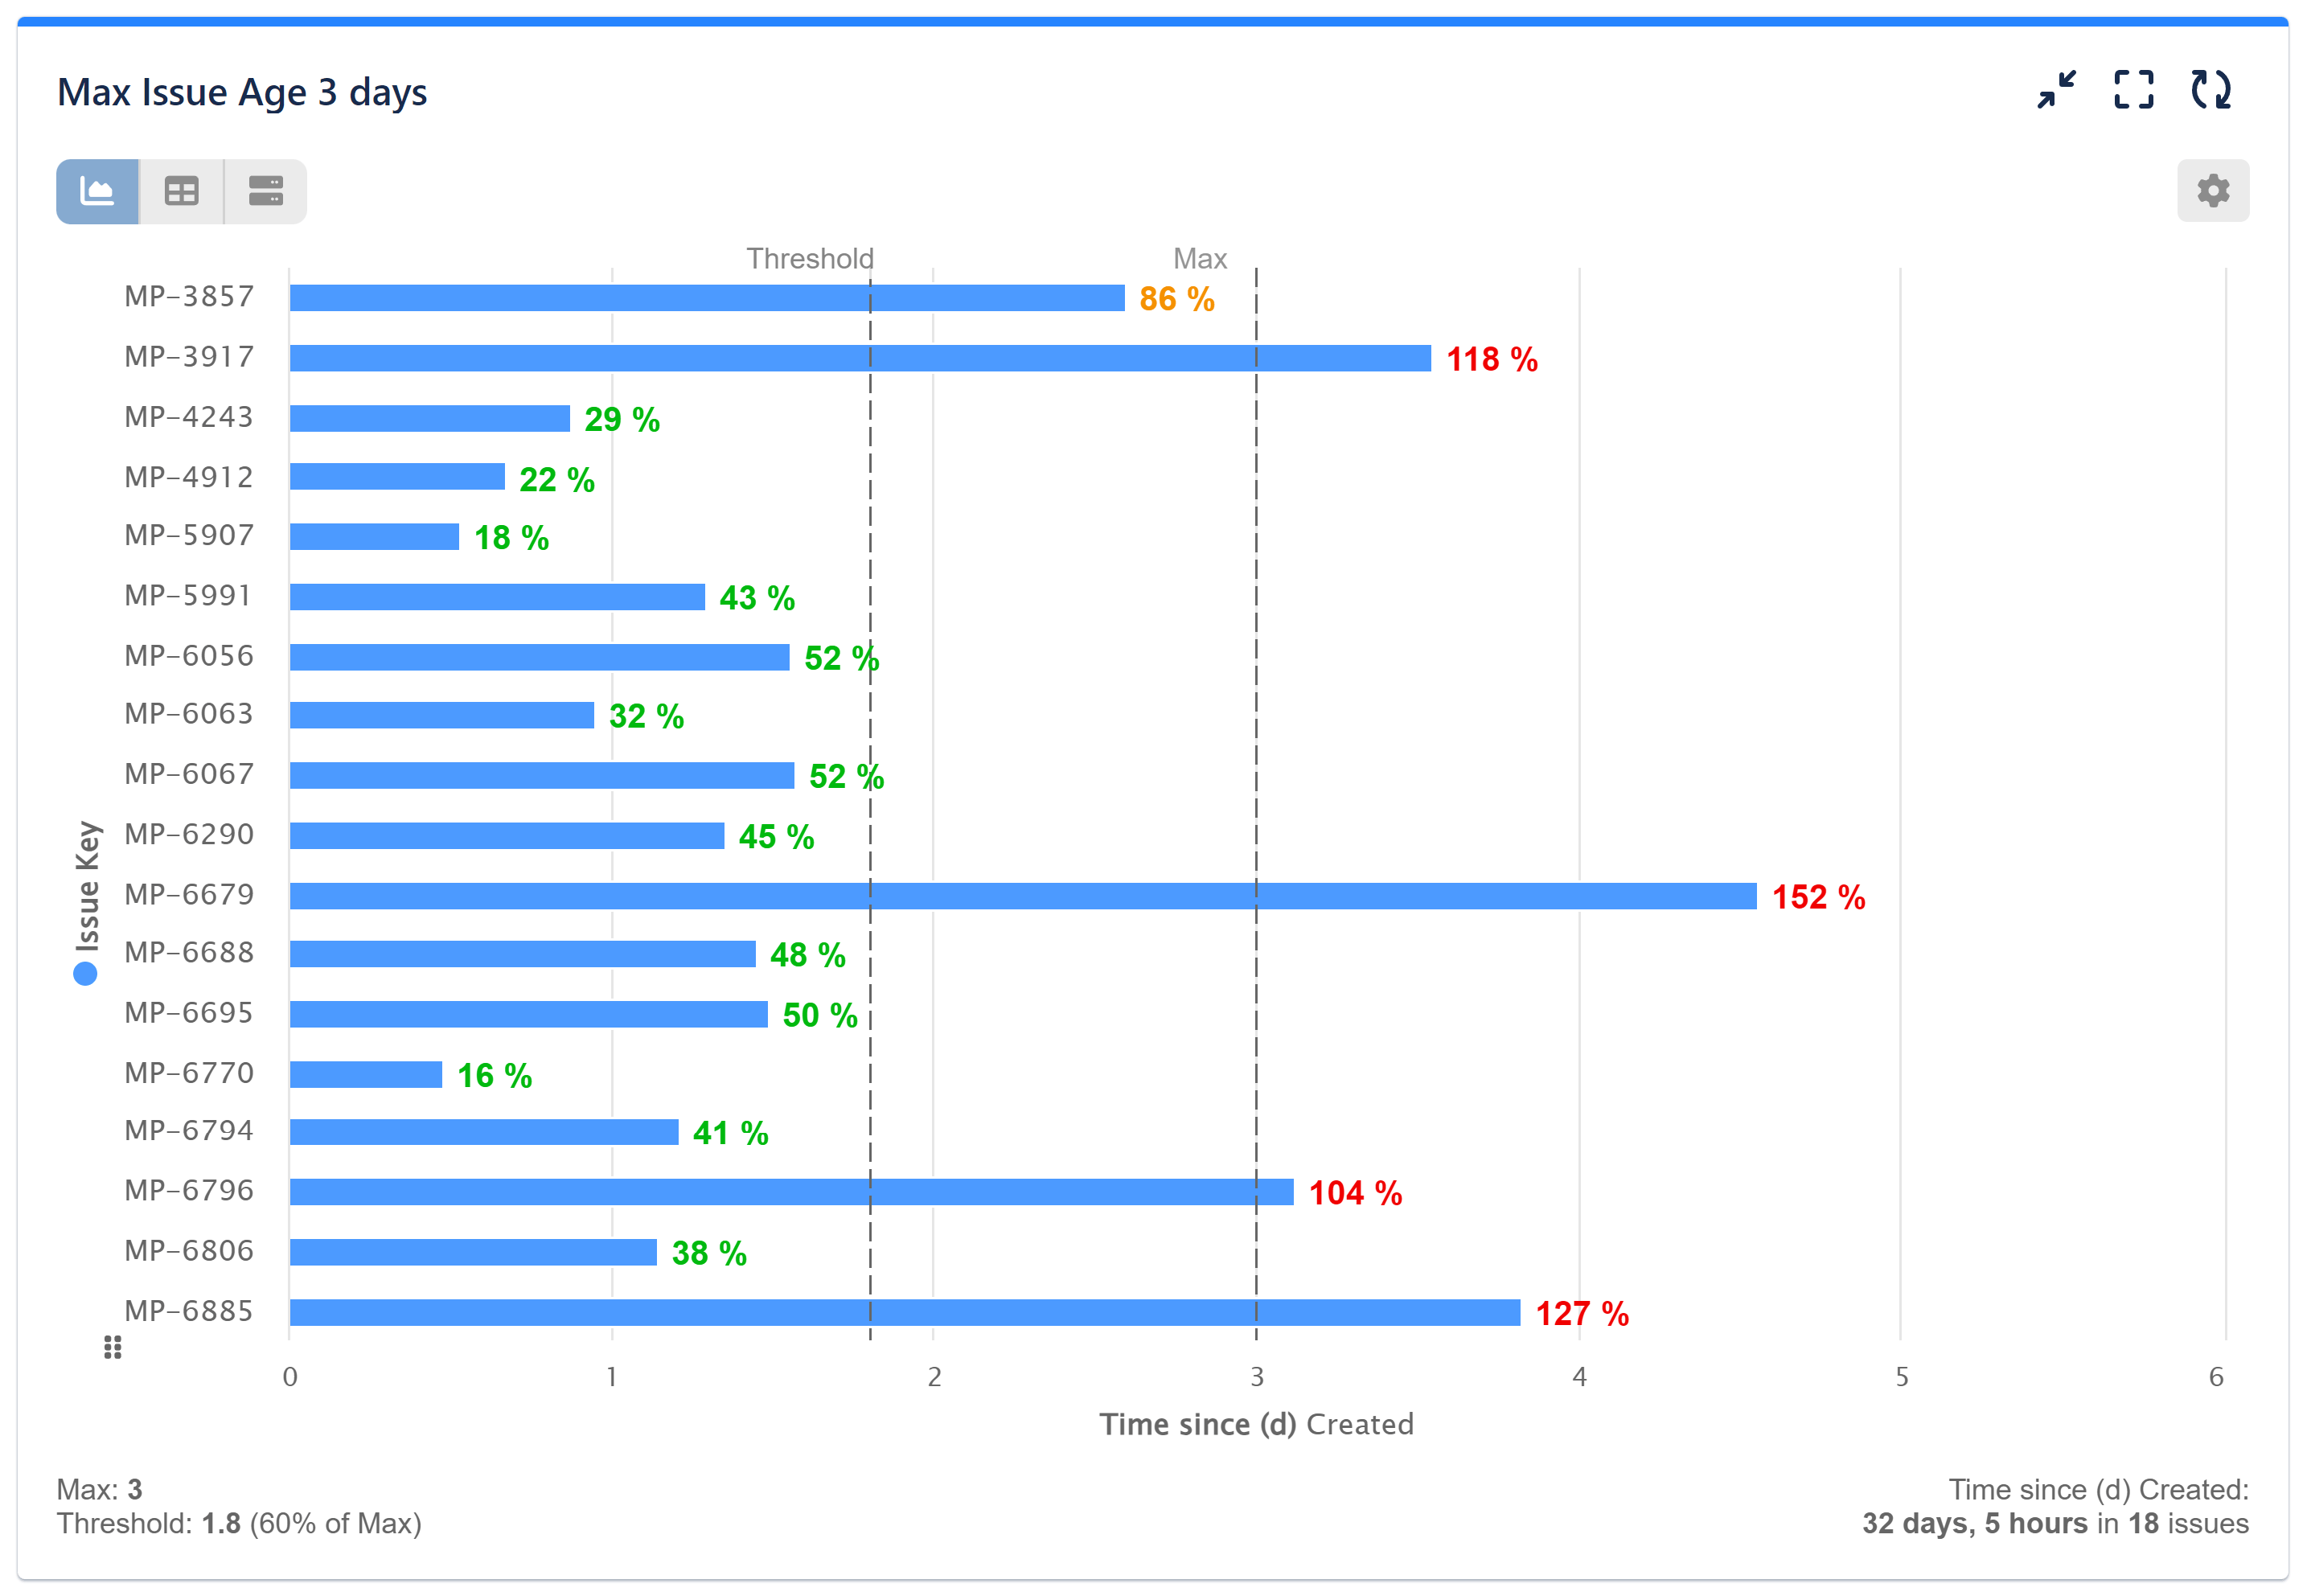
Moreover, the Performance Objectives app goes beyond tracking elapsed time by offering the option to define a ‘max issue age’ target. This feature allows teams to establish performance objectives related to issue age and ensures that timely resolutions are achieved. By combining the ‘Time since’ metric and the ‘max issue age’ target, businesses can optimize their performance, proactively identify and address bottlenecks, and significantly improve workflow efficiency. Now, let’s explore the ‘Max issue age’ KPI!
Defining the Max Issue Age Target for Effective Performance Monitoring
To effectively measure issue age, the Performance Objectives gadget allows you to set a target called the ‘Max issue age’. This target can be defined in either days or hours, depending on your specific needs and requirements. By establishing a threshold, you gain a clear benchmark to evaluate whether your issues are within the desired age range or if any exceed the defined maximum.
Ensure that you set an appropriate target to monitor and optimize your workflow.
Step-by-Step Configuration Guide:
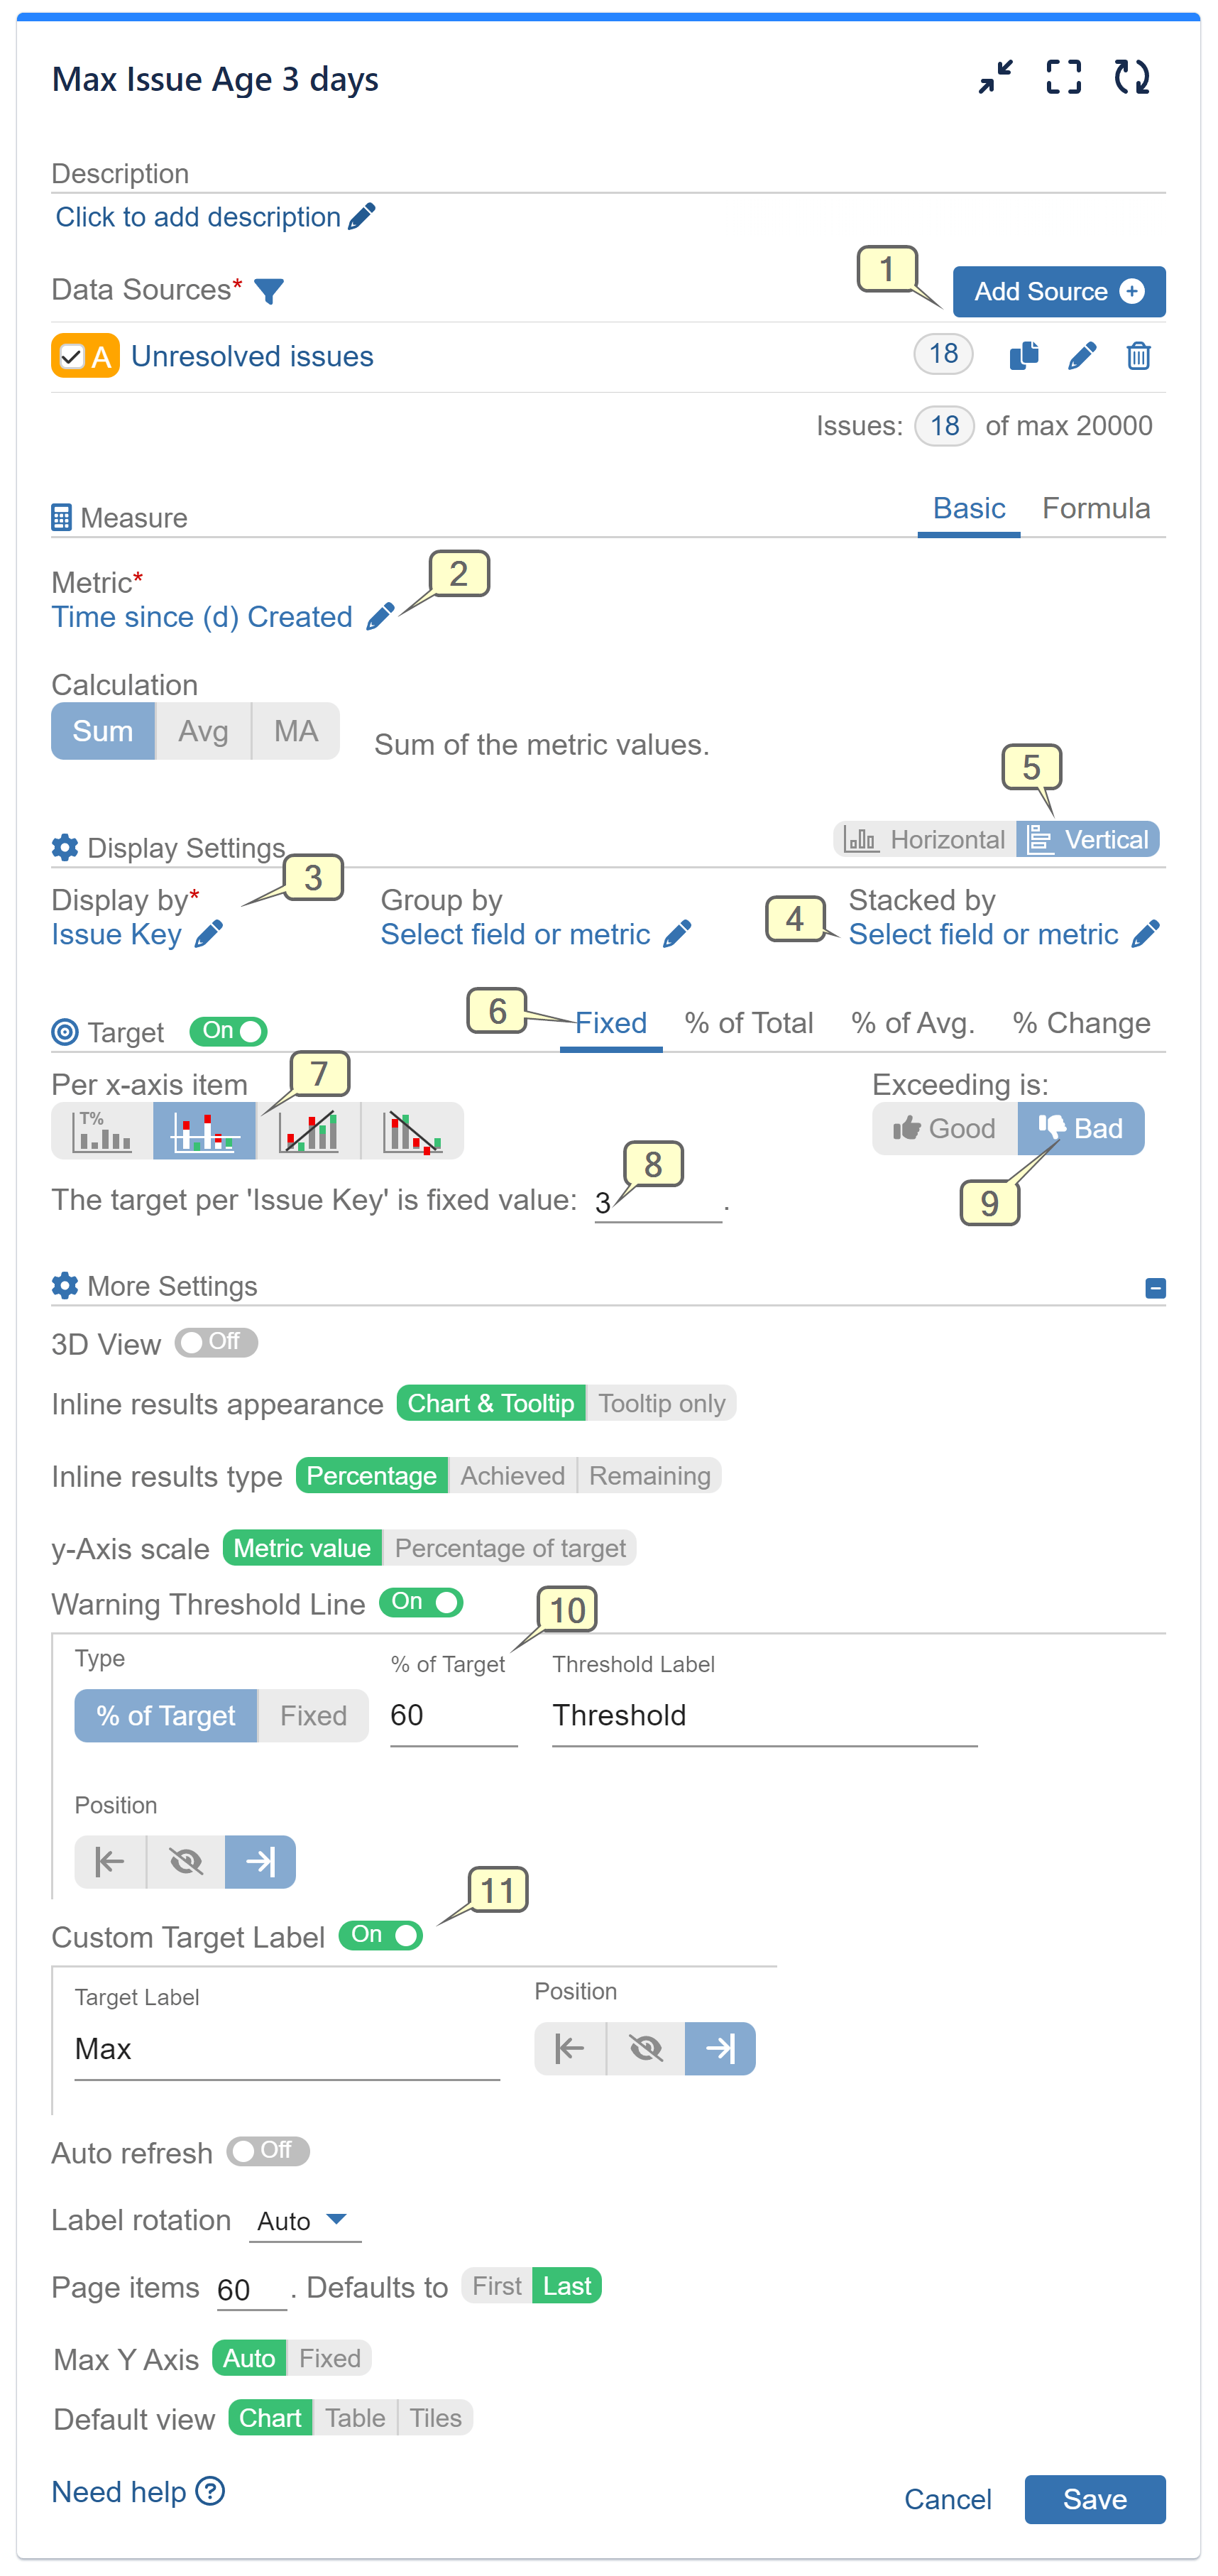
Step 1: Identify Jira issues to be analyzed by configuring them within the Data Source, e.g., Status was not in Resolved / Closed/ Done from past x days to today, Issue type is ‘Support’, etc.
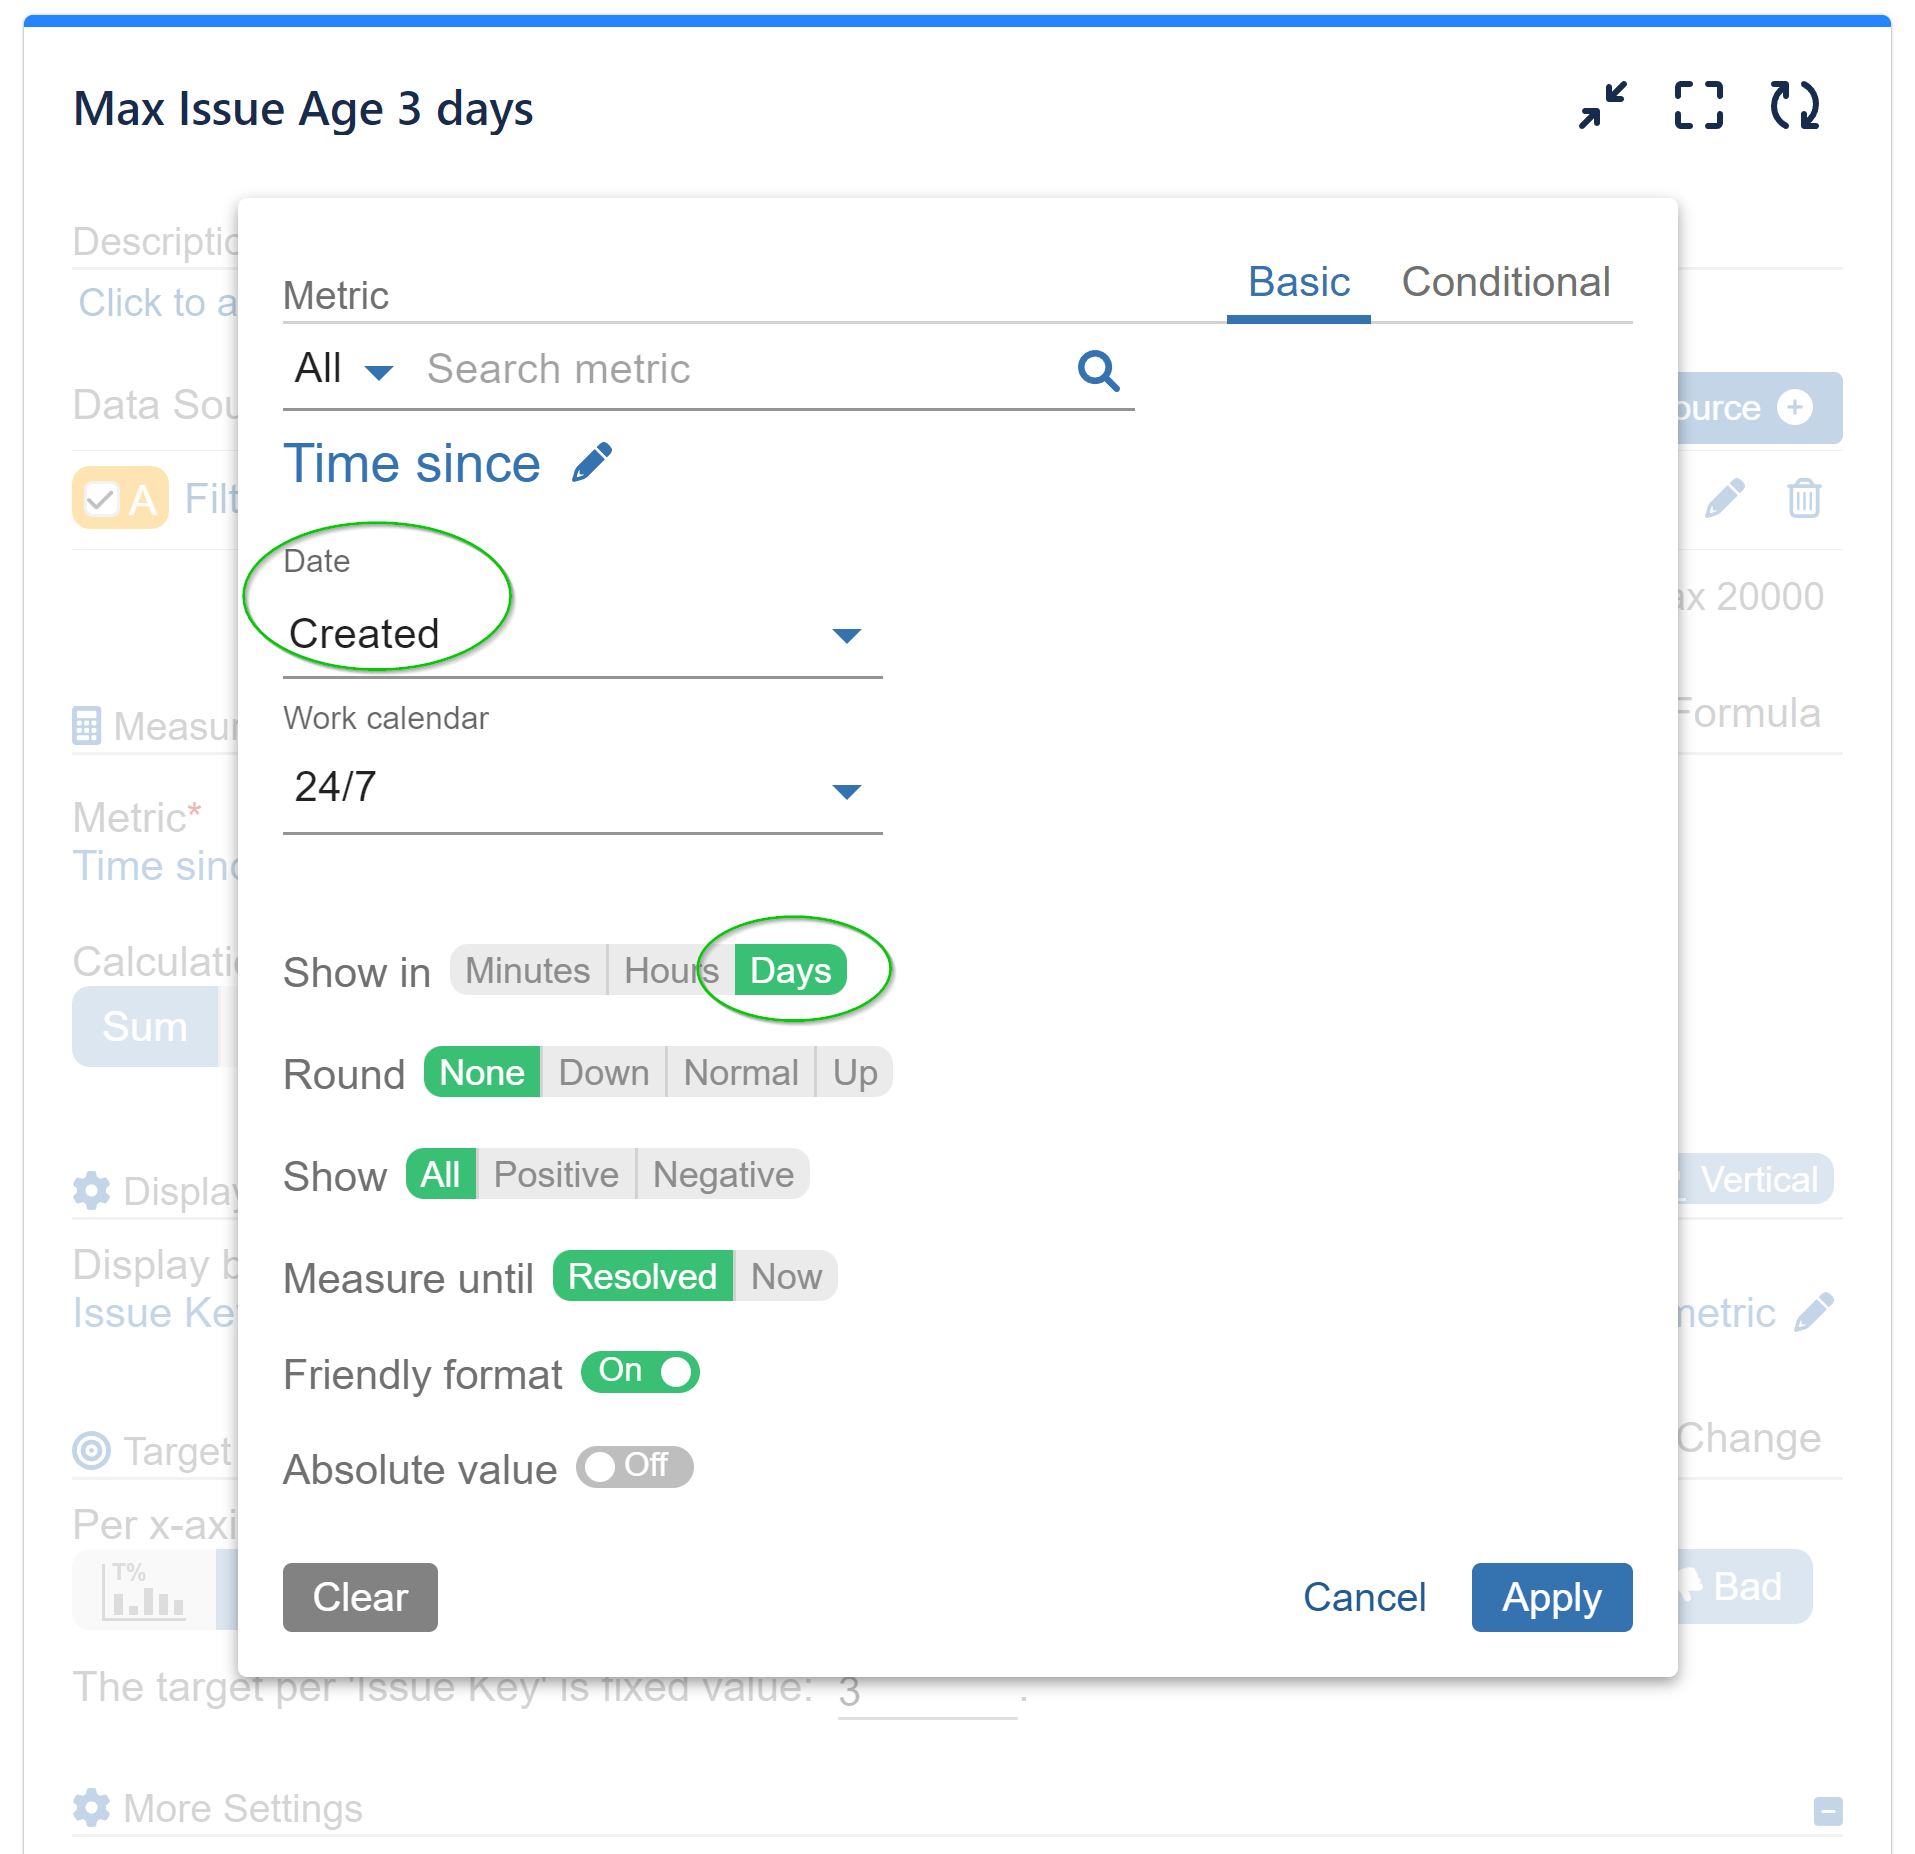
Step 2: Select the metric ‘Time since’ and pick the ‘Created’ Jira date field for ‘Event’. Apply customizations based on your preferences. Please not that the ‘Measure until’ button is set to until resolved by default. You can keep it like this as it won’t affect issue age of open issues, which is the aim of our report. Its behavior is explained in the Time Since metric article.
Step 3: Use ‘Issue Key’ or ‘Issue summary’ for ‘Display by’ to get metric data distinguished by Jira issue.
Step 4: (Optional) Use ‘Stacked by’ mode to see the metric distribution by any chosen field, metric, or data source. In the provided example, we have not utilized the stack option.
Step 5 Choose vertical orientation of the chart. It will allow more items to fit on the y-axis, as the height in Jira dashboard is better suited to be extended.
Step 6: Switch on Target section and leave the ‘Fixed’ tab selected.
Step 7: Set target results to be calculated against each x-axis item.
Step 8: Define target level. In the sample configuration it is 3 days.
Step 9: Mark target as negative by setting ‘Exceeding’ is: ‘Bad’. Therefore, if the target is exceeded, the results will be colored in red.
Step 10: Under ‘More Settings’ section, enable the ‘Warning threshold’ and set a number as fixed value or as % of target. It will color the results above that level and below target in Amber.
Step 11: Enable the ‘Custom Target Label’ and set label to indicate the negative type of the Target on the chart, e.g., ‘Max age (d)’.
View the recorded video encompassing the provided configuration steps:
Additional Time-Based Reporting Options with the ‘Time Since’ Metric
You can further utilize the ‘Time since’ metric within the Performance Objectives gadget to generate reports based on various standard or custom Jira date fields. Explore the diverse possibilities of time-based reporting on your Jira Dashboard using the ‘Time Since’ metric. Here are a few examples of the types of reports you can create with this app:
- Time passed since ‘Updated’
- Time since First date in status ‘In Progress’
- Time passed since Overdue Date
- Time since ‘Status category Change’
- Time passed since ‘First day in Assignee’
By leveraging the power of the ‘Time since’ metric in the Performance Objectives app, you can gain valuable insights into the timing and duration of various events within your Jira projects. Customize your reports based on the specific date fields that are relevant to your workflow and enhance your overall project management and performance monitoring.
Related articles: Time in status, Time in assignee, Time between, Work calendars.
Start your 30 days free trial of Performance Objectives: Charts for Jira from Atlassian Marketplace.