Jira’s built-in reporting primarily supports Agile (particularly Scrum) teams, focusing on collective achievements, team velocity, and story completion, rather than on each developers individual velocity. However, some businesses require a hybrid approach due to not following strictly core agile principles and practices. Users on the Atlassian Community often seek advice regarding personal velocity reporting, which is where the Performance Objectives: Charts for Jira app comes in.
With its robust data segmentation and target calculation options, the app empowers you to create Personal Velocity KPI reports directly on your Jira dashboards.
It’s crucial to bear in mind that Scrum revolves around delivering value, and velocity merely provides a rough estimate of what your team can accomplish in a sprint based on historical averages. Embracing individual velocity comparison might entail the risk of diminished teamwork, collaboration, and inaccurate story point estimation.
Create Personal Velocity Report in Jira: Align Goals with Individual Capacity and Performance
Performance Objectives and Performance Trend gadgets support target calculations, which will allow you to set individual targets aligned with the developer’s unique capacity, availability, and seniority and allow you to track in real time progress against the percentage of overall story points achieved per sprint for the specified evaluation period.
With our app, the goal-setting process in Jira is simplified yet powerful. In our use case, the objective is to set a performance goal for an individual to complete a higher number of story points per sprint. The goal is based on analyzing historical moving average data from all previous sprints. By leveraging the moving average trend, a realistic and achievable target is established, encouraging continuous improvement in individual performance.
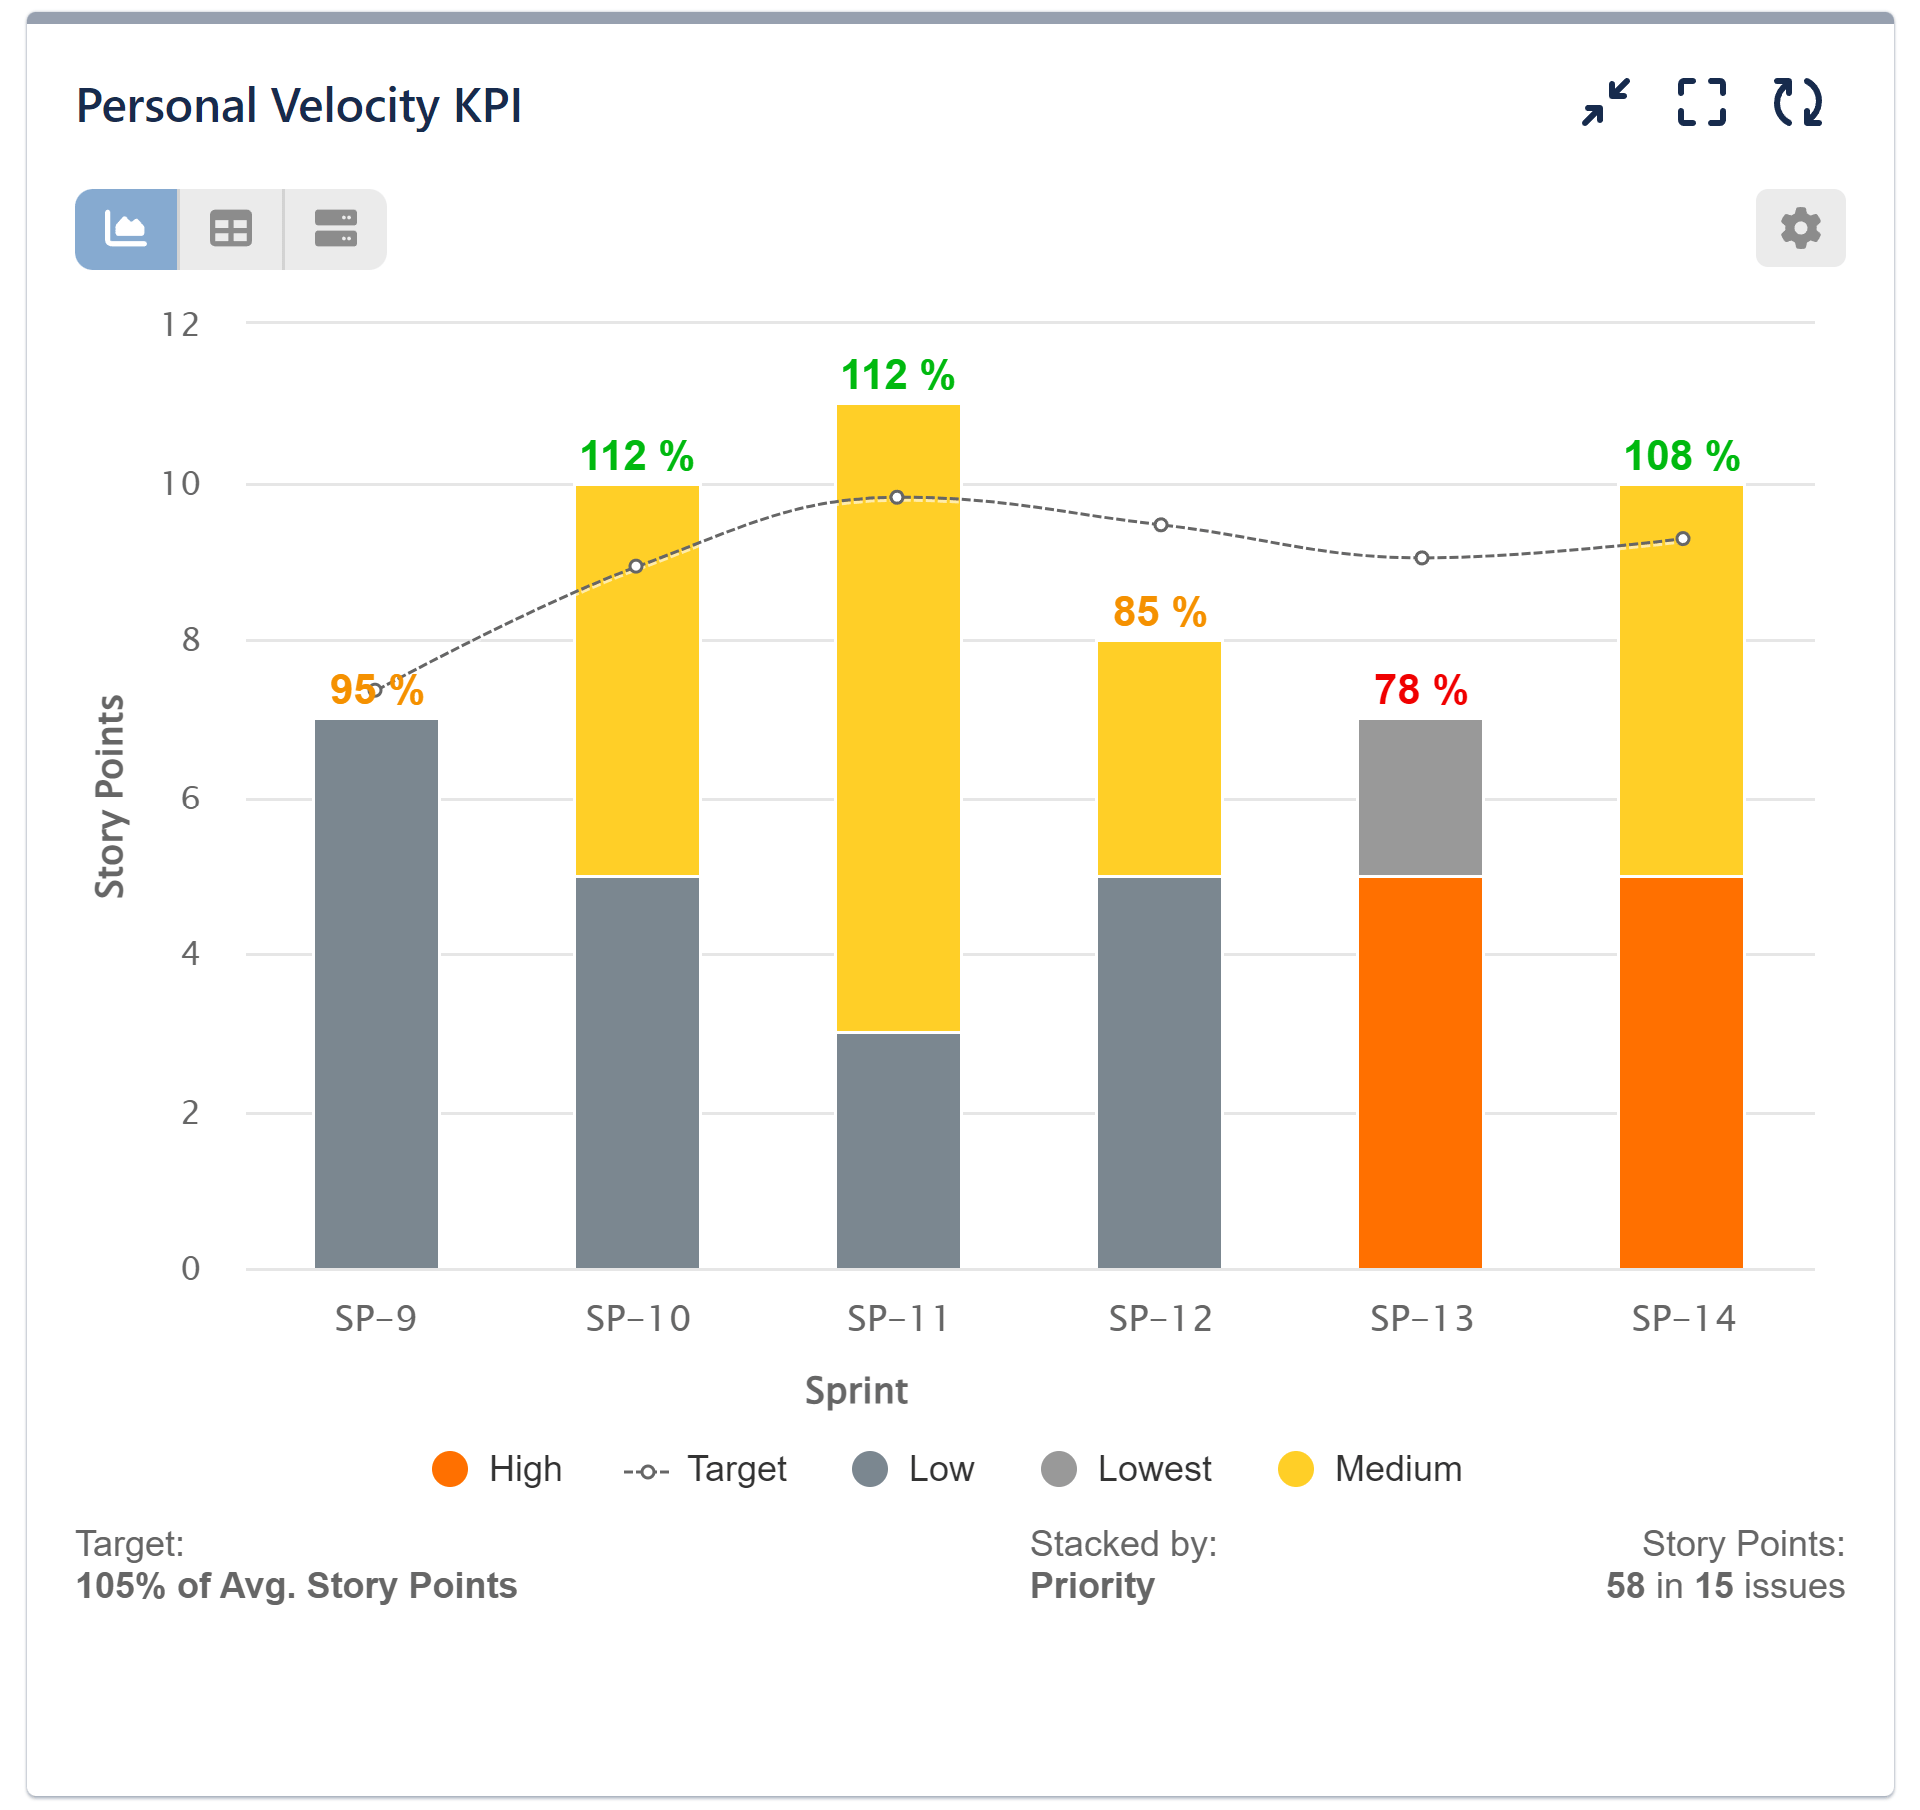
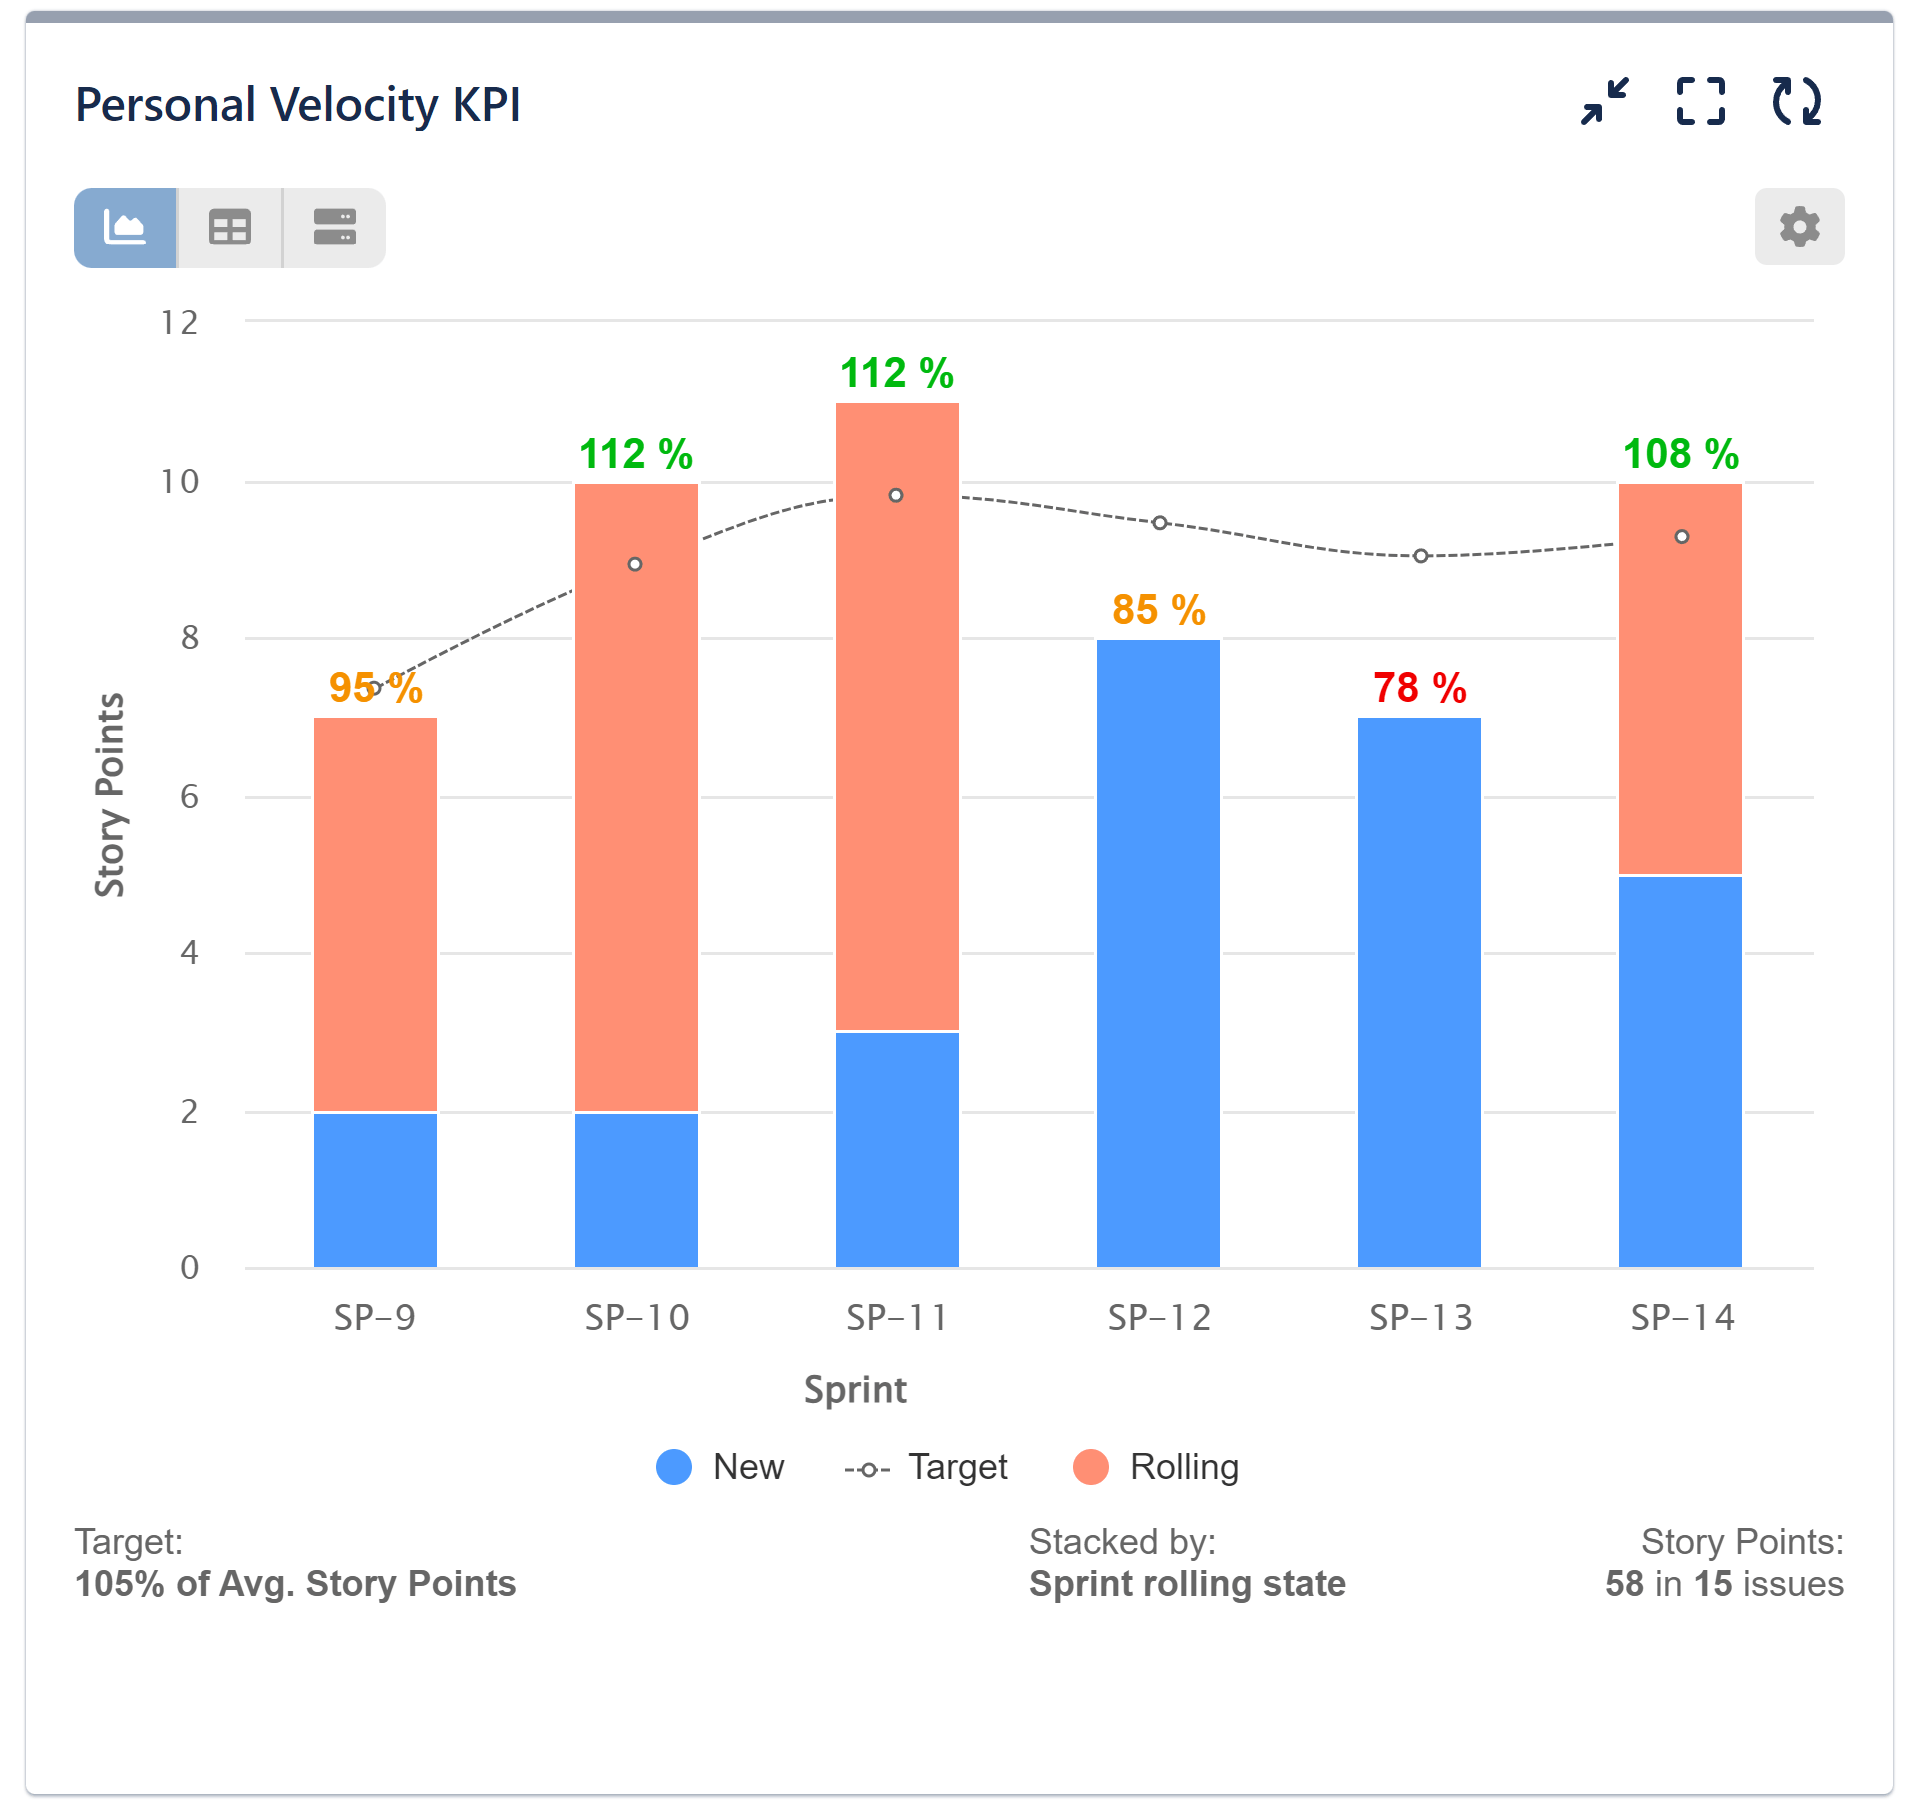
In our illustrative charts, we have additionally defined a threshold of 80% of the total target to serve as early indicator of reduced productivity. The left-side image shows story points results stacked by issue type, while the chart on the right showcases the results according to priority.
Here’s a step by step guide for a personal velocity improvement report in Jira:
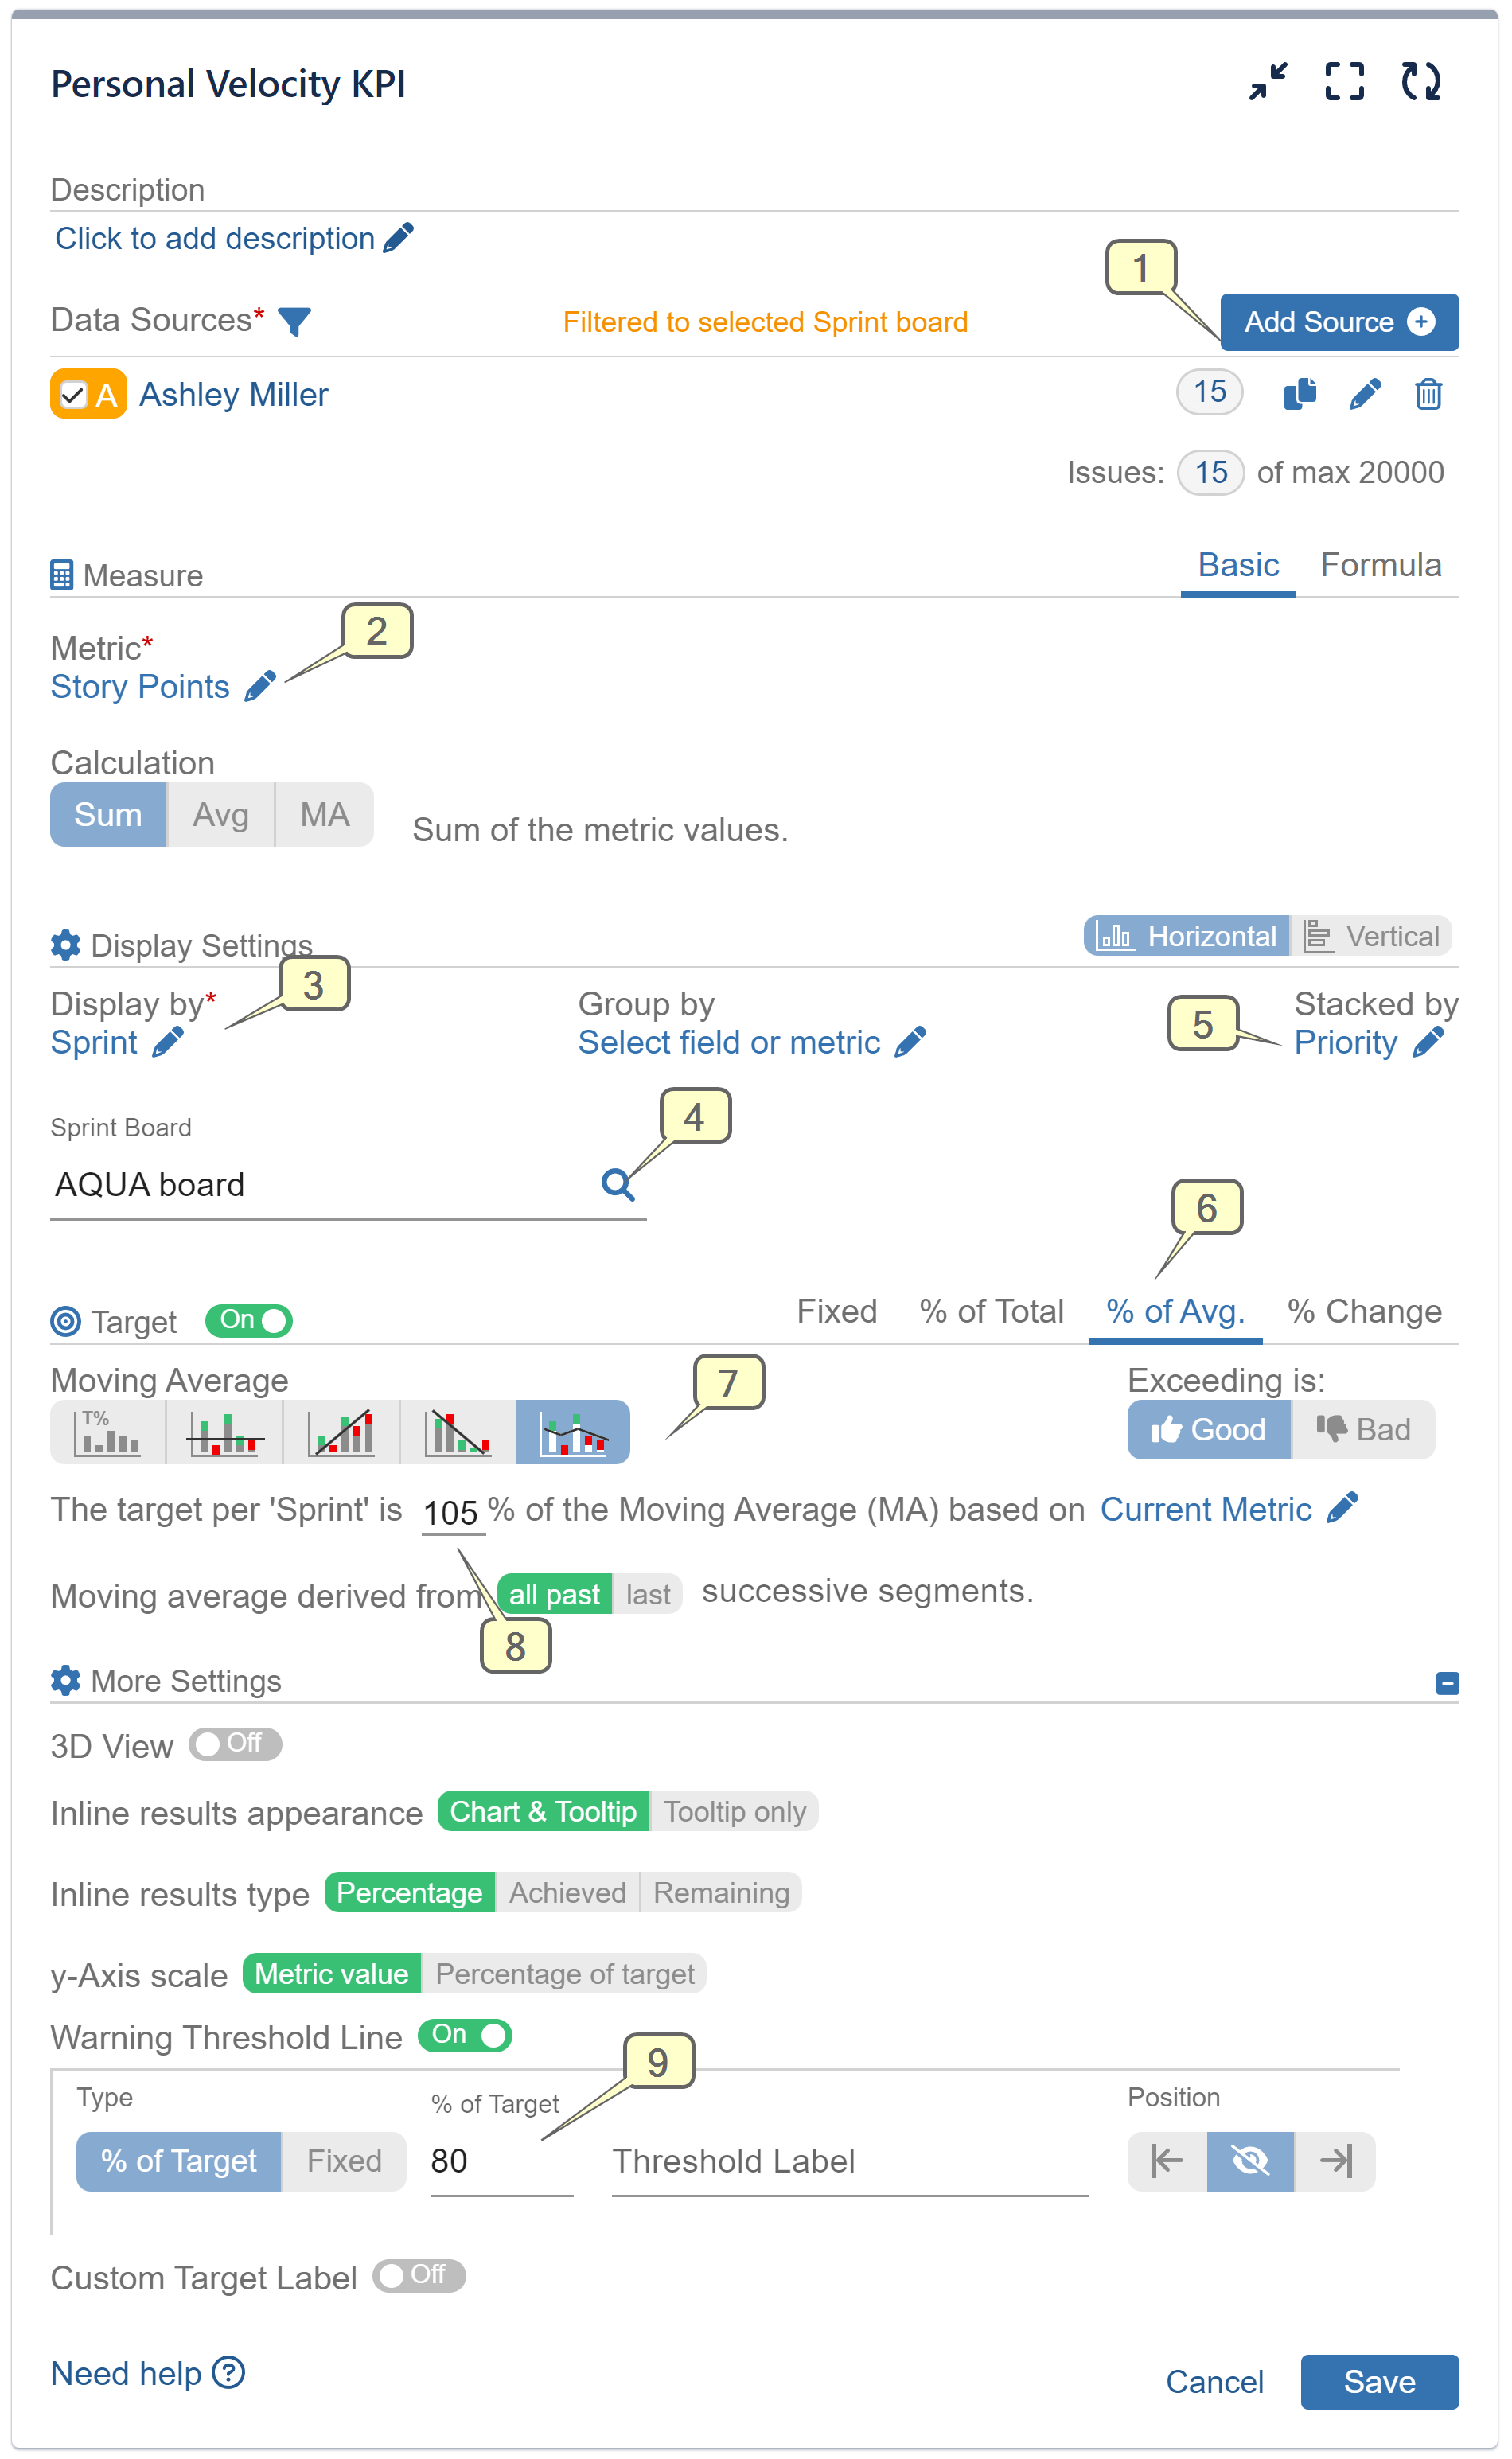
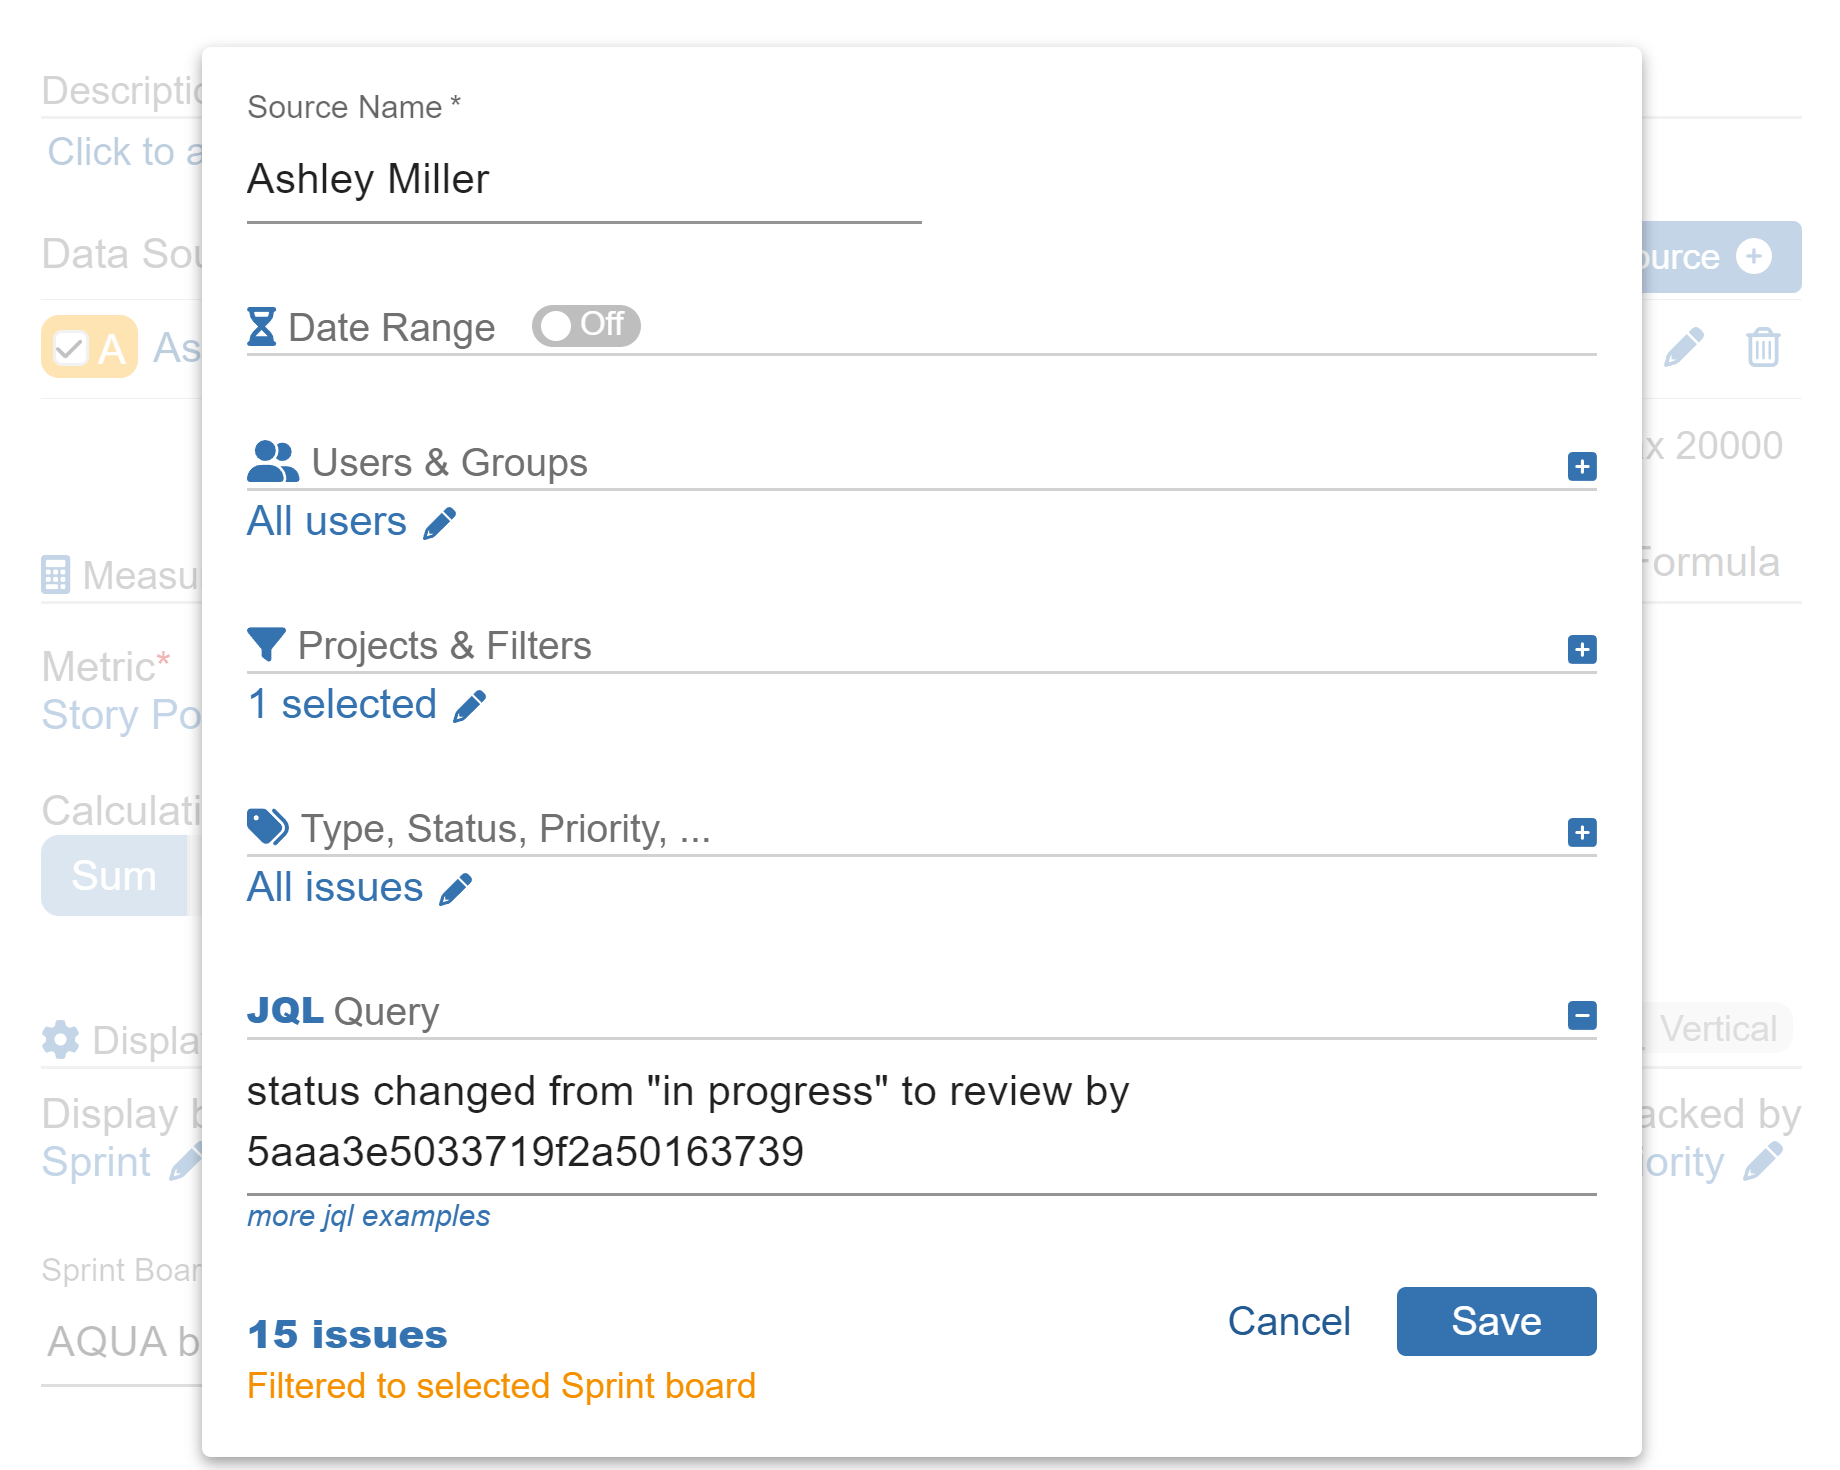
Step 1: Begin by defining a data source that identifies the issues to which a particular user has contributed.
Step 2: Choose ‘Story Points’ as the metric for evaluation.
Step 3: Select ‘Sprint’ for the ‘Display by’ field. To filter story points accomplished within the sprint, choose “Resolved in.”
Step 4: Whenever you opt to display results by Sprint, you’ll have to select a Sprint board to generate the report. This step is mandatory and ensures accurate sprint reporting.
Step 5: (Optional) Opt for ‘Priority’ for ‘Stacked by’ or any other fields that makes sense in your case.
Step 6: Activate the ‘Target’ section, and select the ‘% of Avg.’ tab.
Step 7: Choose Moving average as target level calculation type.
Step 8: Define the target level % and the number of sprints to calculate the Moving average (MA). In our example we are using MA derived from all past sprints. This minimizes short-term fluctuations, ensuring attention to long-term progress.
Step 9: (Optional) Activate the Warning Threshold Line if desired and determine the threshold – it can either be a fixed value or a percentage of the chosen target, depending on your preference.
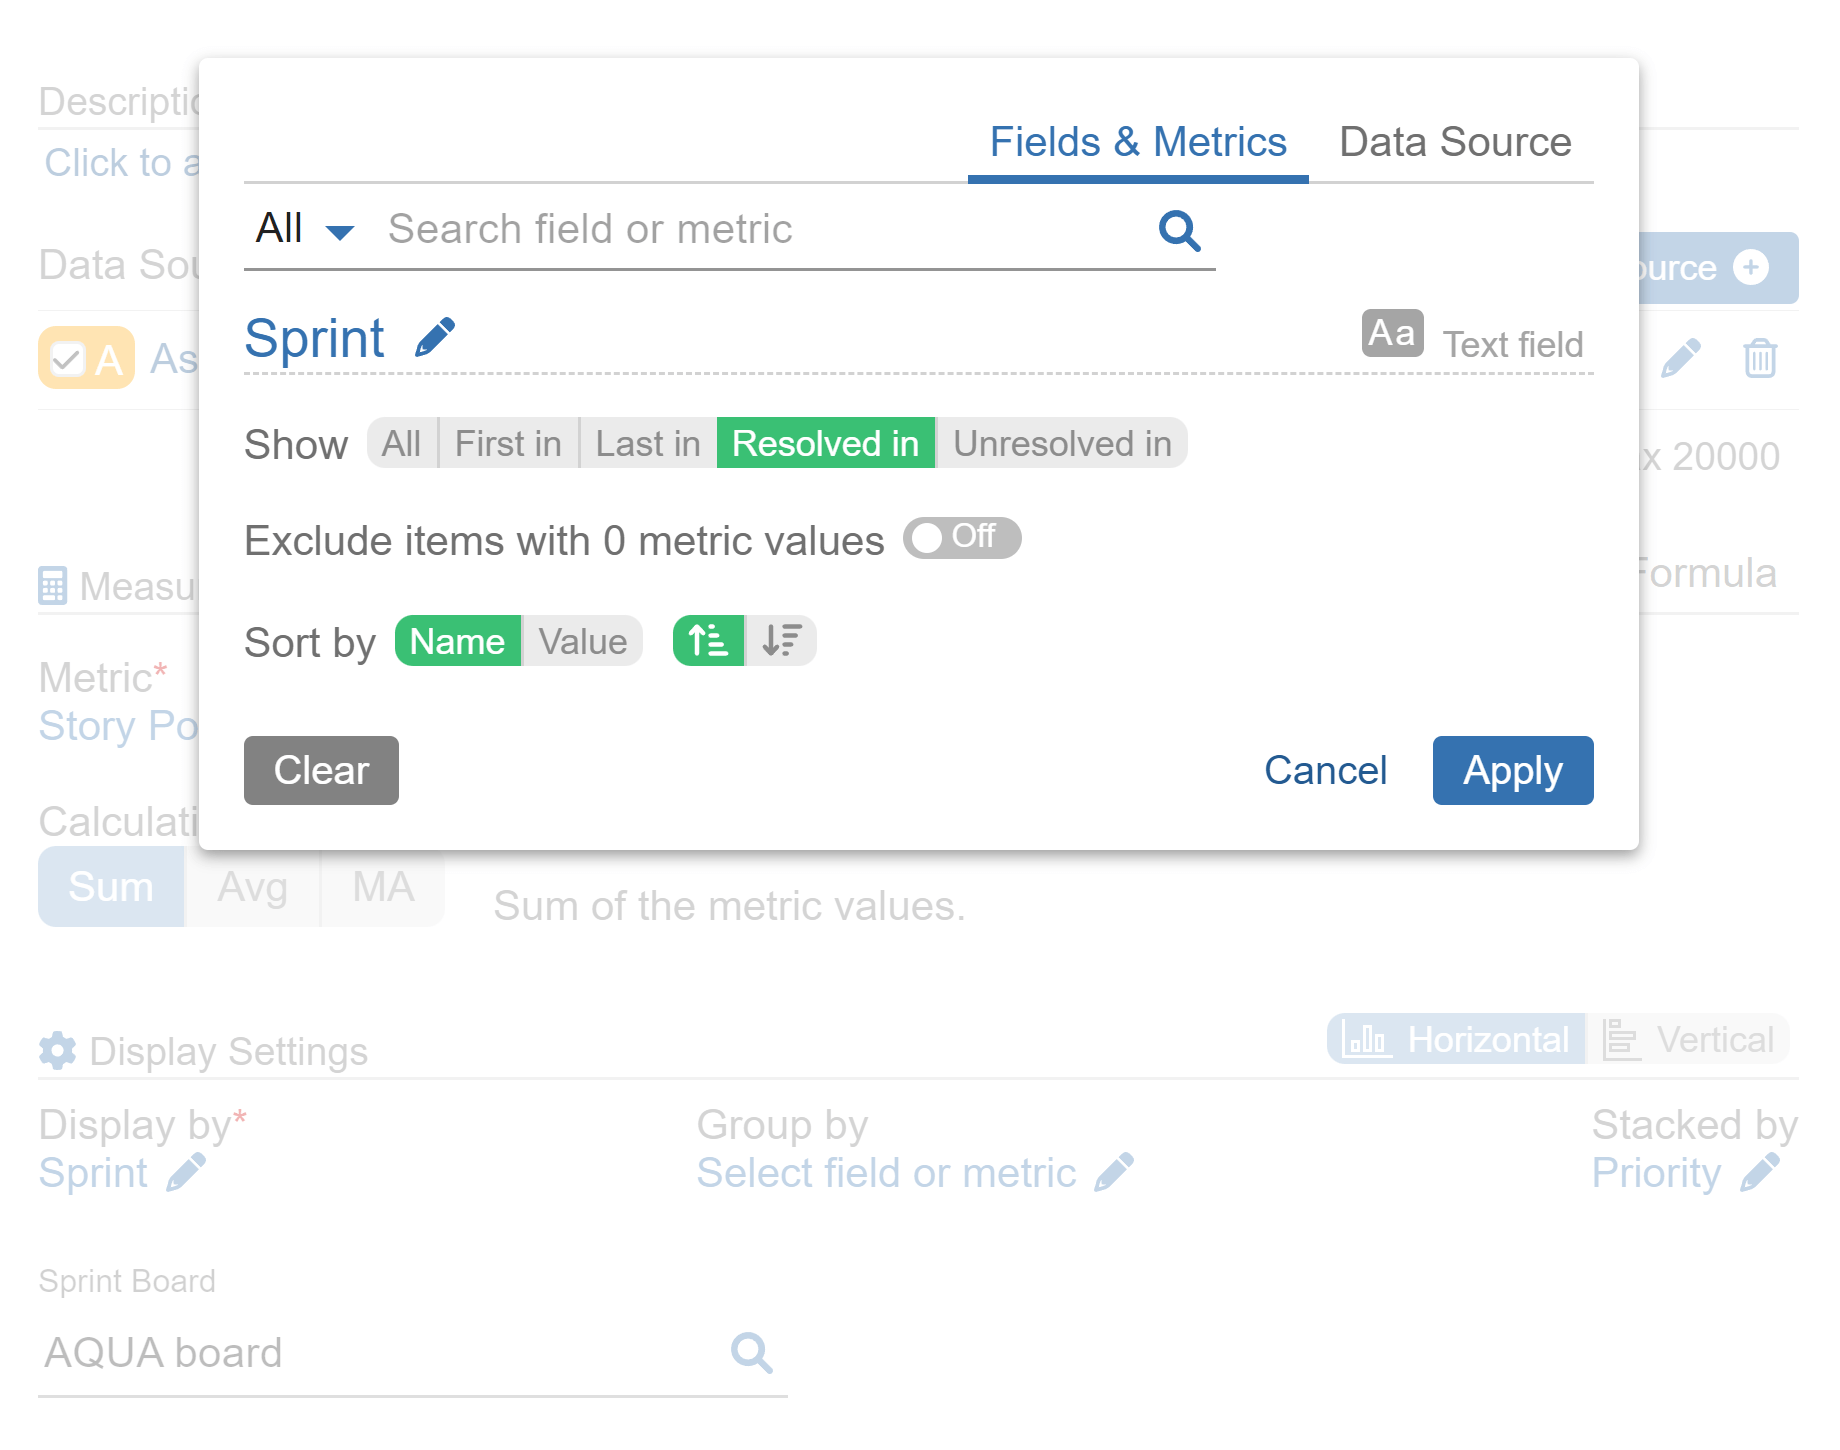
Note that With Performance Objectives: Charts for Jira, you gain enhanced sprint segmentation options. This enables you to filter issues across various scenarios, such as viewing issues in all sprints they were present, by the first/last sprint they appeared in, or by their resolved/unresolved status within a sprint. Opting for “Resolved in” sprint ensures the most precise representation of velocity on your dashboard.
Here are some examples of how to refine the selection of issues linked to a specific developer’s work using JQL in your Data Source settings. Please keep in mind that these examples are provided for illustration purposes, and you should adapt the filters based on your specific workflow.
- status changed from “In Progress” to “Resolved” BY 5aaa3e5033719f2a50163739
- status changed from “In Progress” to “Review” BY 5aaa43618fb3642a6fd215e5
- resolution changed to “done” by 5aaa3e5033719f2a50163739
- assignee = Account ID
Important Note: Presently, Jira’s JQL “By” predicament does not display names, necessitating the use of user’ Account IDs instead. To obtain the Account ID of your team members, simply access their user profile and find the Account ID within the URL of the page. The URL will typically resemble this format:
https://****.atlassian.net/people/5aaa3e5033719f2a50163739, where 5aaa3e5033719f2a50163739 is the Account ID.
For more information on this topic, you can refer to Atlassian developer’s blog.
Watch the recording that guides you through the process of creating a Personal Velocity report in Jira using our app, providing clear step-by-step instructions.
Explore more insights in our related articles: Team Velocity report, Complexity vs Performance.
Start your 30 days free trial of Performance Objectives: Charts for Jira from Atlassian Marketplace.