Table of Contents
Accurate Tracking of Work Log Time by Work Log Author with Performance Objectives App
As highlighted in our blog post, it’s important to note that the Jira system field ‘Time Spent’ might not always provide the precise time results you anticipate when reviewing worklogs for specific periods such as months, weeks, or days. Choosing the right metric and configuring the display by field is paramount for ensuring accurate worklog time tracking reports. However, another important factor is selecting the right filters in the data source to precisely capture the timeframe of when logs occurred. An issue may have multiple ‘Work Logged Date’ entries due to multiple worklog instances from different team members who worked on the issue (i.e., ‘Work Log Authors’).
The Performance Objectives provides a selection of ready-to-use metrics and fields designed to read, calculate, and present data from your issue history. Among our app’s supported metrics and fields, for precise worklog tracking and reporting, consider using:
M
F
F
F
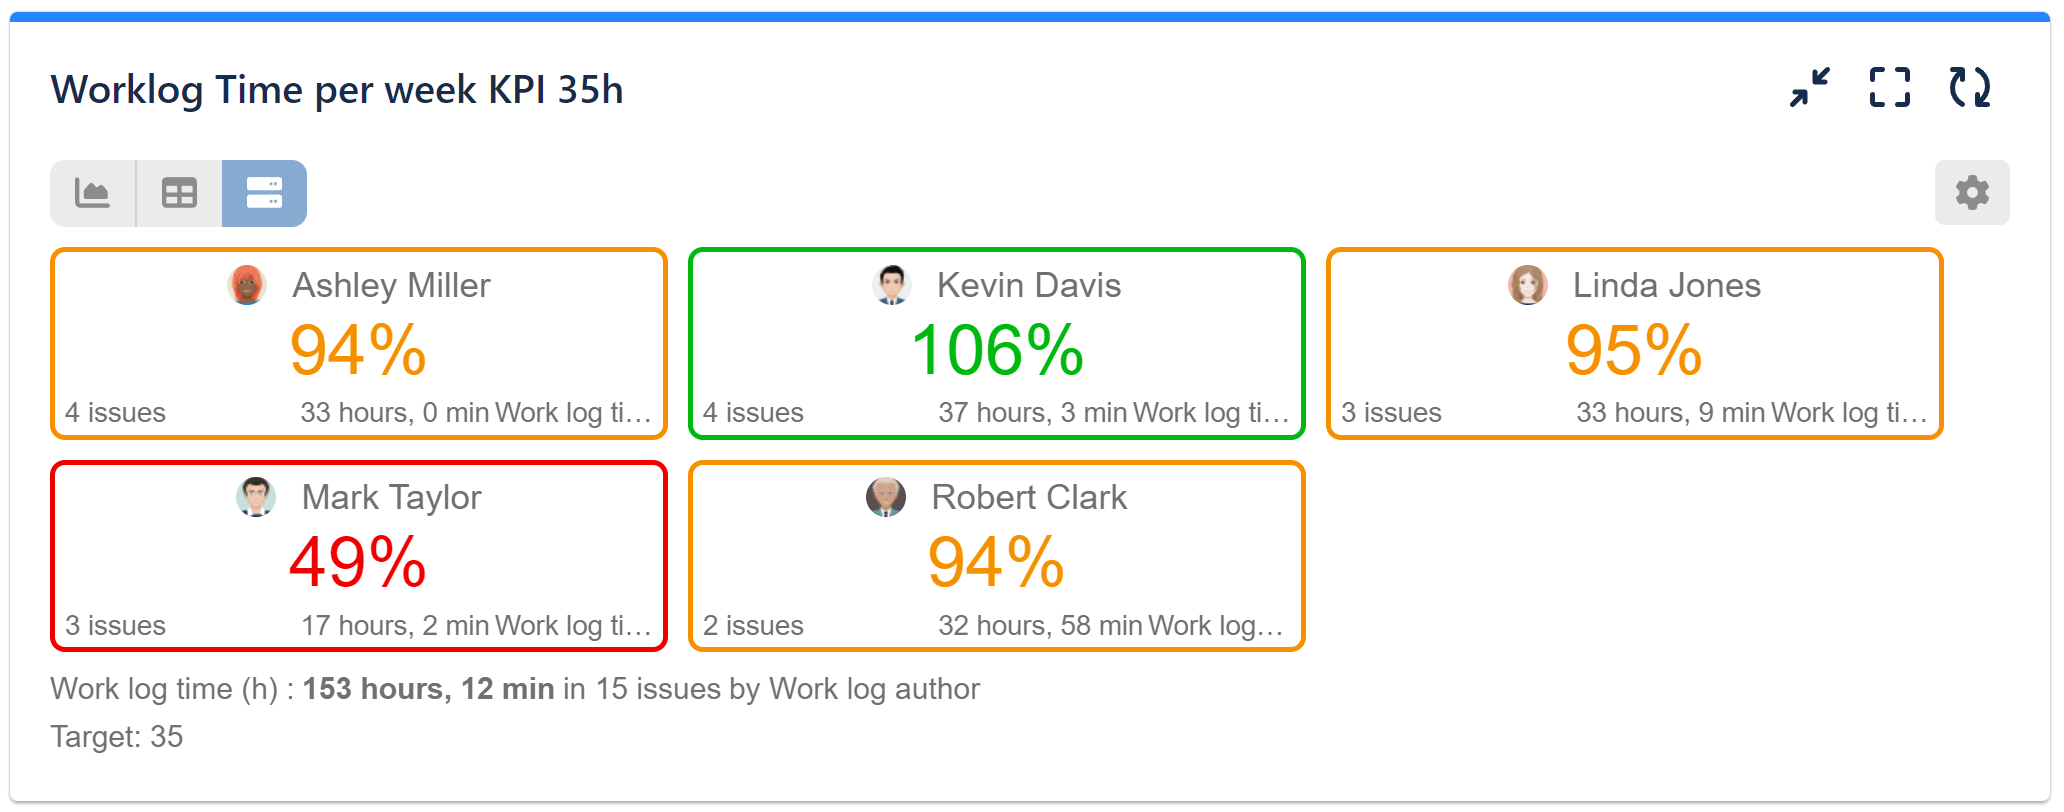
Here’s an accurate “Last Week’s Work Log Time by Work Log Author” report. We’ve leveraged the Target feature within the app to establish a goal of a minimum of 35 work hours logged per week for each employee (Work Log Author).

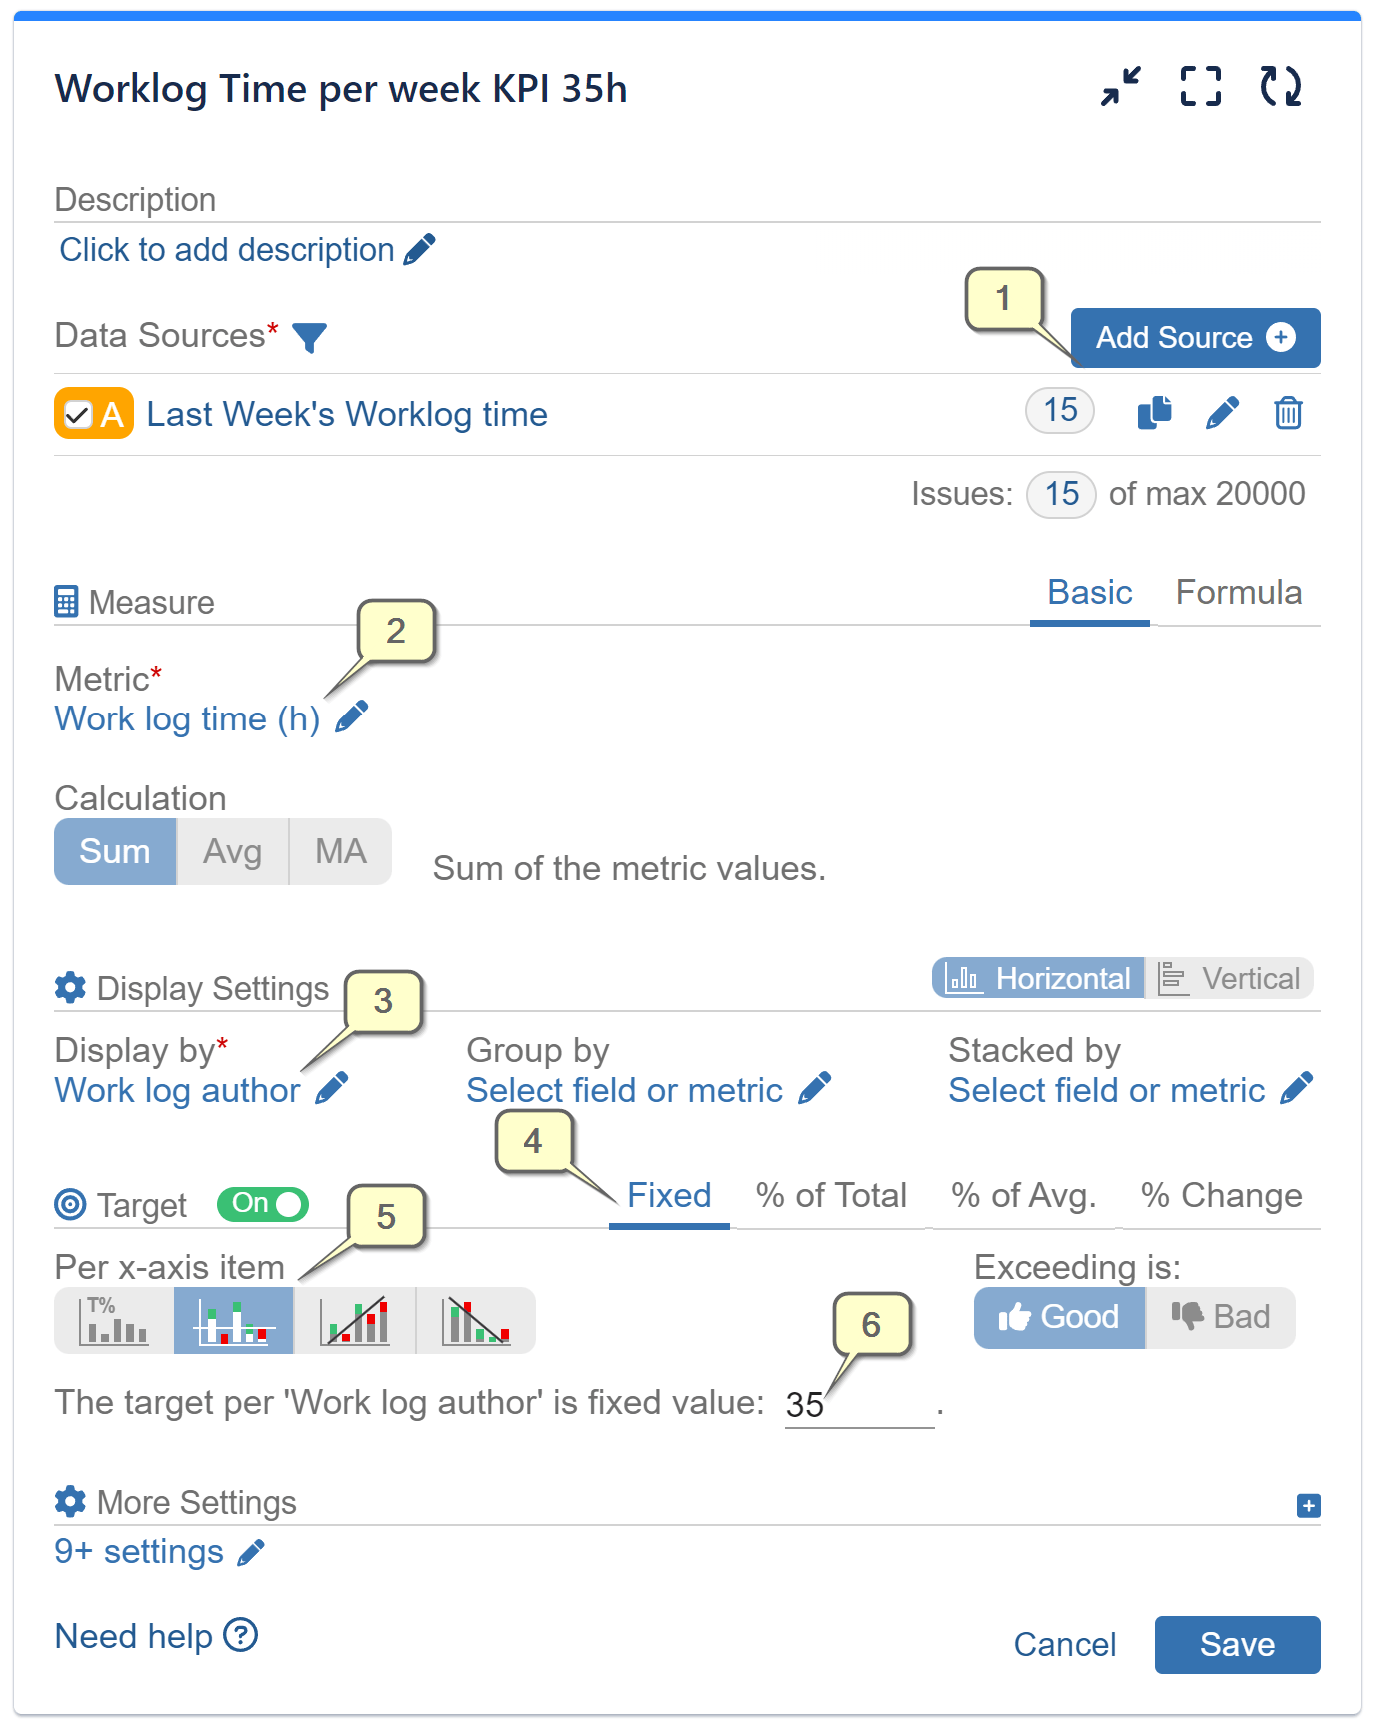
Here are the steps you can follow to create a precise worklog tracking report with a predefined target using our app:
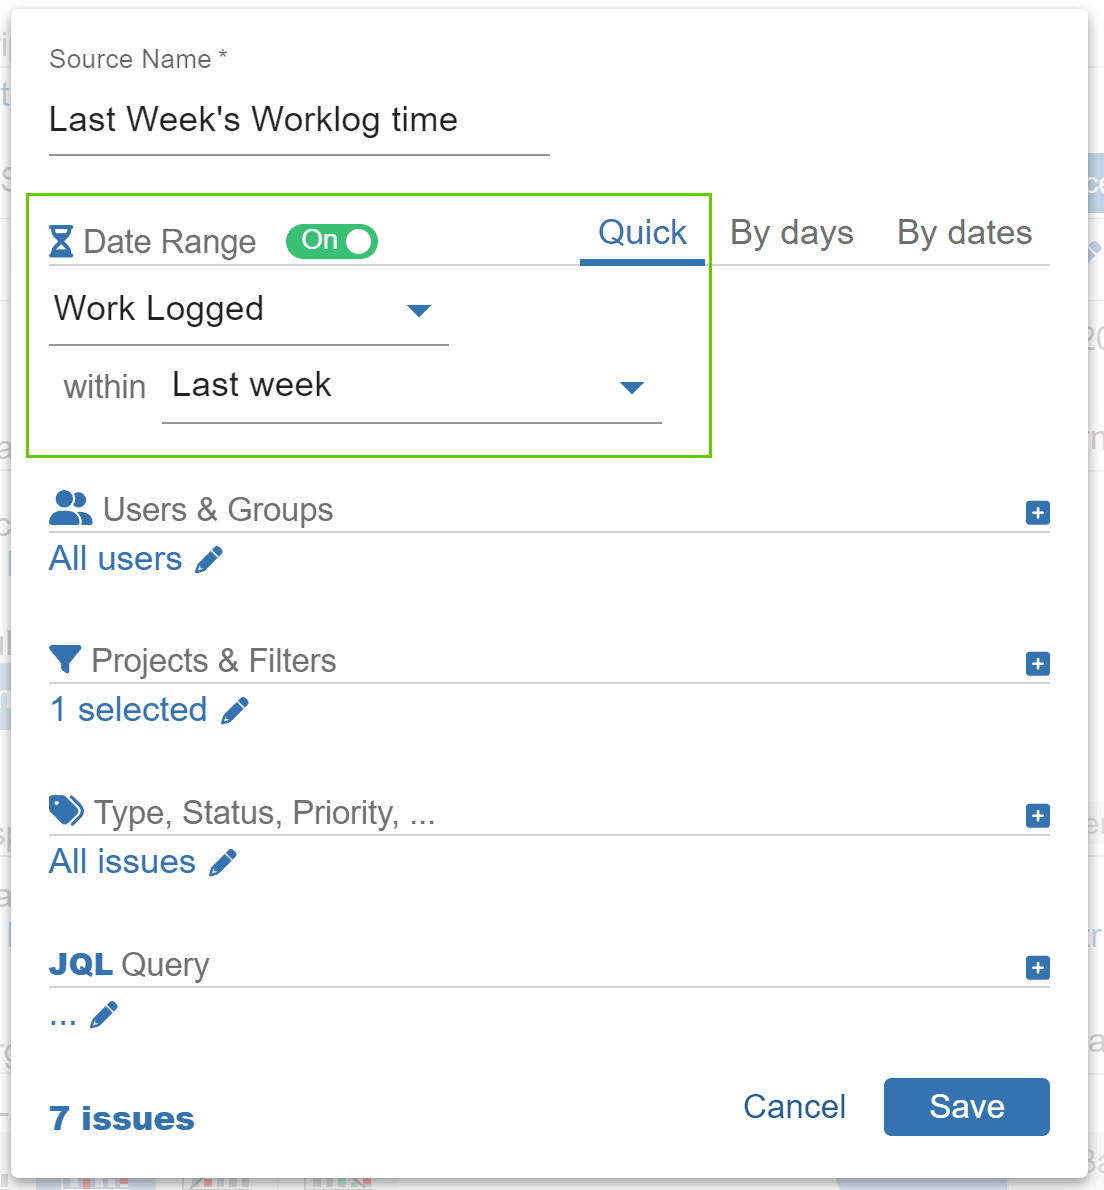
Step 1: In your Data Source, select Work Logged issues and choose the date range you are interested in. In our sample, this is Last Week.
Step 2: Choose the metric ‘Work Log Time (h)’
Step 3: For Display By, select “Work Log Author” field
Step 4: Turn the Target feature on and select “Fixed Target”
Step 5: Choose “Per x-axis item” type of target calculation
Step 6: Add a specific value for the target. In our sample, we have defined 35 hours per week as the goal.

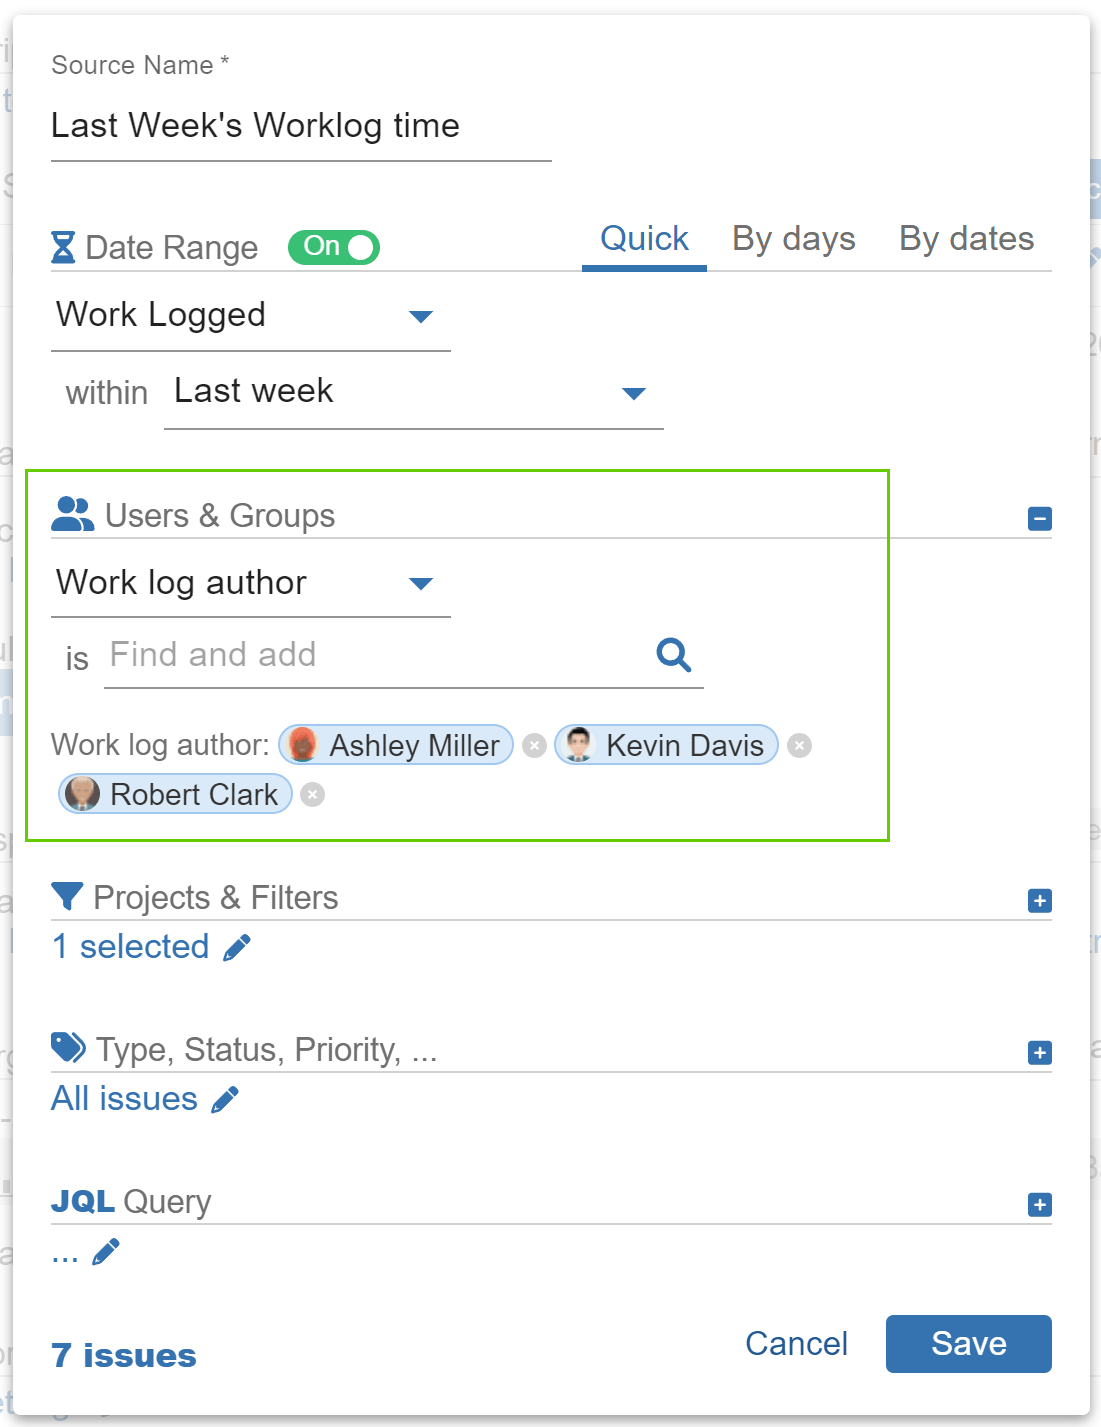
Below is a detailed configuration of the Data Source for Step 1. On the right image, we have applied additional filtering of the data source by ‘Work Log Author’. This approach is useful if you wish to narrow the results only to specific team members who have worked on and logged time for your project issues.


Additionally, we have set the default view of the Performance Objectives gadget to Tiles and have also included a threshold line as a percentage of the target. However, these steps are optional. If you wish to proceed with them, open “More Settings”.
Potential Issues with Worklog Time Tracking in Jira
In the domain of project management, precise time tracking holds utmost importance for assessing progress, allocating resources effectively, and estimating future tasks and overall capacity. Nevertheless, relying in all cases on the standard Jira field “Time Spent” can often result in misleading reports and inaccurate insights. If you want to learn more on the topic, this blog post aims to delve into the Limitations of Reporting on Time Spent by Assignee in Jira. Additionally, here is a comprehensive list with detailed explanations of why alternative configurations may not yield the expected results in the “Last Week’s Work Log Time by Work Log Author” scenario.
- If we report by the metric ‘Work log time (h)’ and display by the field ‘Assignee’, it will allocate the total work logs on the issue to the last assignee of the issue.
- If we filter the data using the ‘Created’ date field for a specific time period and display it by ‘Time Spent’, the results may not include issues that have been worked on but were created before the selected time period.
- Moreover, if we show data by date field ‘Created’ instead of ‘Work Logged’ the whole time will be accounted to the ‘Created’ date, which won’t be correct.
In the example above, we’ve utilized the Performance Objectives gadget in Tiles view. However, our app offers 10 versatile gadgets supporting various chart types. Check out our Heat Map Gadget article to understand why the heat map is the most suitable chart type for tracking worklogs in Jira.
To explore more about our app’s features, refer to the User Guide, gain inspiration from our KPI Examples or contact our Support team for demo or assistance!
Start your 30 days free trial of Performance Objectives: Charts for Jira from Atlassian Marketplace.