Performance Objectives: Charts for Jira allows you to track numerous Key Performance Indicators directly on your Jira dashboard. A useful KPI to monitor is the “number of defects raised outside the engineering team.” This KPI is important because bugs, defects or other problems in a software application reported by non-engineering teams could indicate issues that directly impact end-users and potentially lead to lower customer satisfaction.
When these defects are reported by teams other than engineering or QA team, such as customer or IT support, it suggests that these issues are visible to end-users and have a potential impact on their experience with the product. By tracking this KPI, a team can identify and prioritize issues that might require immediate attention to prevent negative consequences for customers. Let’s delve into how to improve your Bug Analysis and Defect tracking in Jira with Performance Trend gadget.
Number of Defects or Bugs missed by Engineering Report
Performance Objectives and Performance Trend gadgets allow for the calculation of various types of targets and the addition of warning threshold lines. These features make it possible to manage and monitor performance directly within Jira in real-time.
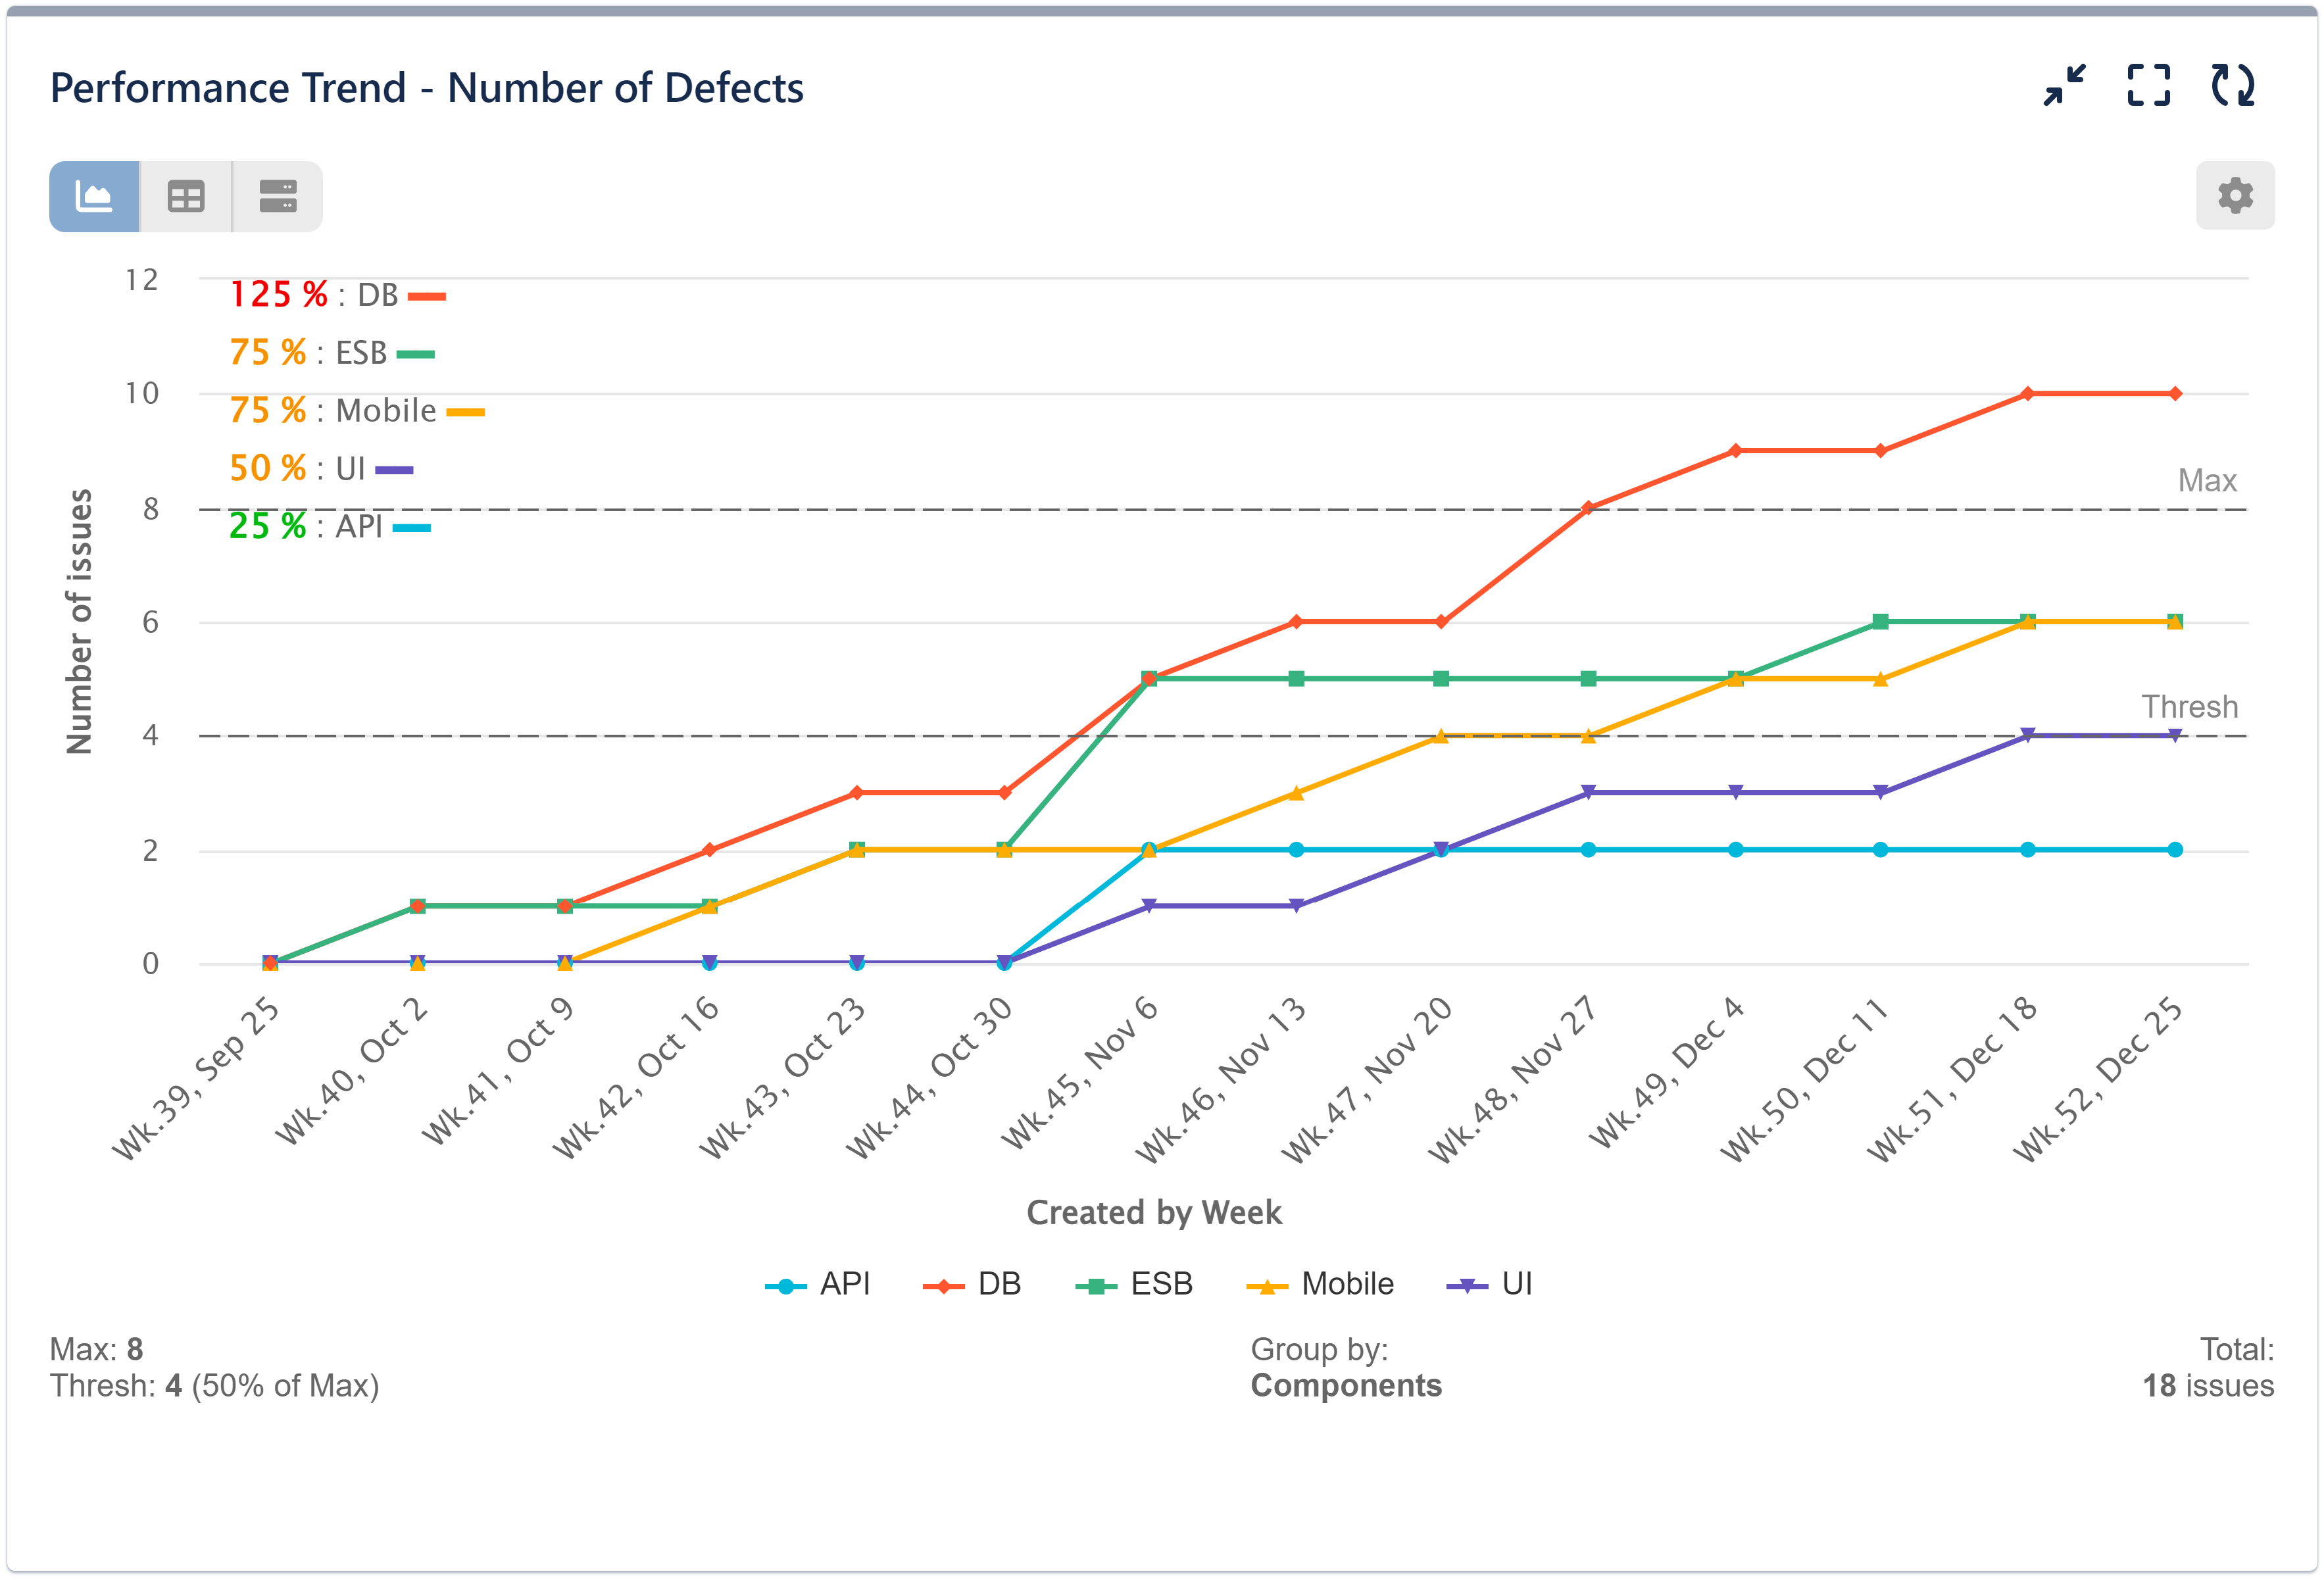
In the context of the sample chart provided below, the data source includes “Bug” type issues that are reported by teams outside of the development (dev) and quality assurance (QA) teams, using JQL. These issues are visualized on the chart, showing their accumulation on a weekly basis. The issues are also grouped by “Components,” which provides further insights into which parts of the project are affected.
By setting a target and a threshold for the number of issues reported by this specific type (bugs reported outside of dev and QA), the chart can be used to monitor the efficiency of the development process in real-time. If the actual number of issues reported exceeds the threshold, it serves as an early warning sign, allowing the team to proactively address issues that might impact customer satisfaction. This enables a more proactive strategy for managing performance and quality within the development process.
In this step-by-step guide, you’ll learn how to configure a comprehensive report in Jira to monitor the number of defects within your development process effectively:
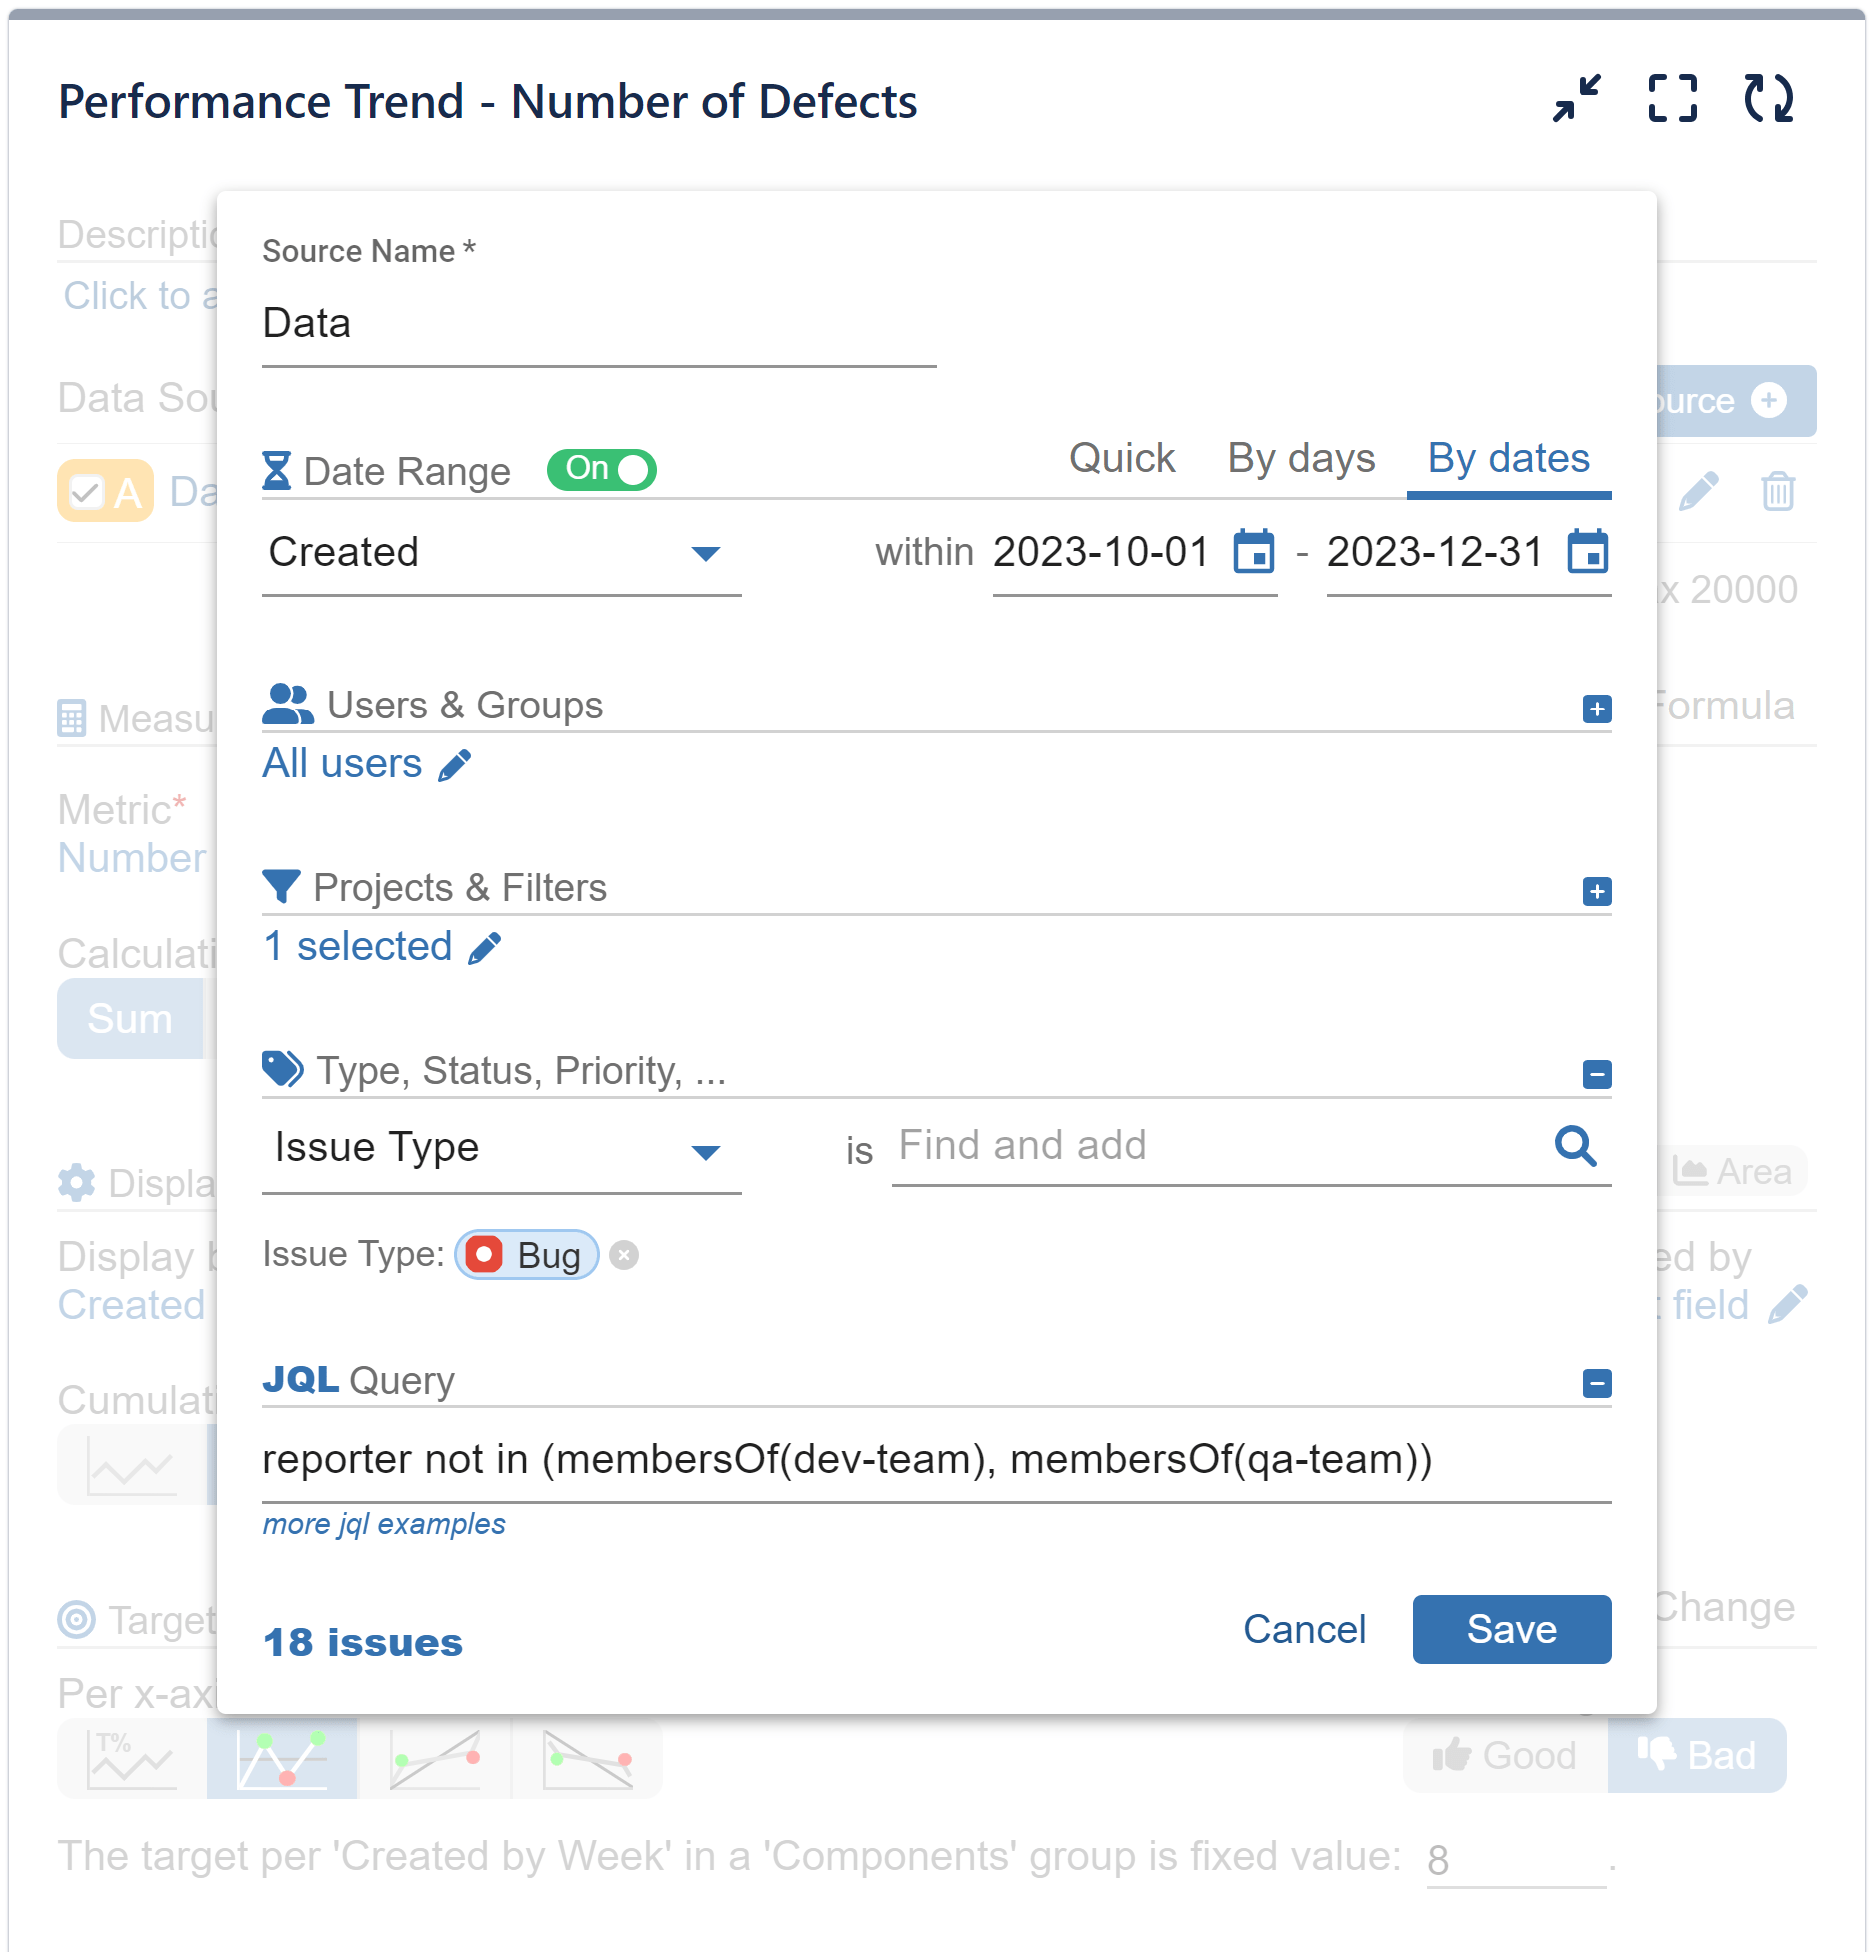
Step 1: Configure a data source that isolates issues reported outside the QA and dev teams using the following JQL query: “reporter not in (membersOf(dev-team), (membersOf(qa-team))“. Replace “dev-team” and “qa-team” with the user group names defined in your Jira instance for the development and QA teams, respectively.
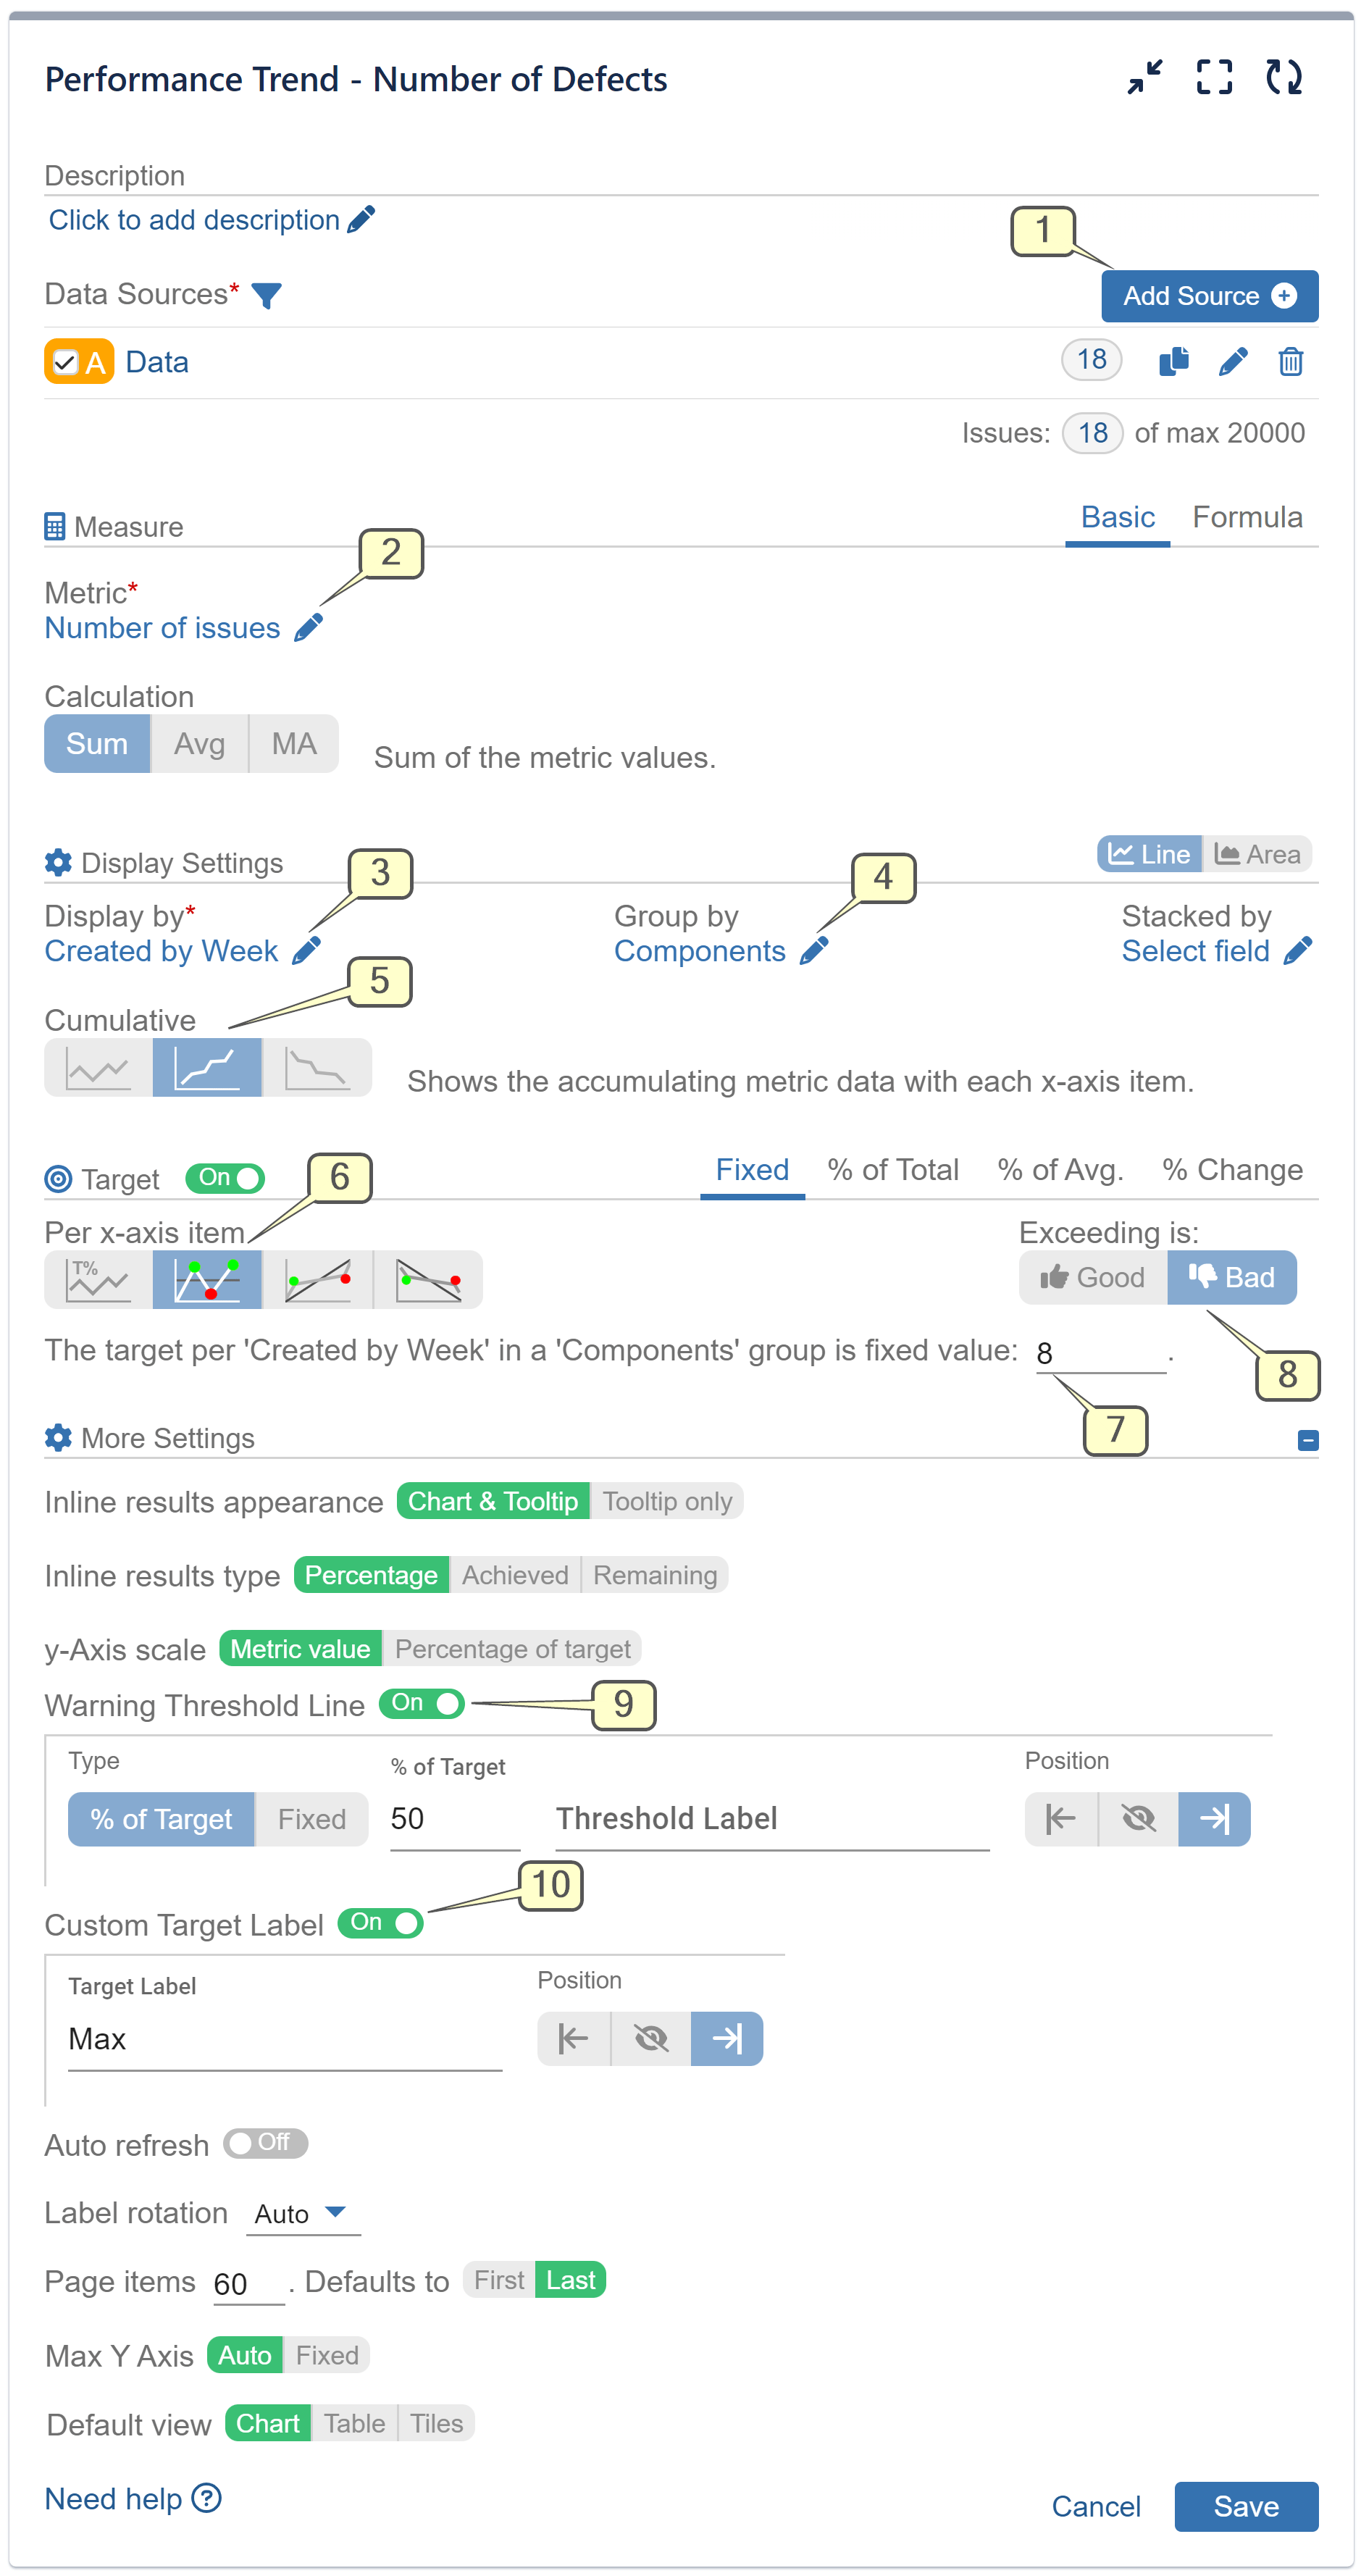
Step 2: Choose the ‘Number of Issues’ Metric
Step 3: Opt for ‘Created by Week’ as the Display By Option
Step 4: Select ‘Components’ for Group by
Step 5: Set Display Mode to ‘Cumulative’ for Accumulated Weekly Data Representation (X-axis Item)
Step 6: Activate the Target Section, Opt for ‘Fixed’ Target Type, and Configure Results Evaluation on a Weekly Basis (Aligned with X-axis Items)
Step 7: Set the target level value to a value that aligns with your data. In the provided configuration example, it’s set to ‘8’.
Step 8: Define the target as negative by selecting ‘Exceeding is’ as ‘Bad’. This selection causes any chart results that surpass the target to be displayed in red, indicating failure to achieve.
Step 9: Within the ‘More Settings’ section, enable the ‘Warning threshold’. This setting causes results above the threshold yet below the target to be displayed in amber.
Step 10: Enable the ‘Custom Target label’ option and assign a label that clearly denotes the negative target, such as ‘Max’.
Please review the provided recording demonstrating comprehensive configuration steps:
Start your 30 days free trial of Performance Objectives: Charts for Jira from Atlassian Marketplace.