Table of Contents
Define which events you want to analyze and track the average time to resolve any set of Jira issues for a project/filter. Set target as % of average time and track one of the most common Jira metrics Mean Time to Resolve.
You can track average time spent between any combination of events and break it down to understand more details about the duration of each stage, using one or more of the following configurations.
There are three different approaches to achieving this KPI depending on which Jira product you are using (Jira Software, Jira Work Management or Jira Service Management).
Please find the configuration options below using the Performance Trend dashboard gadget:
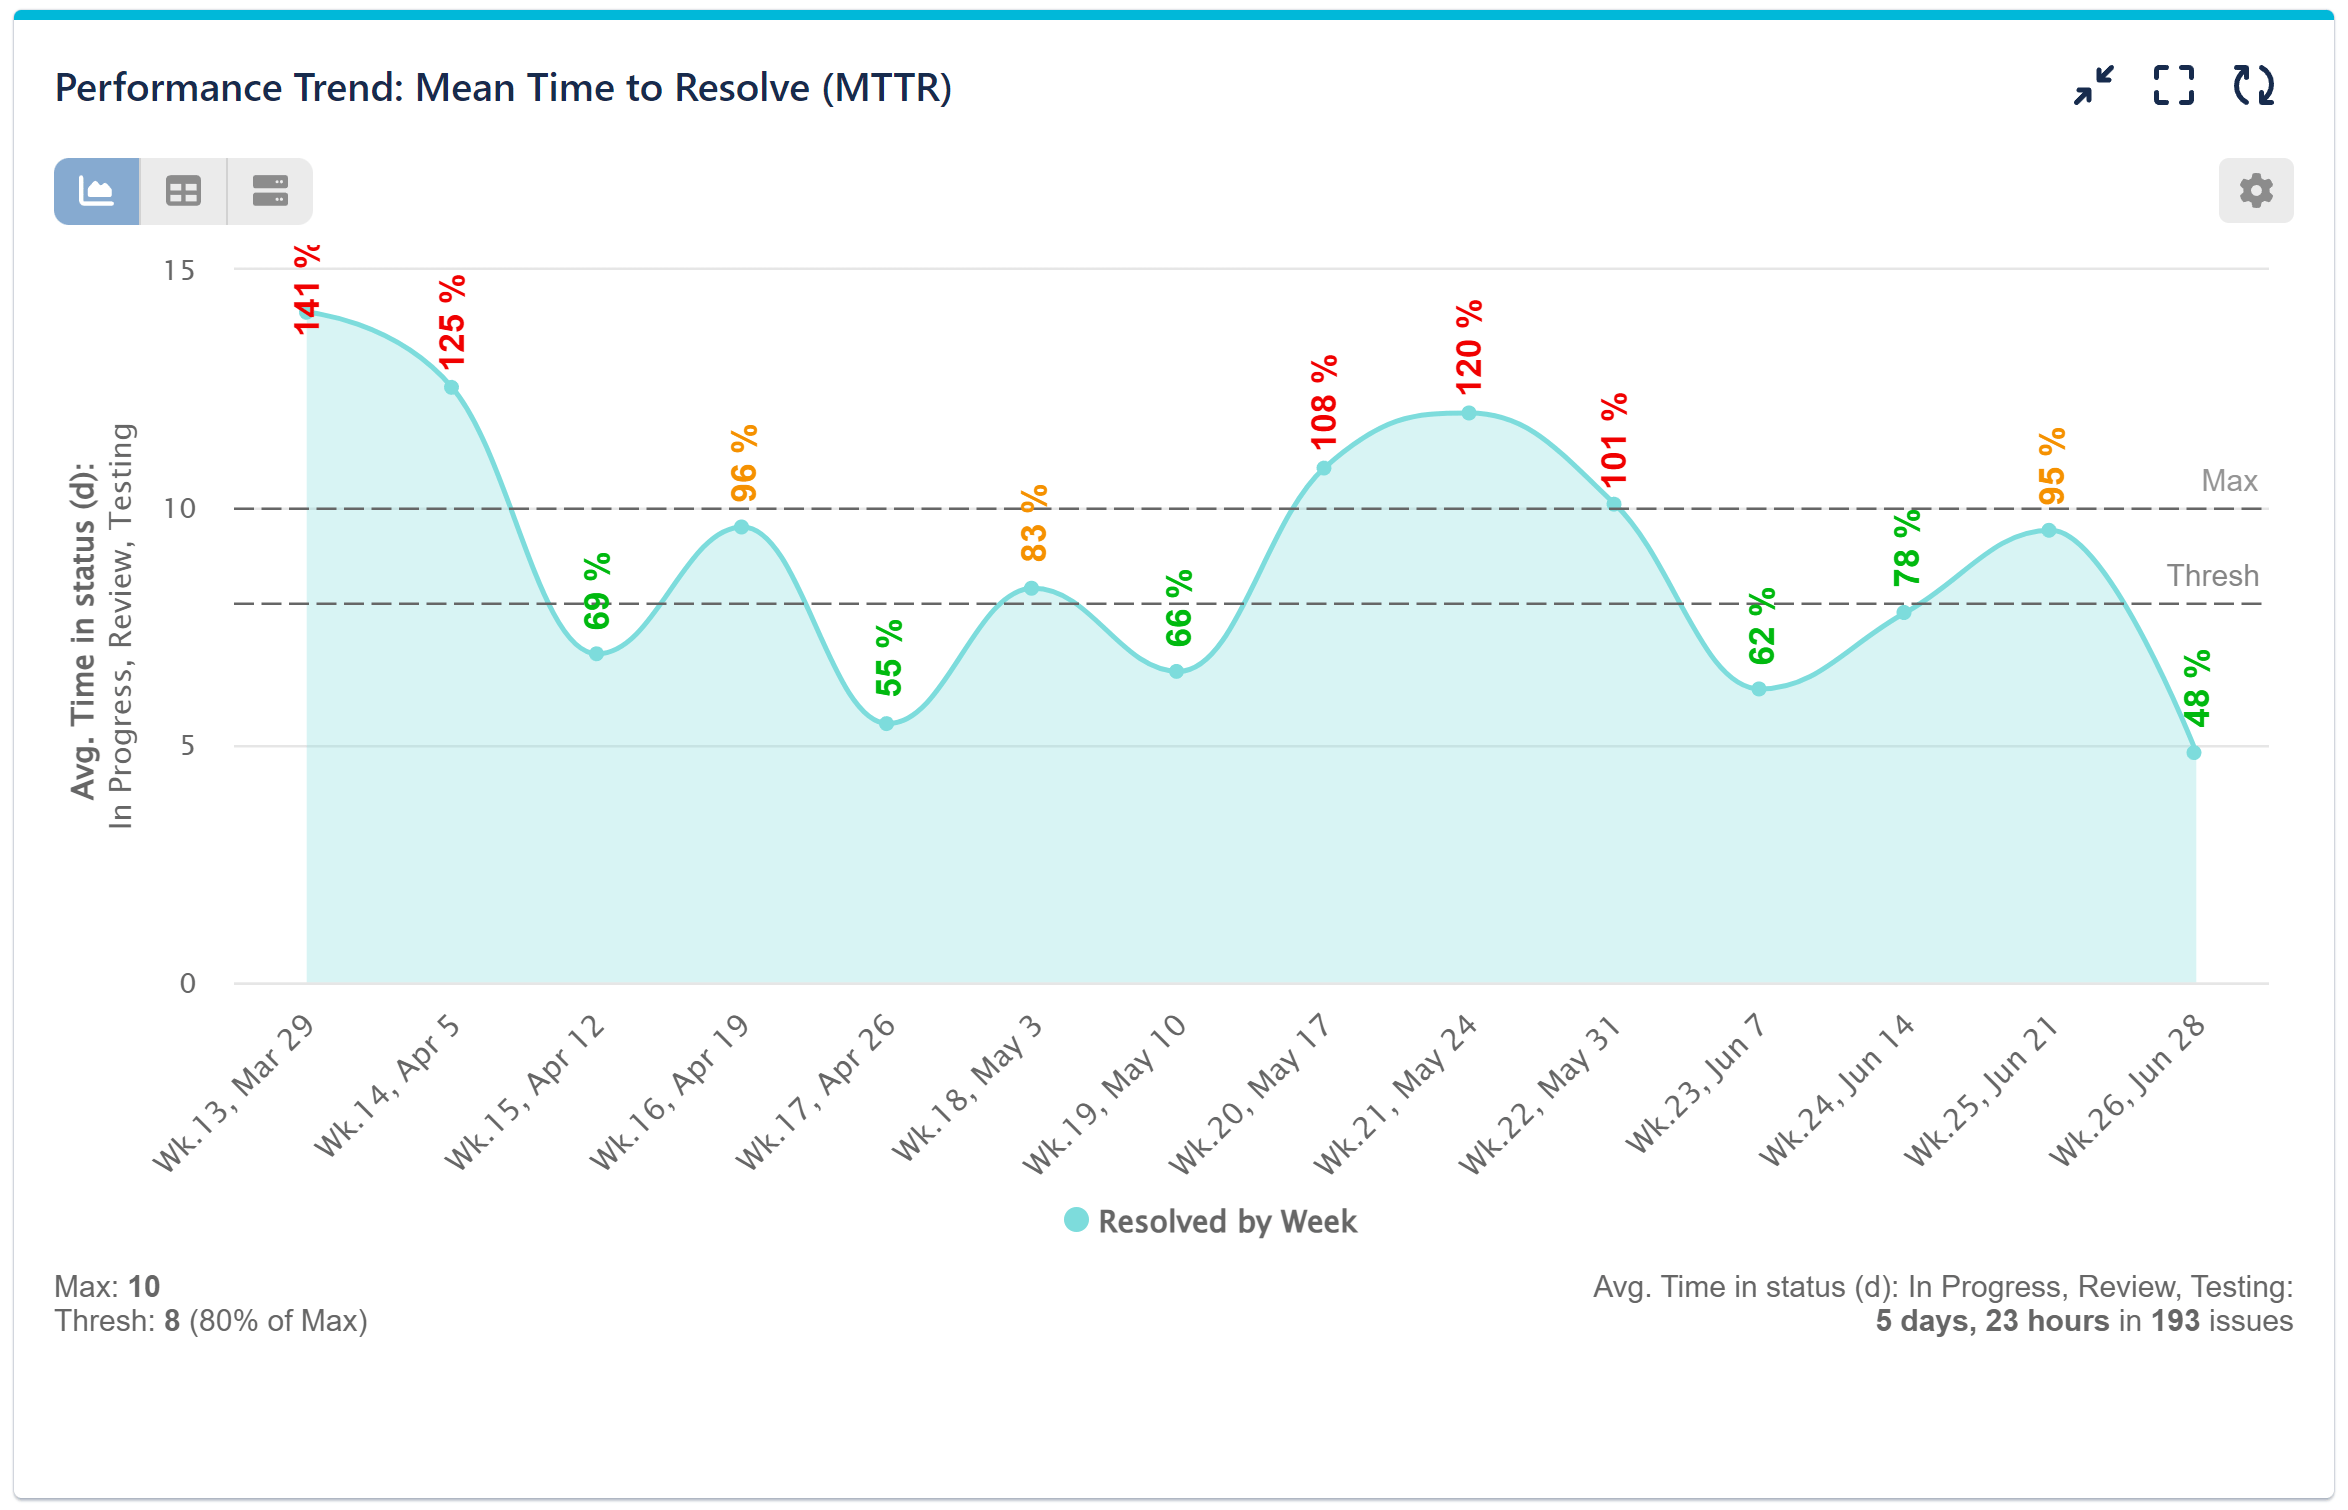
Track MTTR using ‘Time in status’ metric
You can use this configuration for Jira Service Management, Jira Work Management and Jira Software projects.
Please follow the configuration steps below:
Step 1: Select the data sources you need to analyze. Here you have multiple options to define users/groups, choose one or multiple projects or a filter, issue types, etc. (for more information, please check the Configuration overview page).
Step 2: Select metric ‘Time in status’ and add status by your choice, here we are using ‘in progress’, ‘testing’ and ‘review’. By default, the calendar is set to 24/7 but you may select custom calendars that take into account the time zone, work hours and holidays of your teams. Learn how to create them in the following article.
Step 3: Select ‘Avg’ calculation and average by ‘number of issues’. It will take the average for value per week as per defined for x-axis in the ‘Display by’ field.
Step 4: In the Display Settings section choose ‘Display by’ field ‘Resolved’ and select date granularity (by day, week, month etc.).
Step 5: (Optional) Periods with no data may be excluded from the chart by enabling ‘Exclude empty’ in the ‘Display By’ modal window.
Step 6: Set chart type to Area.
If you do not need to set a target for your MTTR report, save your configuration and analyze your chart. If you prefer to utilize our advanced Target feature, proceed with the next easy steps:
Step 7: Switch-on the Target section and keep the ‘Fixed’ tab selected.
Step 8: Select ‘Per x-axis item’ visualization to show percent completion against each x-axis item.
Step 9: Define target level and set it. For our sample configuration it is 10. Indicate the target as negative by selecting ‘Exceeding is’ as ‘Bad’.
Step 10: Enable the ‘Threshold warning’ in ‘More settings’ section and set % of Target. It will color the values above that level in amber.
Step 11: Set Target Label of your choice. It will appear as a target line annotation on the chart.
The detailed settings are shown in the recording below:
Create Mean Time to Resolve Report using built-in SLA metrics in Jira Service Management
You can use this configuration for Jira Service Management projects.
Follow the basic steps as in Option 1 above but select ‘Time to resolution’ metric from SLA metrics list and choose ‘Elapsed (h)’ for all cycles.
The detailed settings with SLA metrics are shown in the video below:
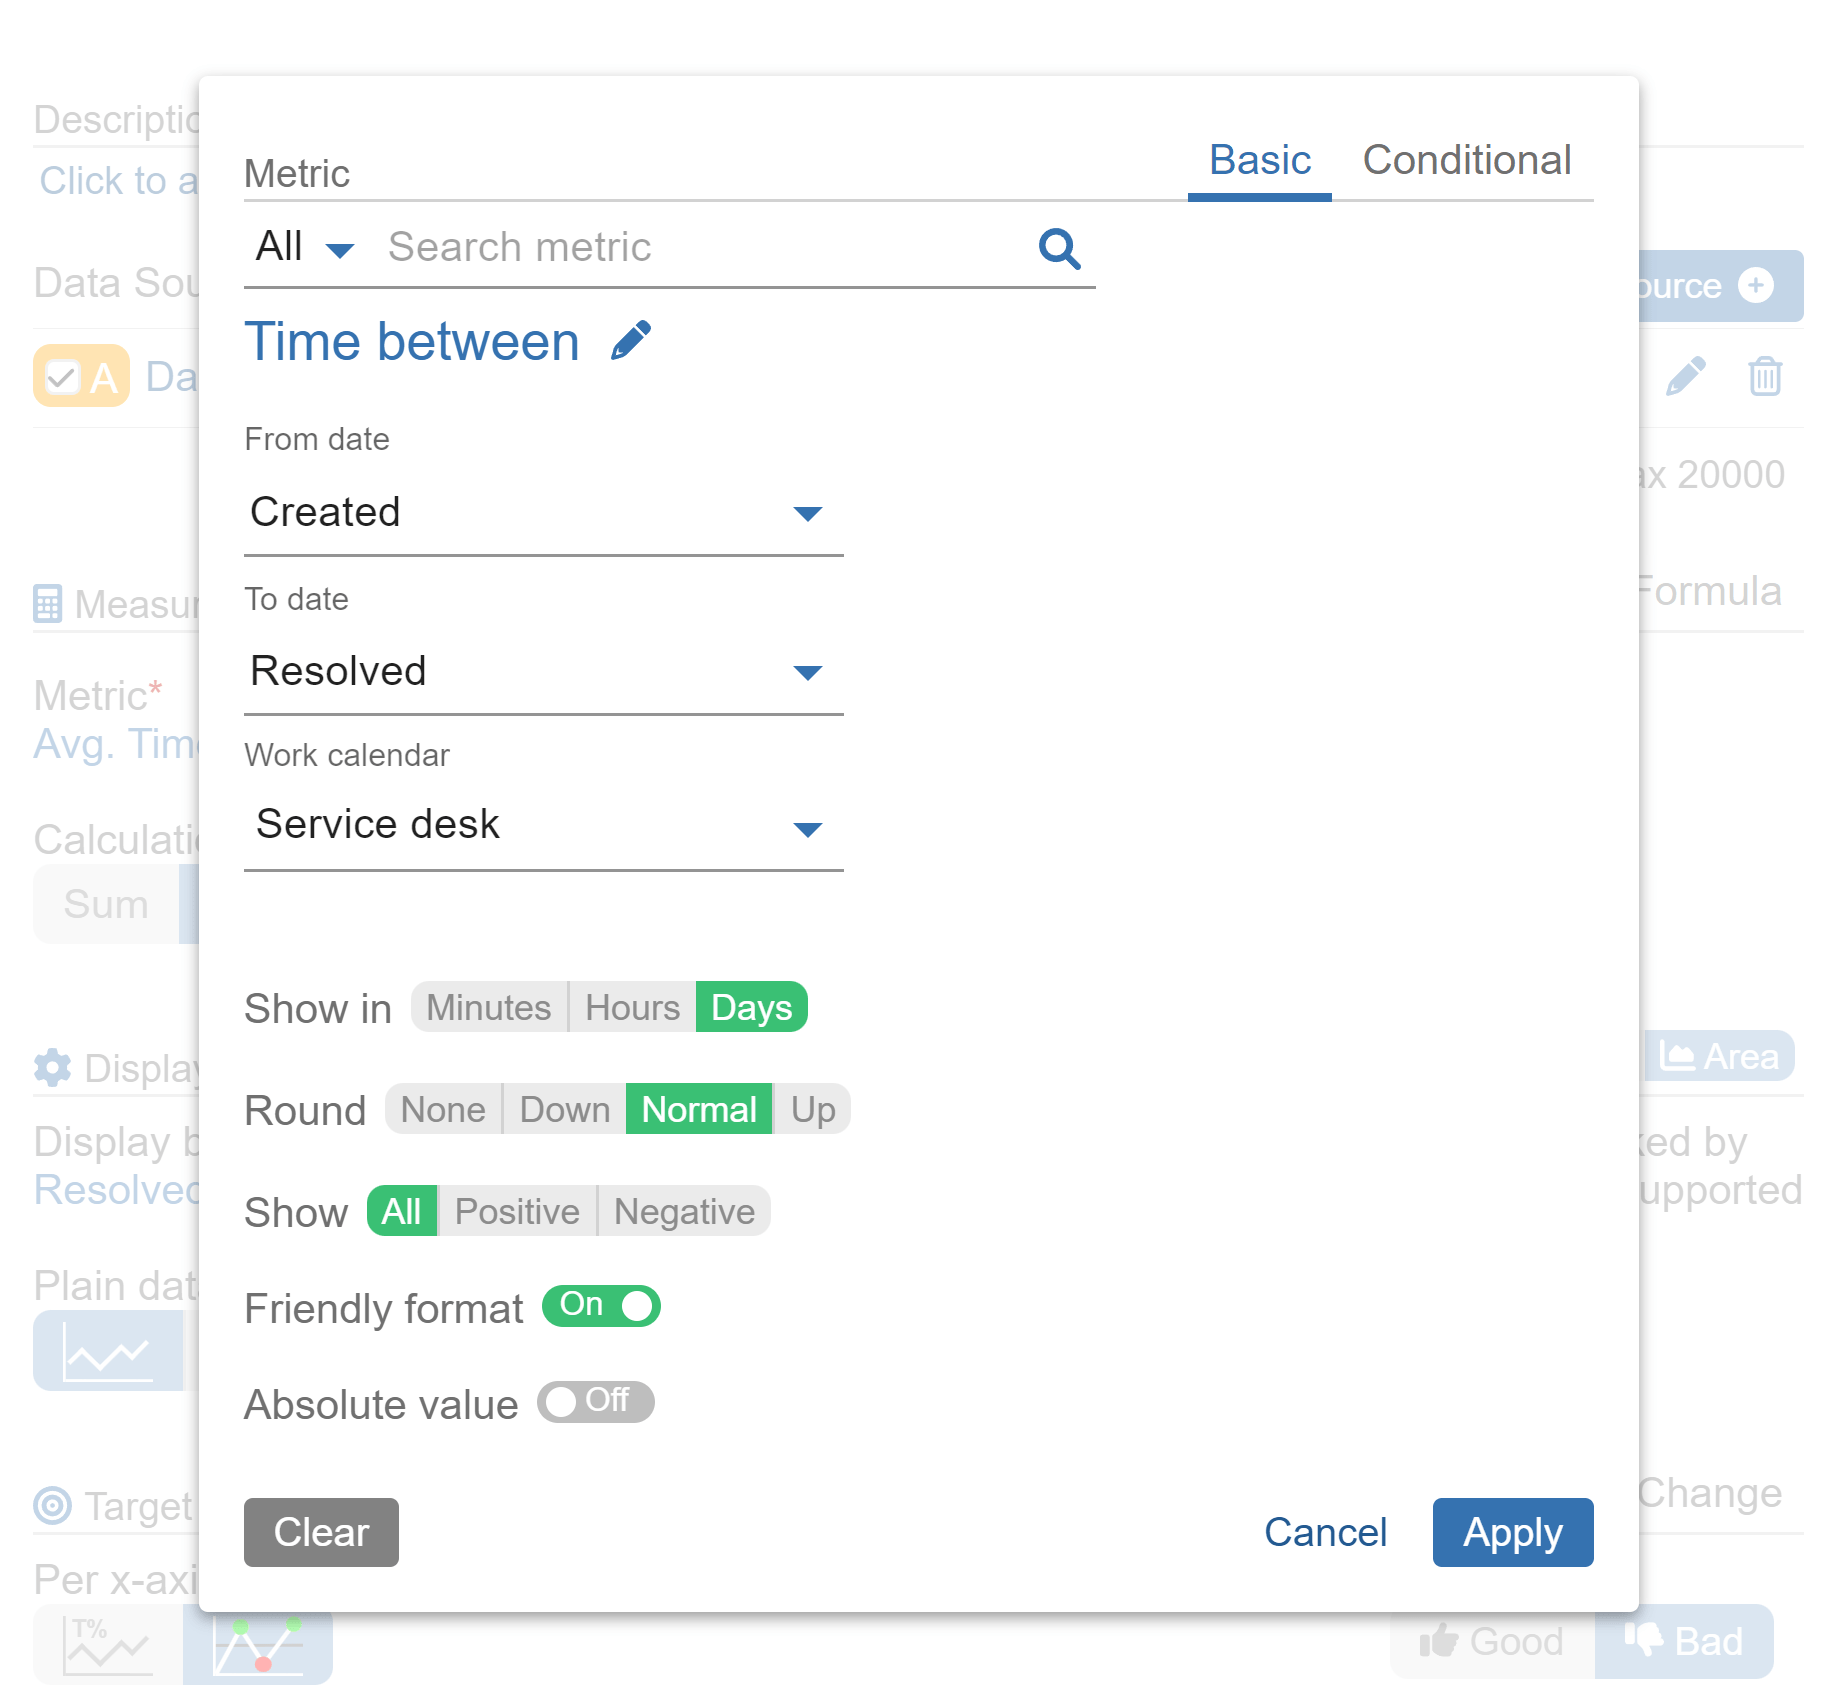
Track MTTR with ‘Time between’ metric
An alternative option to track MTTR is by using ‘Time between’ metric with events of your choice, e.g., from date ‘progress started’ or ‘created’ to date ‘resolved’.
You can use this configuration for Jira Service Management, Jira Work Management and Jira Software projects.
If you are interested in how to create custom fields to capture date events such as ‘Progress Started’ from your workflow, please check the following article.
Please note that if you add custom fields, the accumulation of historical data starts from the moment when field is created.
Start your 30 days free trial of Performance Objectives: Charts for Jira from Atlassian Marketplace.