Efficiency is the heartbeat of successful project management. One key aspect is cutting down time spent on rework. This article guides you through crafting a “Time Spent in Rework” report in Jira. Using the Performance Objectives: Charts for Jira app, we’ll show you how to visualize data right on your Jira dashboard and set target for rework reduction and increased efficiency.
Crafting a Jira Report for Managing Time Spent in Rework
Imagine spotting trends and enhancing productivity by focusing on rework. This becomes achievable through the utilization of Performance Objectives and Performance Trend gadgets. These tools are equipped with the Target calculation feature, simplifying performance management processes and seamlessly integrating them into Jira for your convenience.
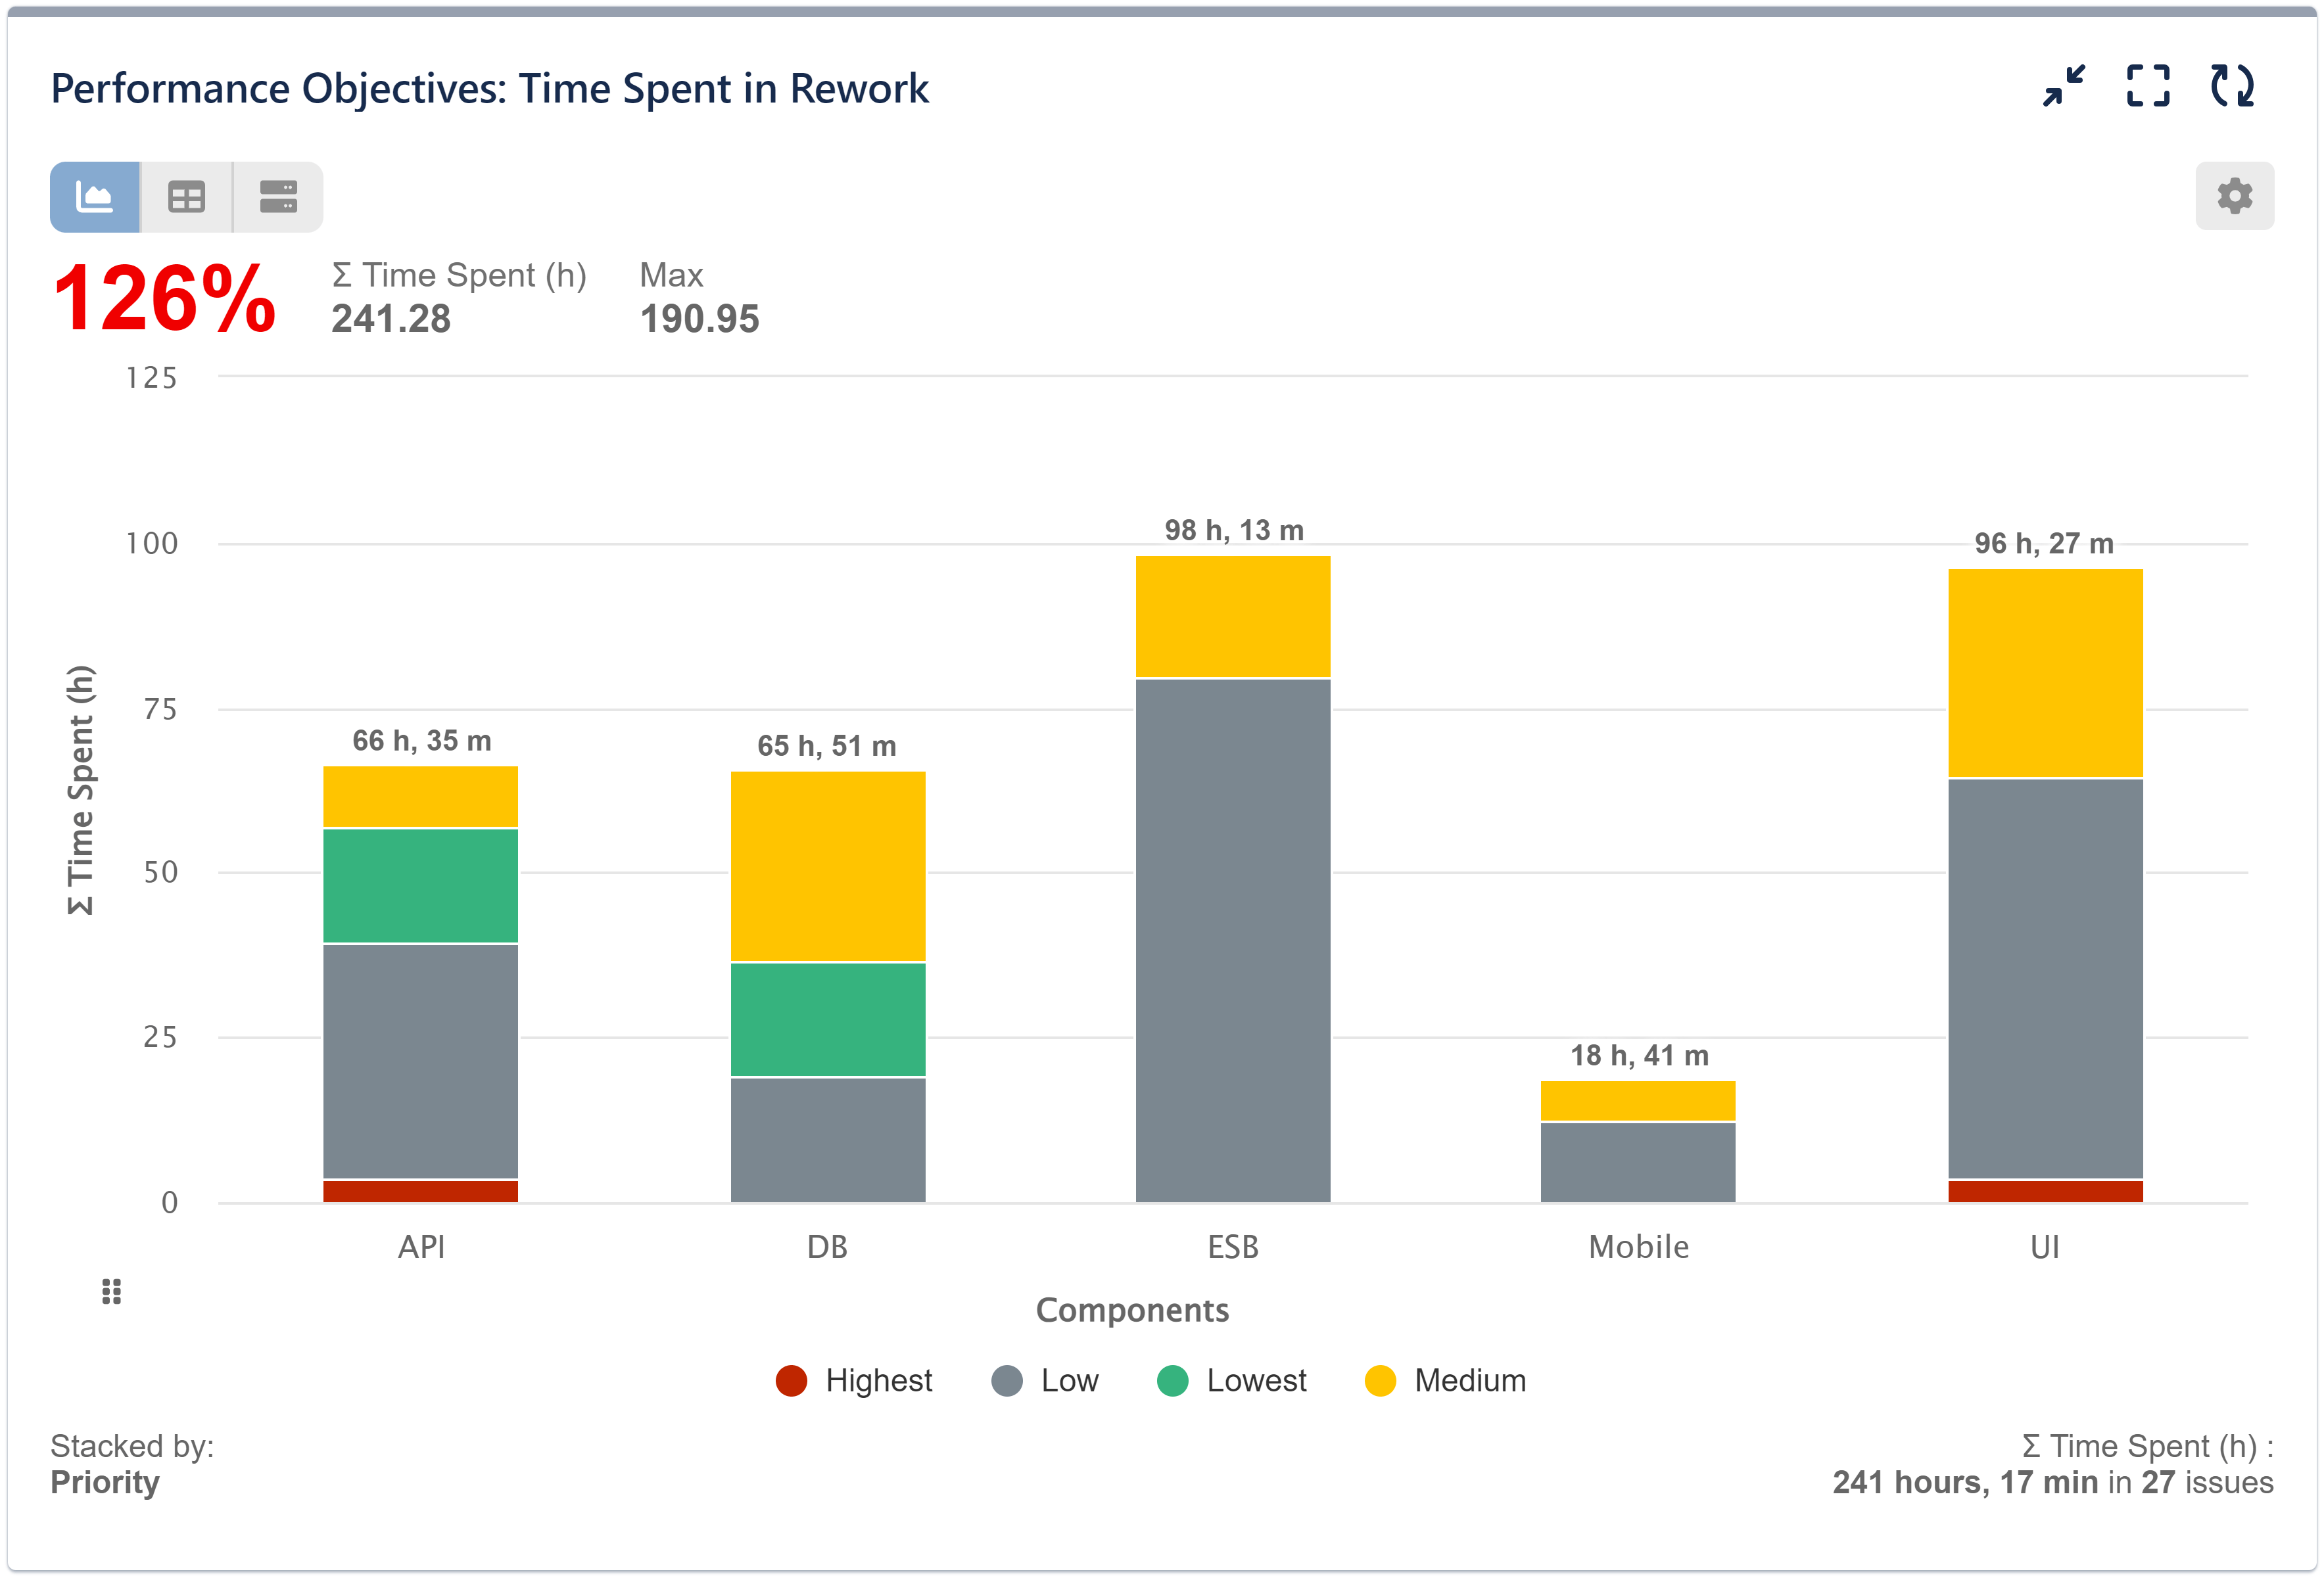
Let’s explore how to build this report step by step and get closer to achieving the goal of “Max 20 % of time spent for all issues in rework / bug fixing.”
Step by Step Guide: Creating the Rework Reduction Report Using Performance Objectives Gadget
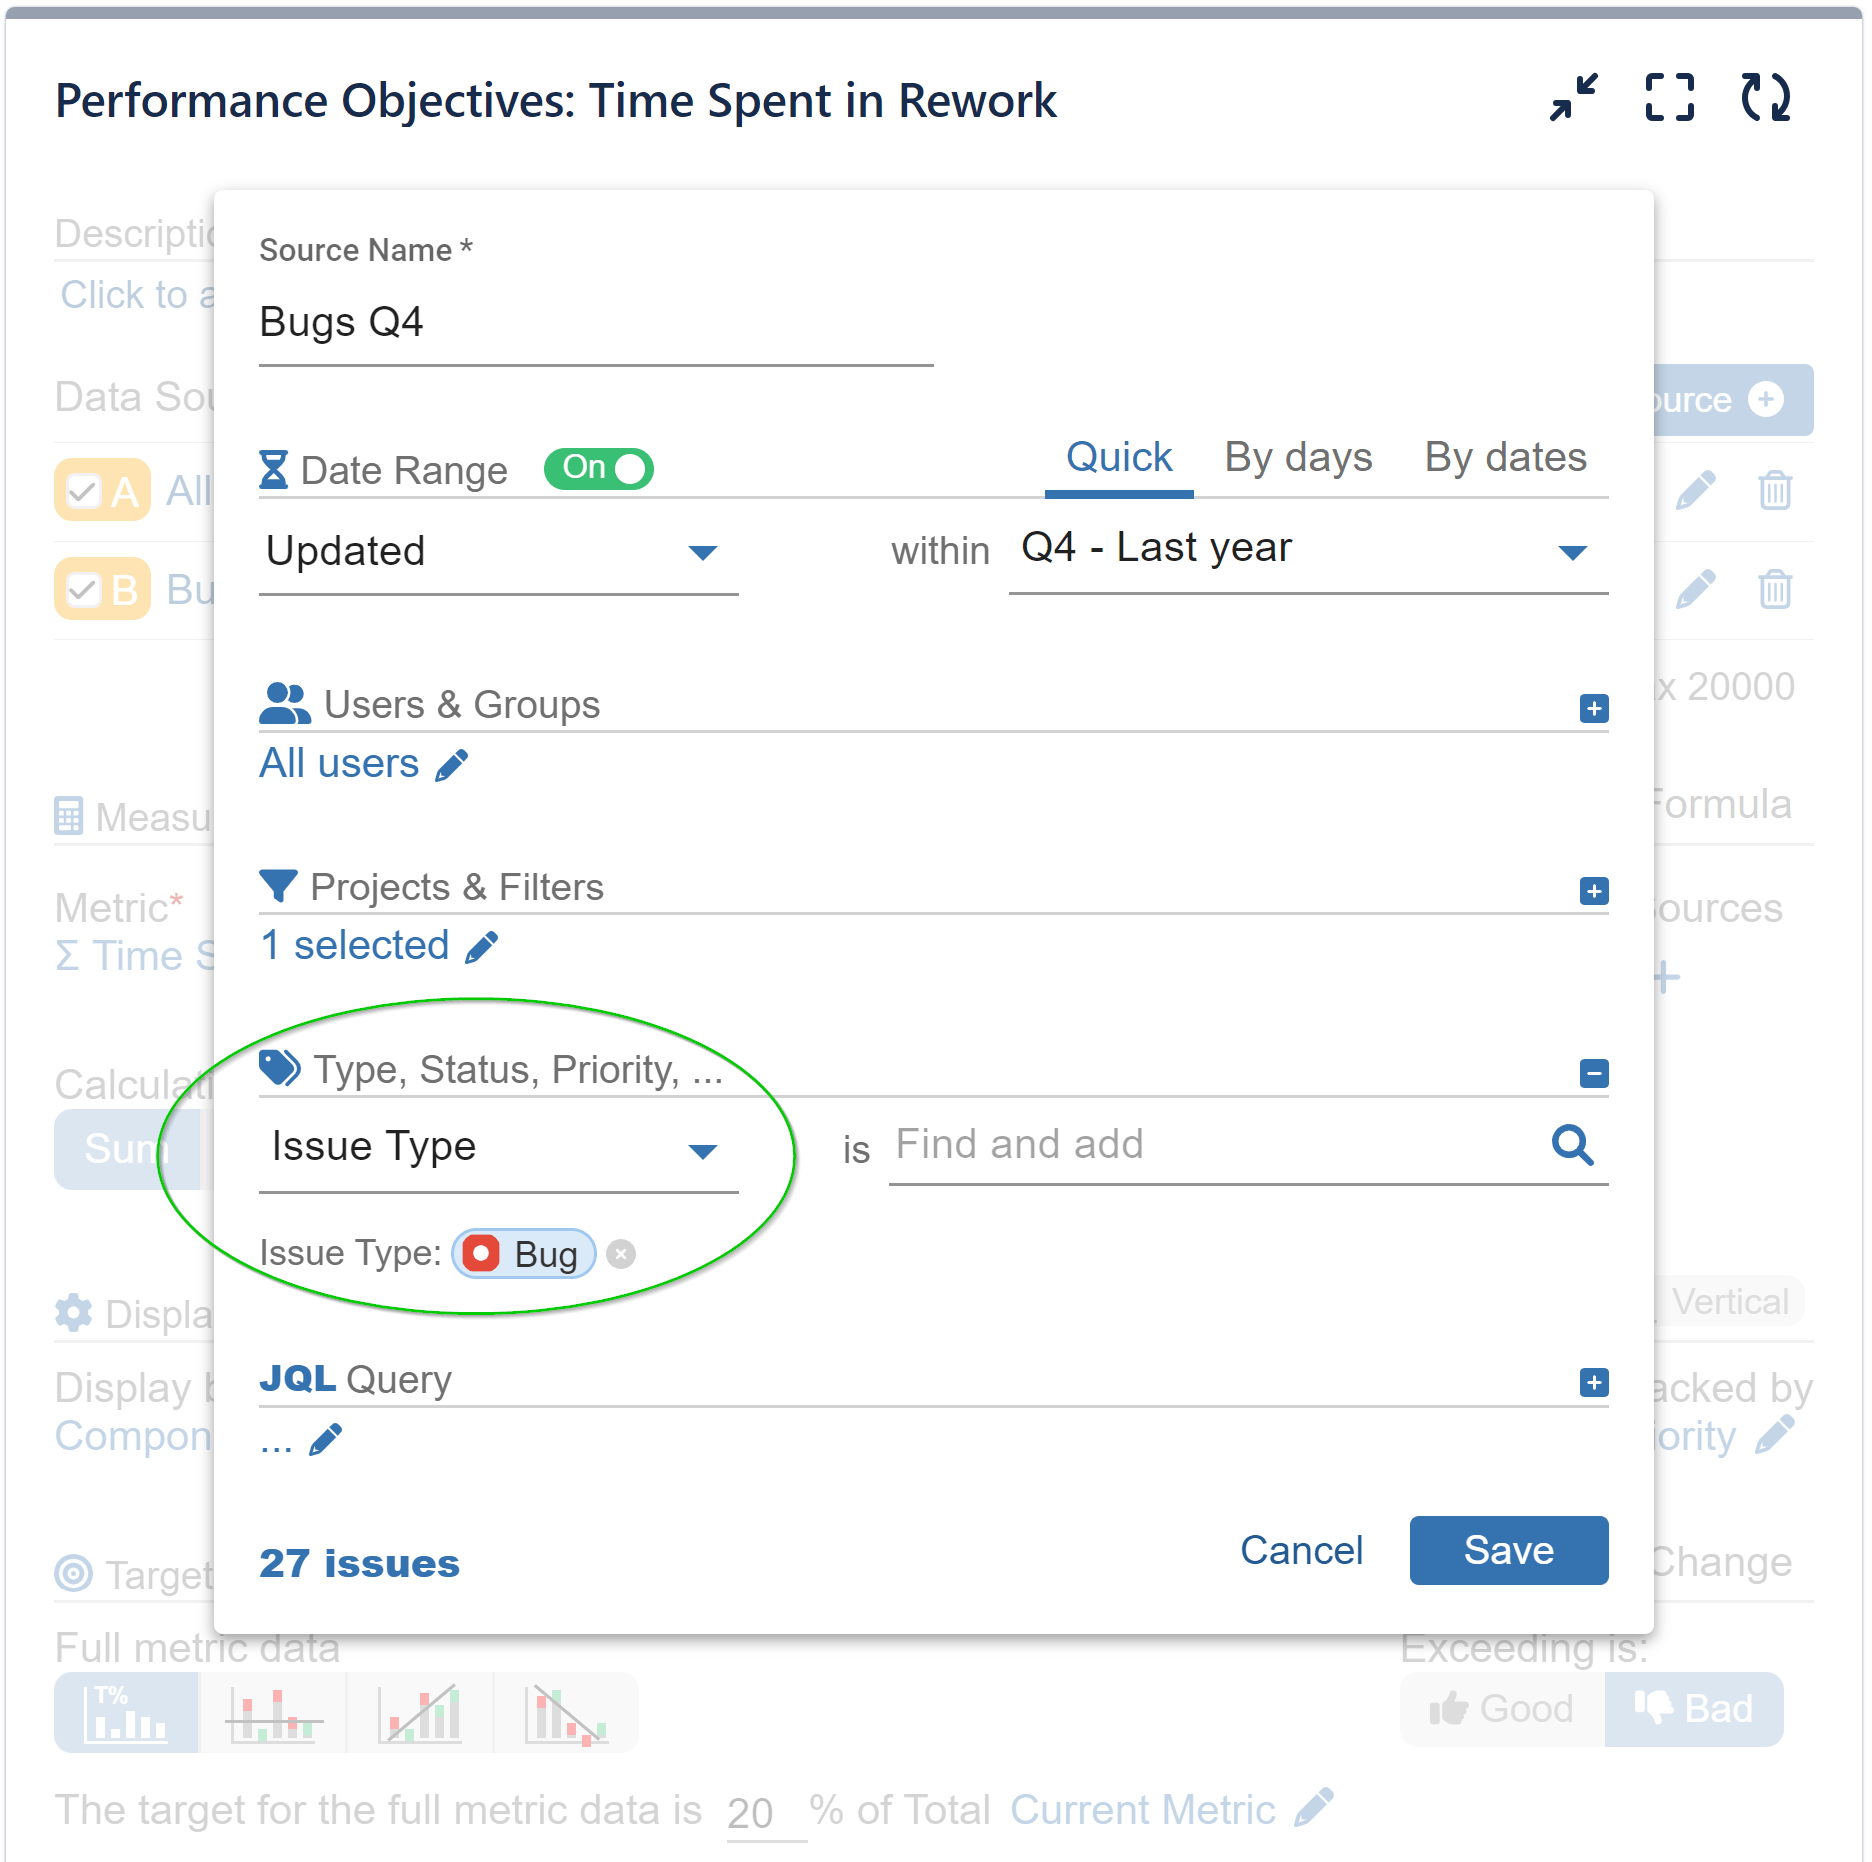
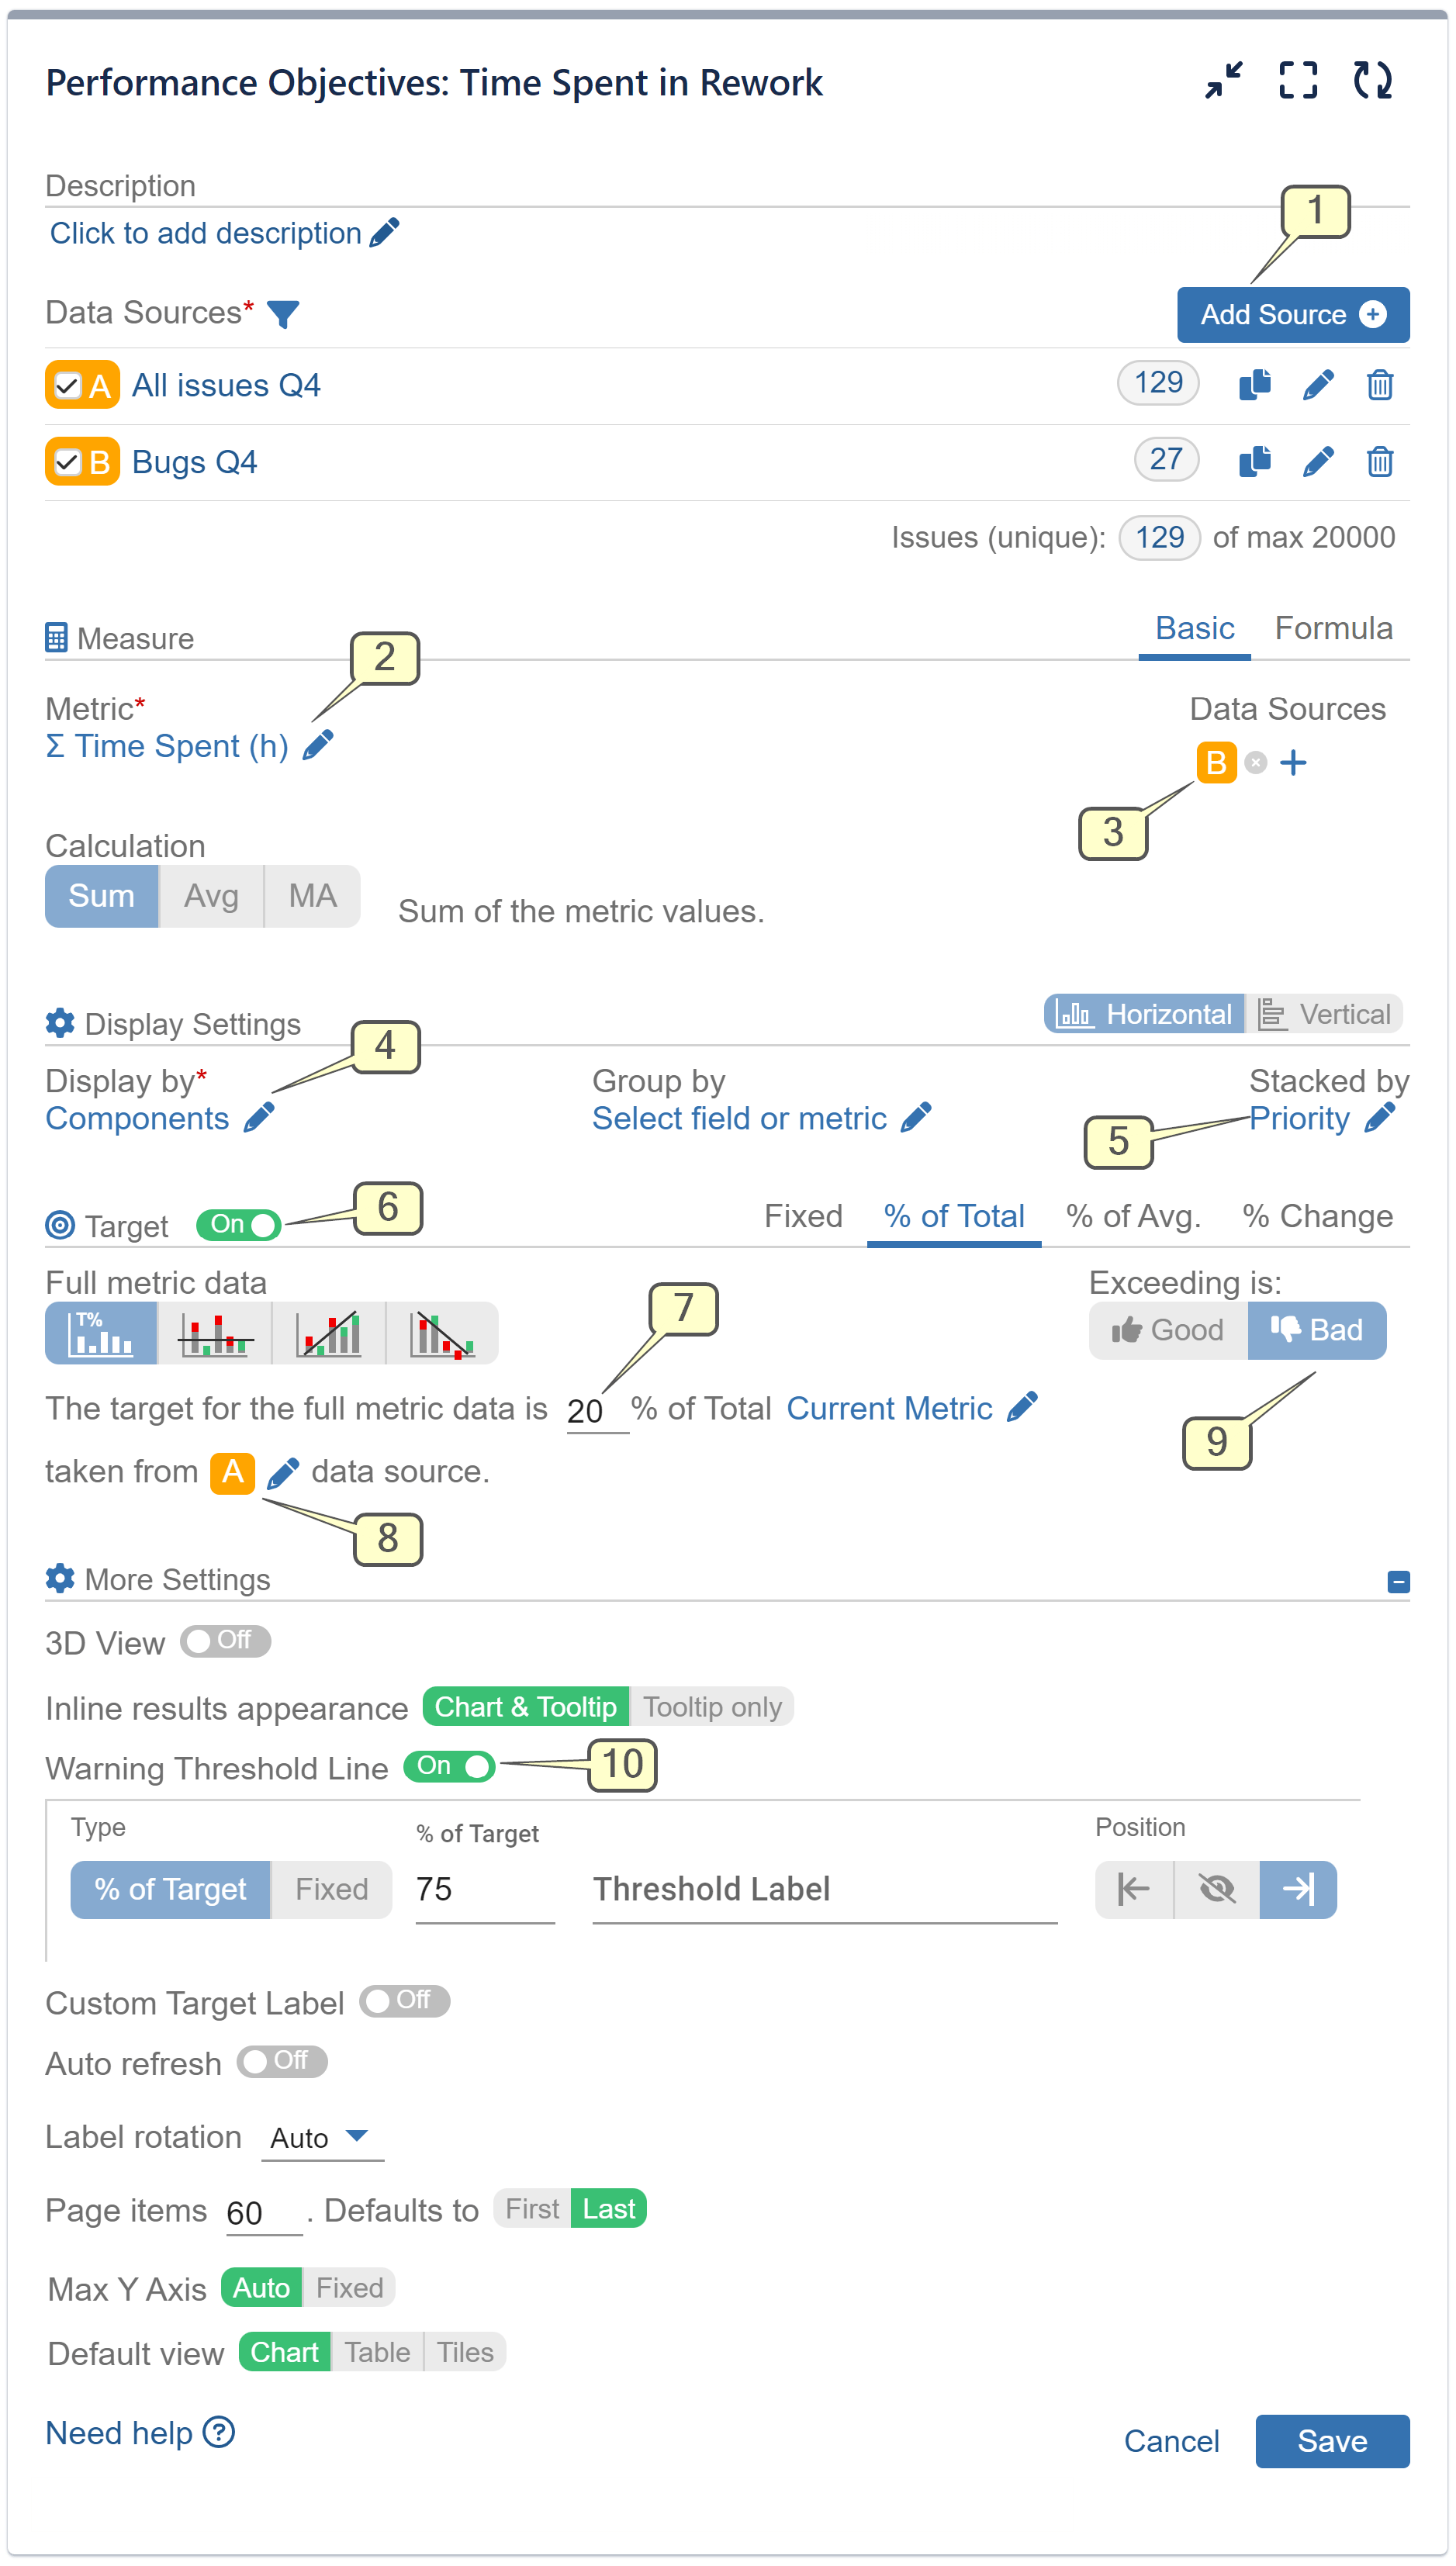
Step 1: Incorporate 2 Data Sources – one encompassing all issues and the other exclusively for Bugs. Use the data segmentation options. Filter your second data source for this report by selecting only the ‘Bug’ Issue Type, as demonstrated in the image.
Step 2: Opt for the metric “Σ Time Spent (h)”.
Step 3: Define Data Source B (Bugs) for the metric calculation.
Step 4: Specify ‘Display by’ as ‘Assignee’ for the x-axis representation.
Step 5: (Optional) Choose ‘Priority’ for Stacked by to get even deeper insights.
Step 6: Activate the Target section and navigate to the ‘% of Total’ tab.
Steps 7 & 8: Define the target level value. In our case it is 20 %. Choose data source A (All Issues) for calculating the target metric. By default, the target metric is ‘Current Metric,’ which translates to utilizing ‘Σ Time Spent (h)’.
Step 9: Specify a negative target by selecting Exceeding is: “Bad”. This configuration means that exceeding the target level will result in a failure to achieve, highlighted in red.
Step 10: (Optional) In the ‘More Settings’ section, enable and customize the ‘Warning Threshold’ option.
Review the Recording Showcasing the Comprehensive Configuration Settings for Rework Reduction Report
Using the Performance Objectives: Charts for Jira app, you have the ability to create a dedicated “KPI Dashboard” directly on your Jira dashboard. This dashboard can include a set of reports focused on your objectives, all aimed at reinforcing your SMART goals. Our support team is prepared to assist you.
For additional use cases that can enhance your performance management process, take a look at the KPI Examples page.
Start your 30 days free trial of Performance Objectives: Charts for Jira from Atlassian Marketplace.