Task prioritization can sometimes be challenging, as every issue may seem important. Despite teams committing to completing issues in specific sprints, some remain unresolved, rolling over into the next sprint alongside newly added high-priority issues. This cycle of sprint rollover can lead to inefficiencies and stakeholder dissatisfaction.
The Performance Objectives app for Jira provides a solution to easily track the % completion of committed rolling issues by offering additional sprint metrics filtering options. In this article we’ll walk you through generating such a report, ultimately aiding in better issue management and prioritization.
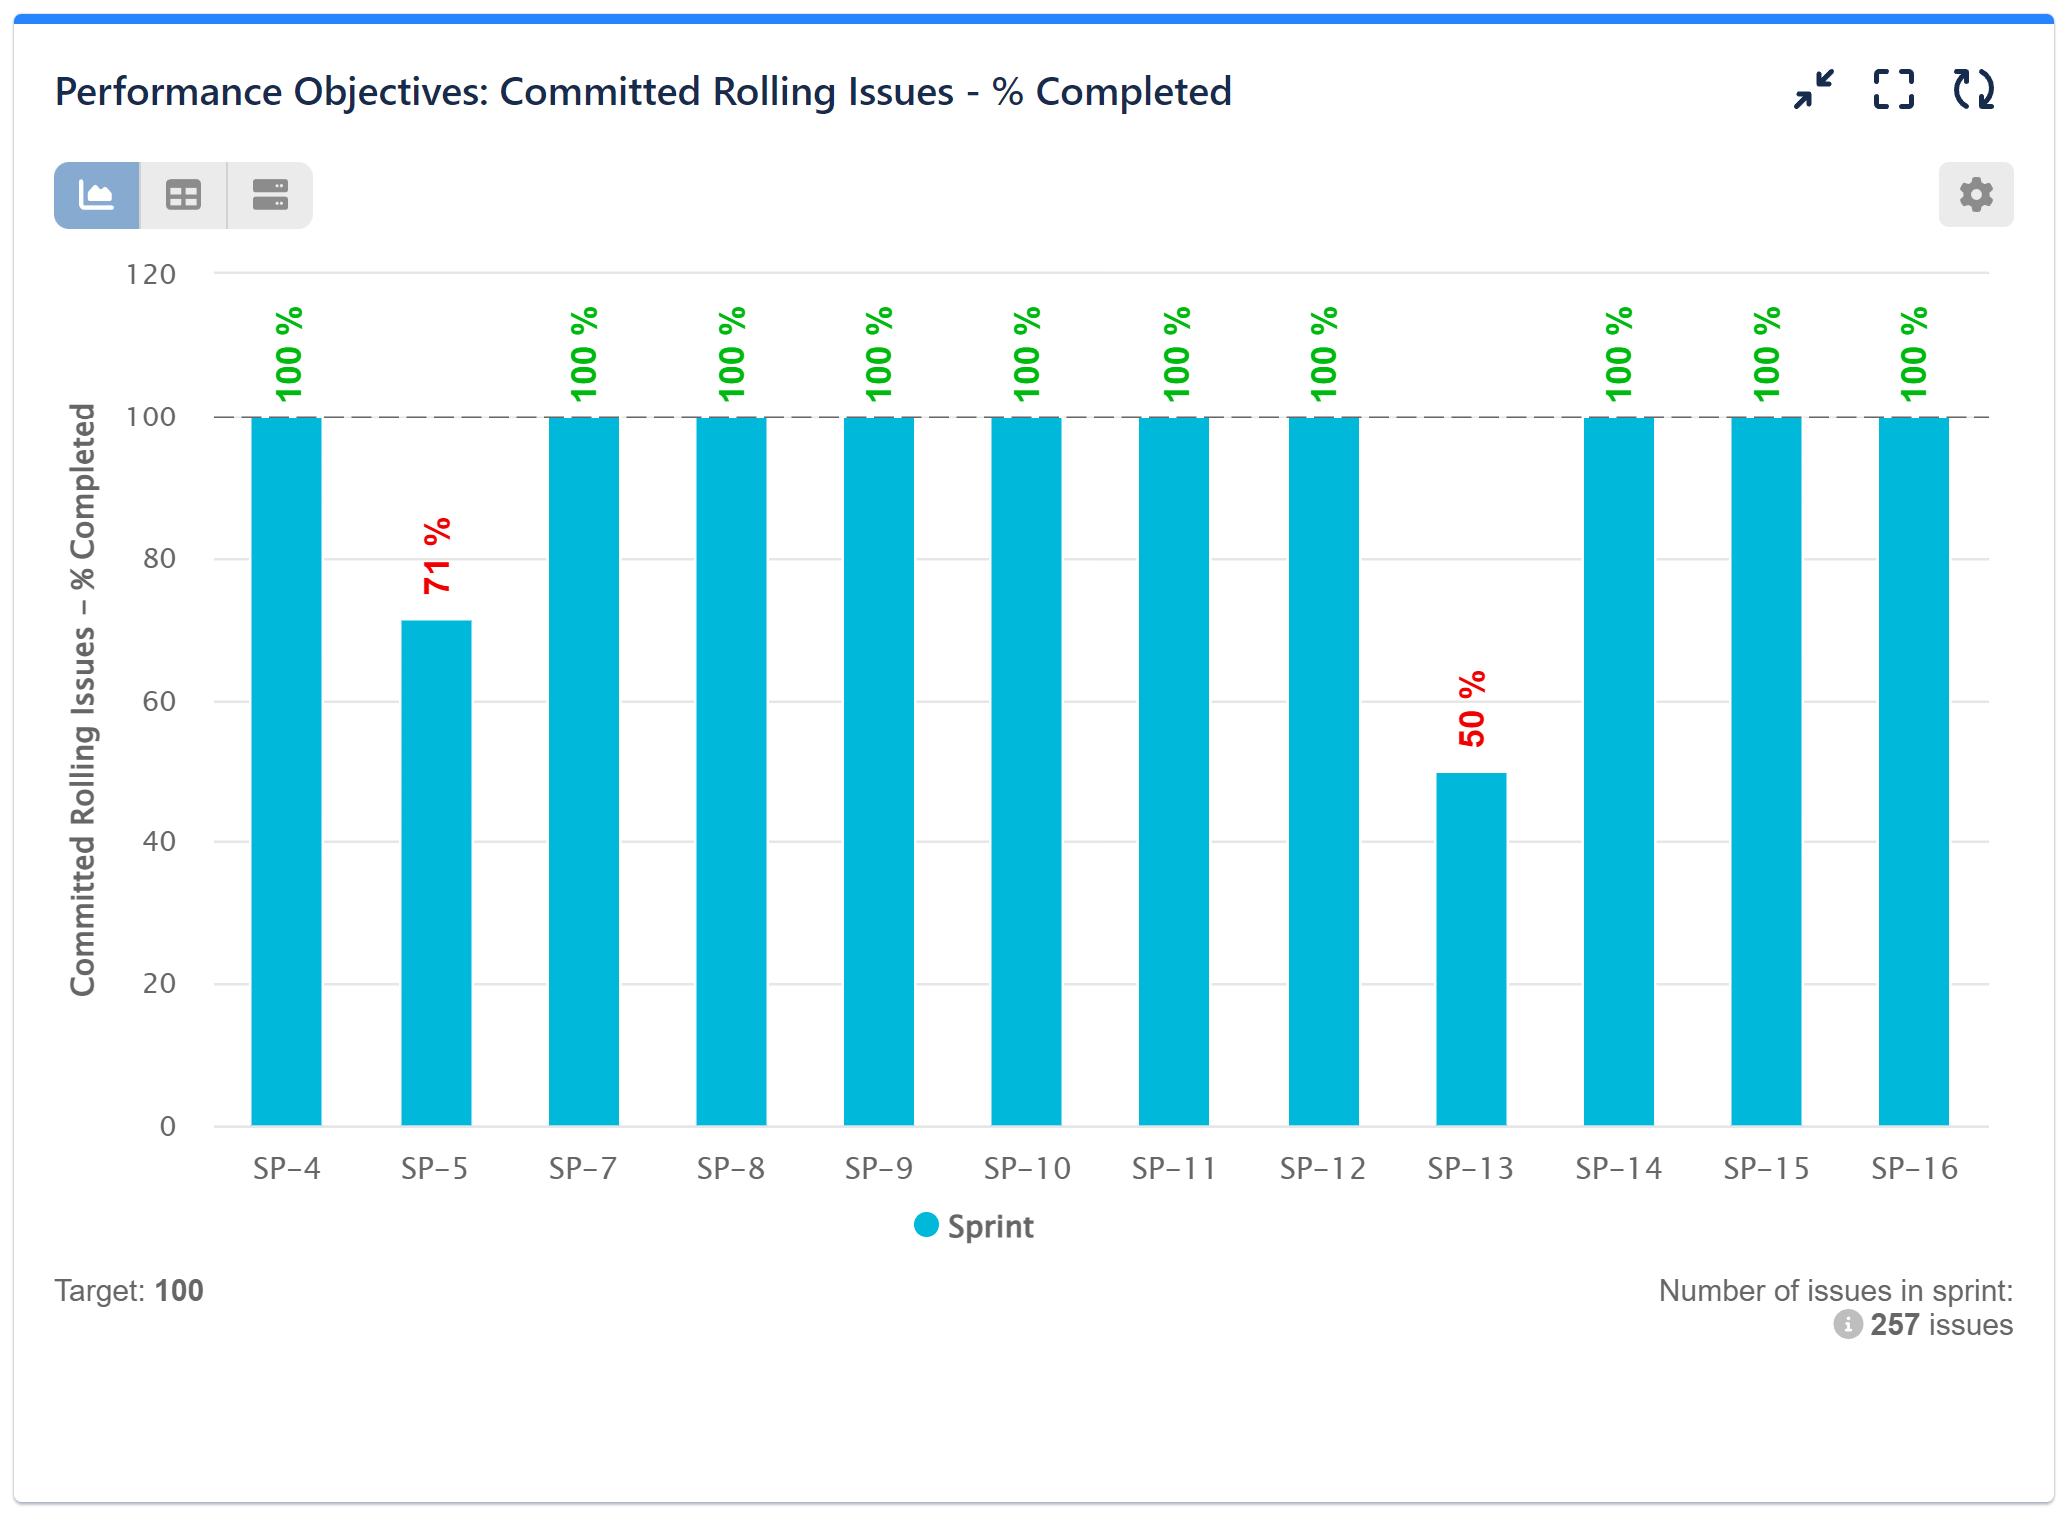
Configuring the “Committed Rolling Issues – % Completed” Report in Jira
Track the sprints where you successfully completed the committed rolling issues and identify the sprints where you faced challenges. Set a goal of 100% completion for rolling issues and prioritize issues that did not meet the goal for the next sprint planning.
Here are the steps to configure this report:
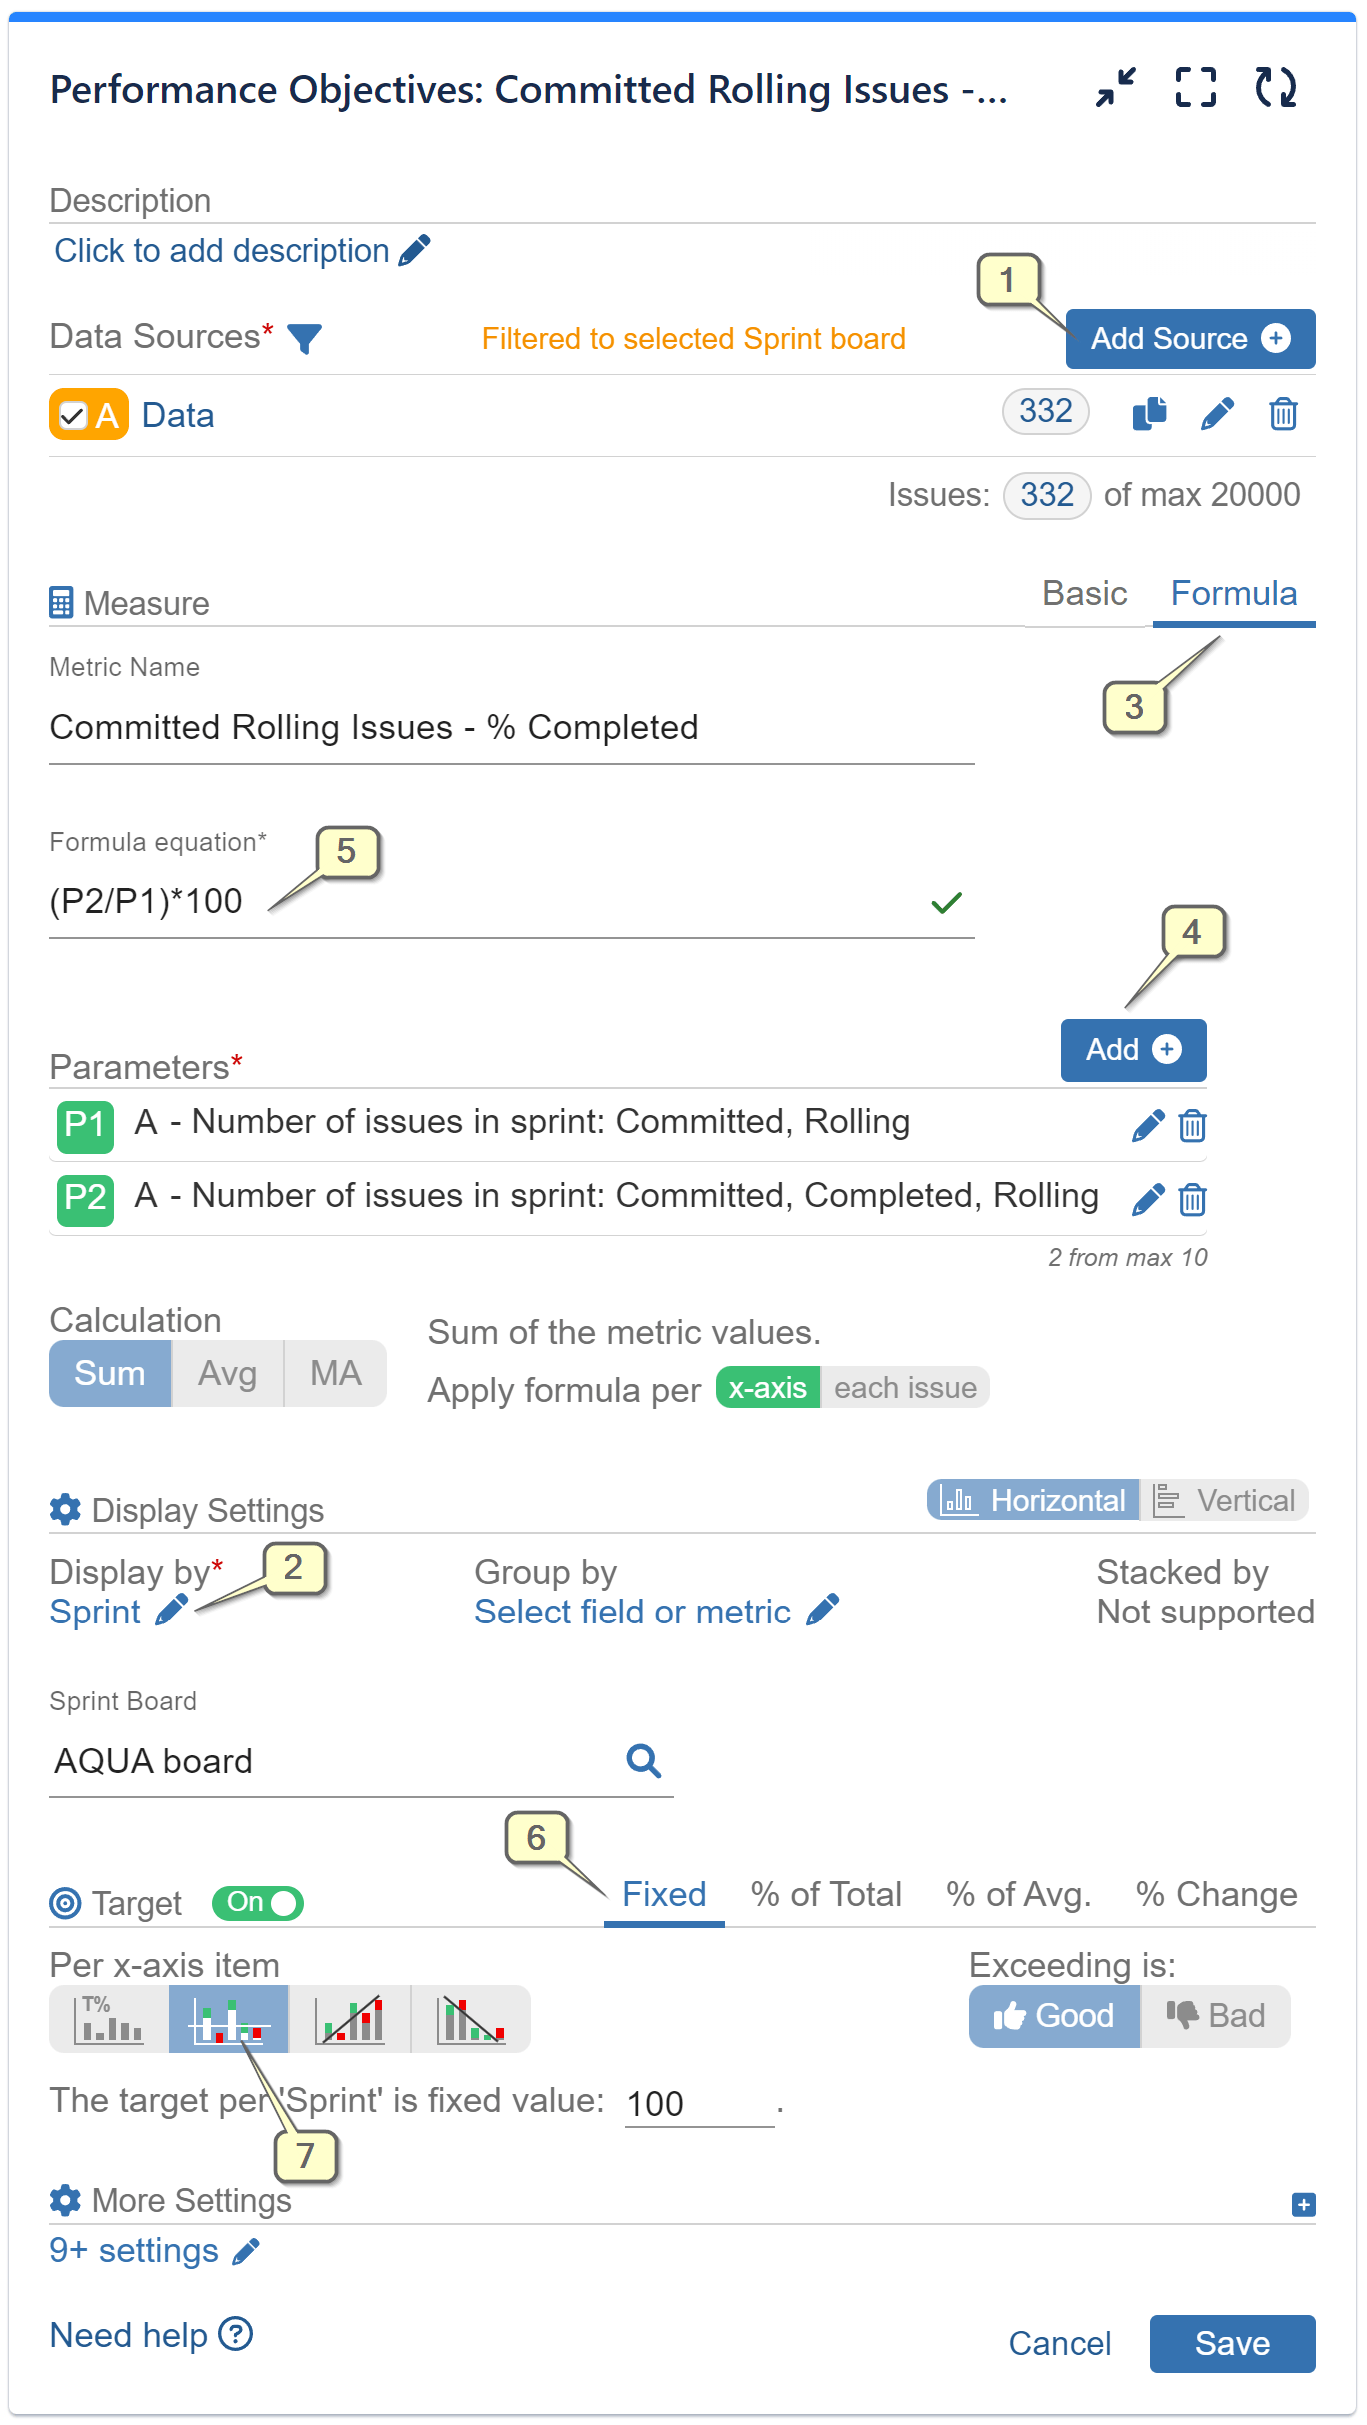
Step 1: Add a Data Source. In our example, we’ve filtered our demo project “AQUA” and disabled the date range to view all previous sprints.
Step 2: Choose ‘Sprint’ for the ‘Display by’ field to reveal more filtering options for your metric and add the Sprint Board you want to analyze.
Step 3: Select the Formula metric feature.
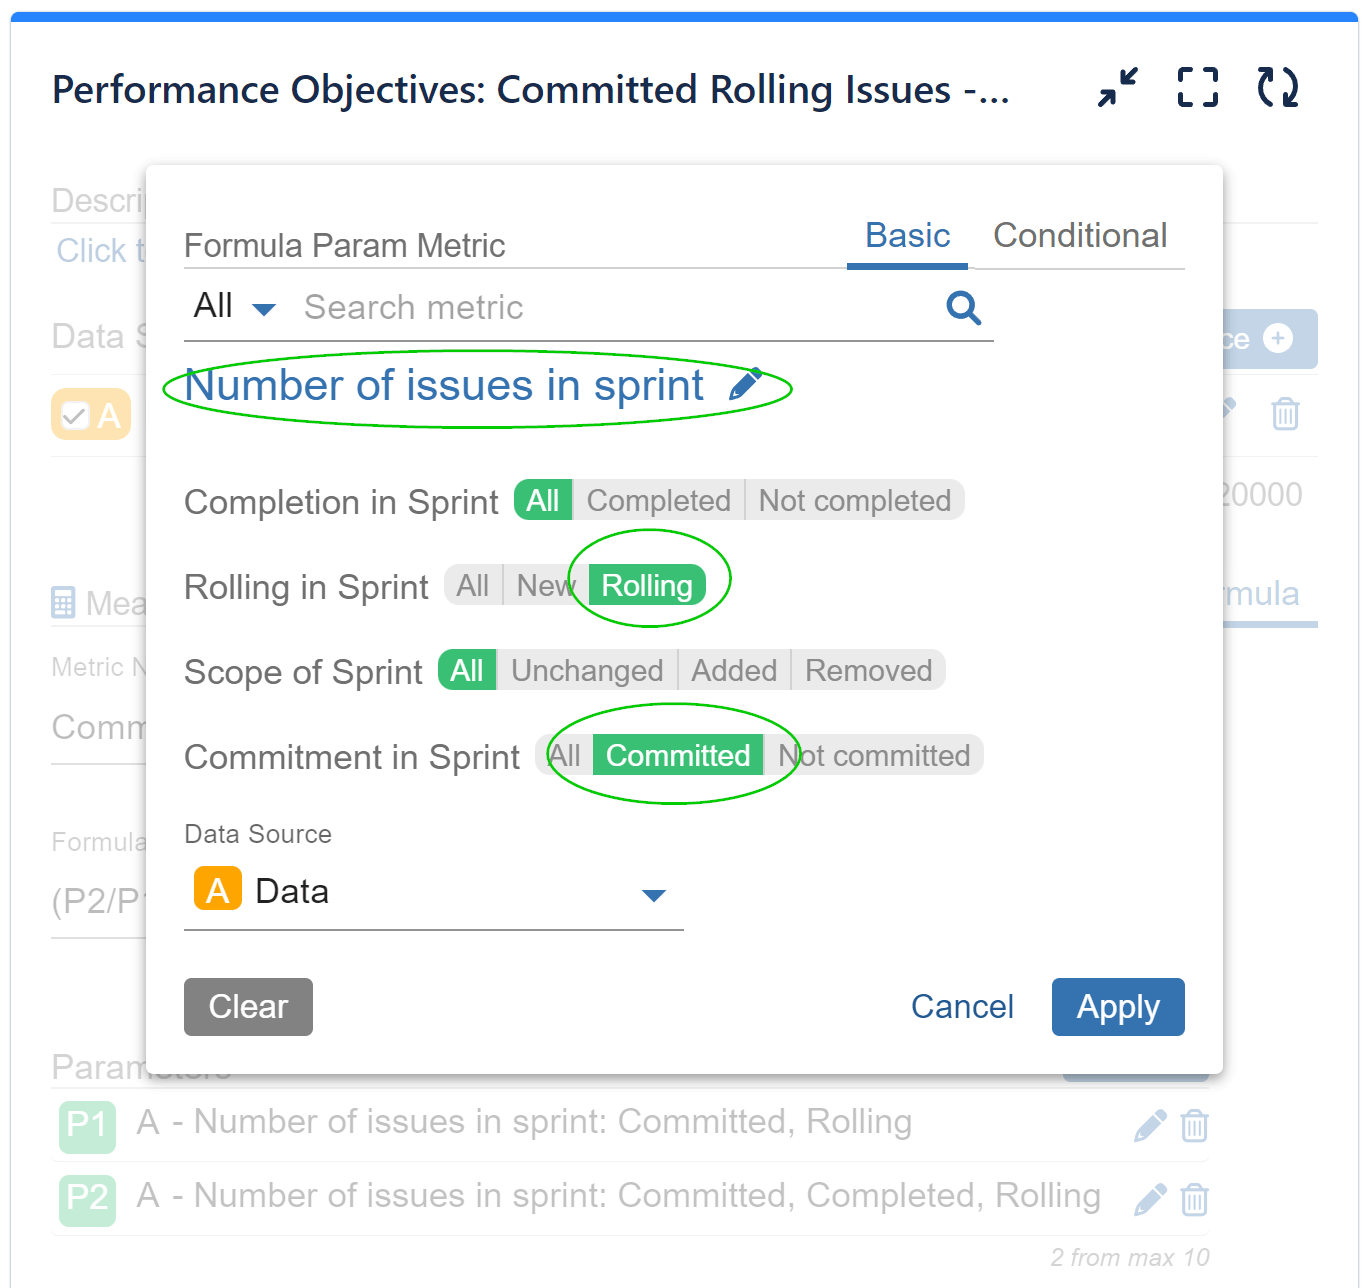
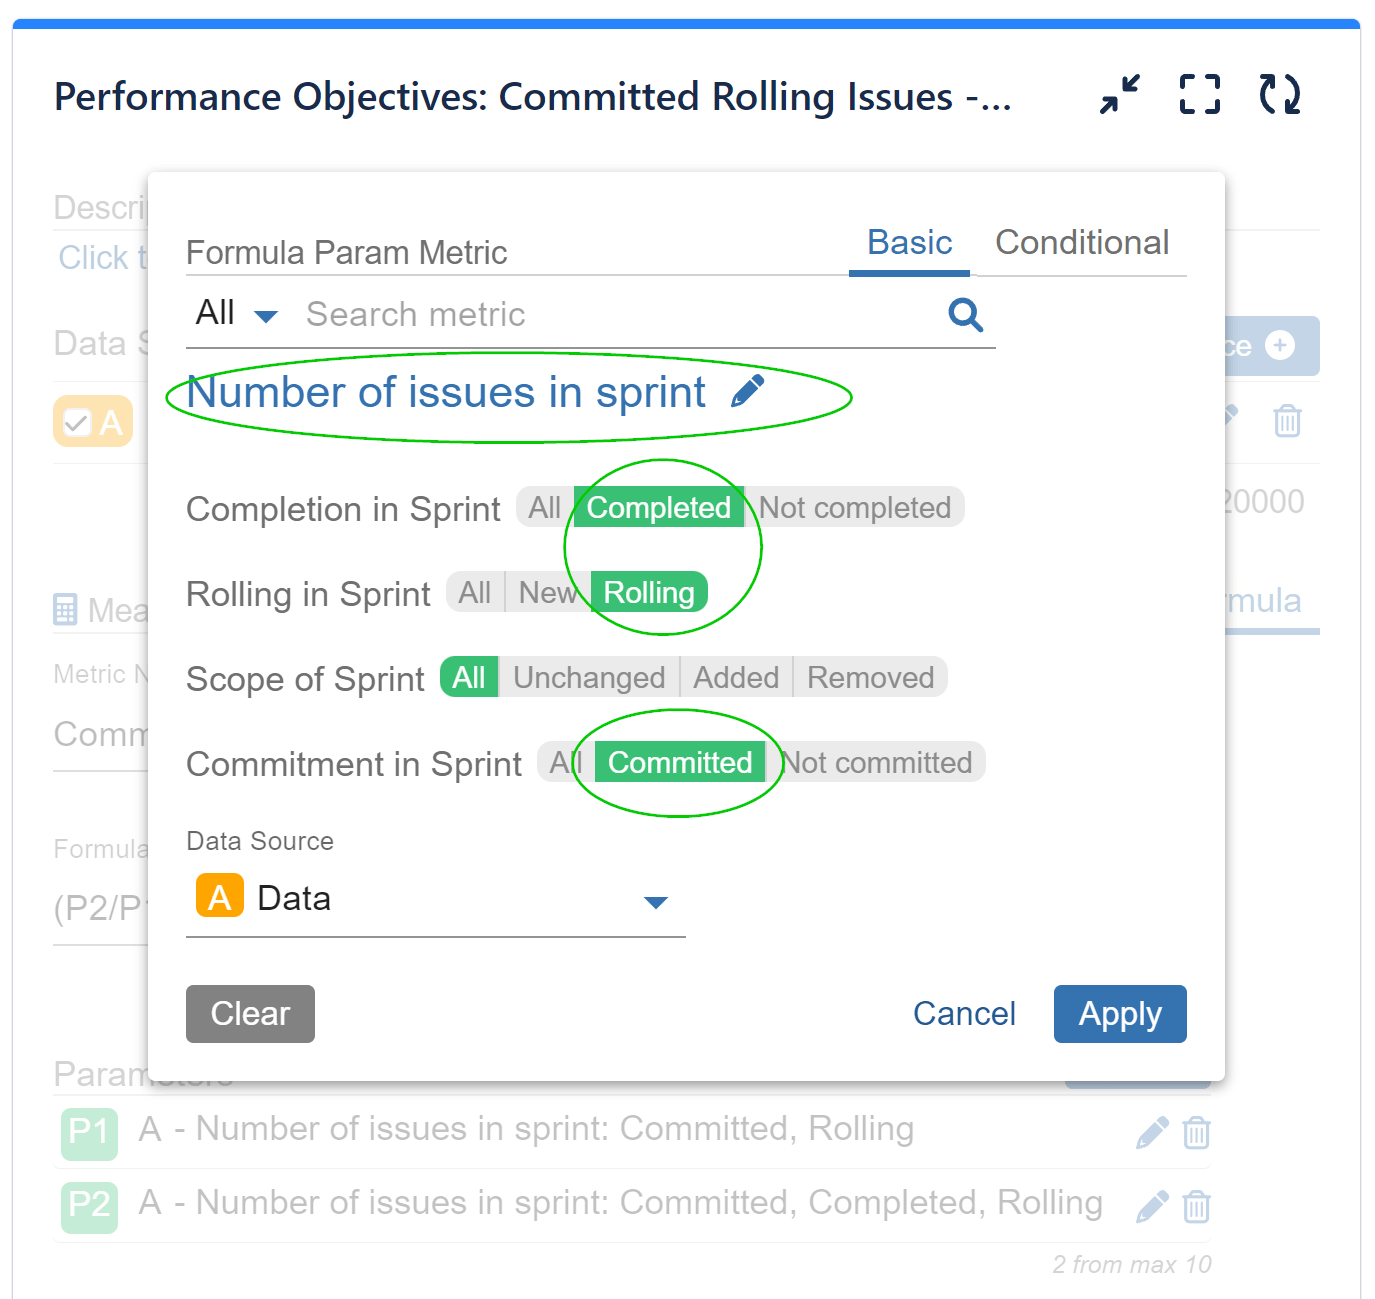
Step 4: Add two parameters using the “Number of issues in sprint” metric. For the first parameter (P1), specify Rolling and Committed issues. For the second parameter (P2), specify Completed, Rolling, and Committed issues. Refer to the images below for more details.
Step 5: Add the formula equation: (P2/P1)*100 to calculate the ratio in percentage. Give a custom name to your formula metric.
Step 6: Turn on the Target section and opt for a Fixed target.
Step 7: Select “Per x-axis item” as the target type and set the value to 100.
Utilize our app’s sprint metrics filtering options to specify issue states and combine them as needed for your reporting requirements. The image on the left displays the configuration for Parameter 1, while the image on the right illustrates it for Parameter 2.
Here’s a video guide for this configuration:
To explore more about our app’s features, refer to the User Guide, gain inspiration from our KPI Examples or contact our Support team for demo or assistance!
Start your 30 days free trial of Performance Objectives: Charts for Jira from Atlassian Marketplace.