Table of Contents
In this article, we’ll explore how you can leverage the powerful capabilities of the Performance Objectives app to create basic Jira forecasting reports, make informed decisions, optimize resource allocation, and stay ahead of the curve in today’s dynamic business environment.
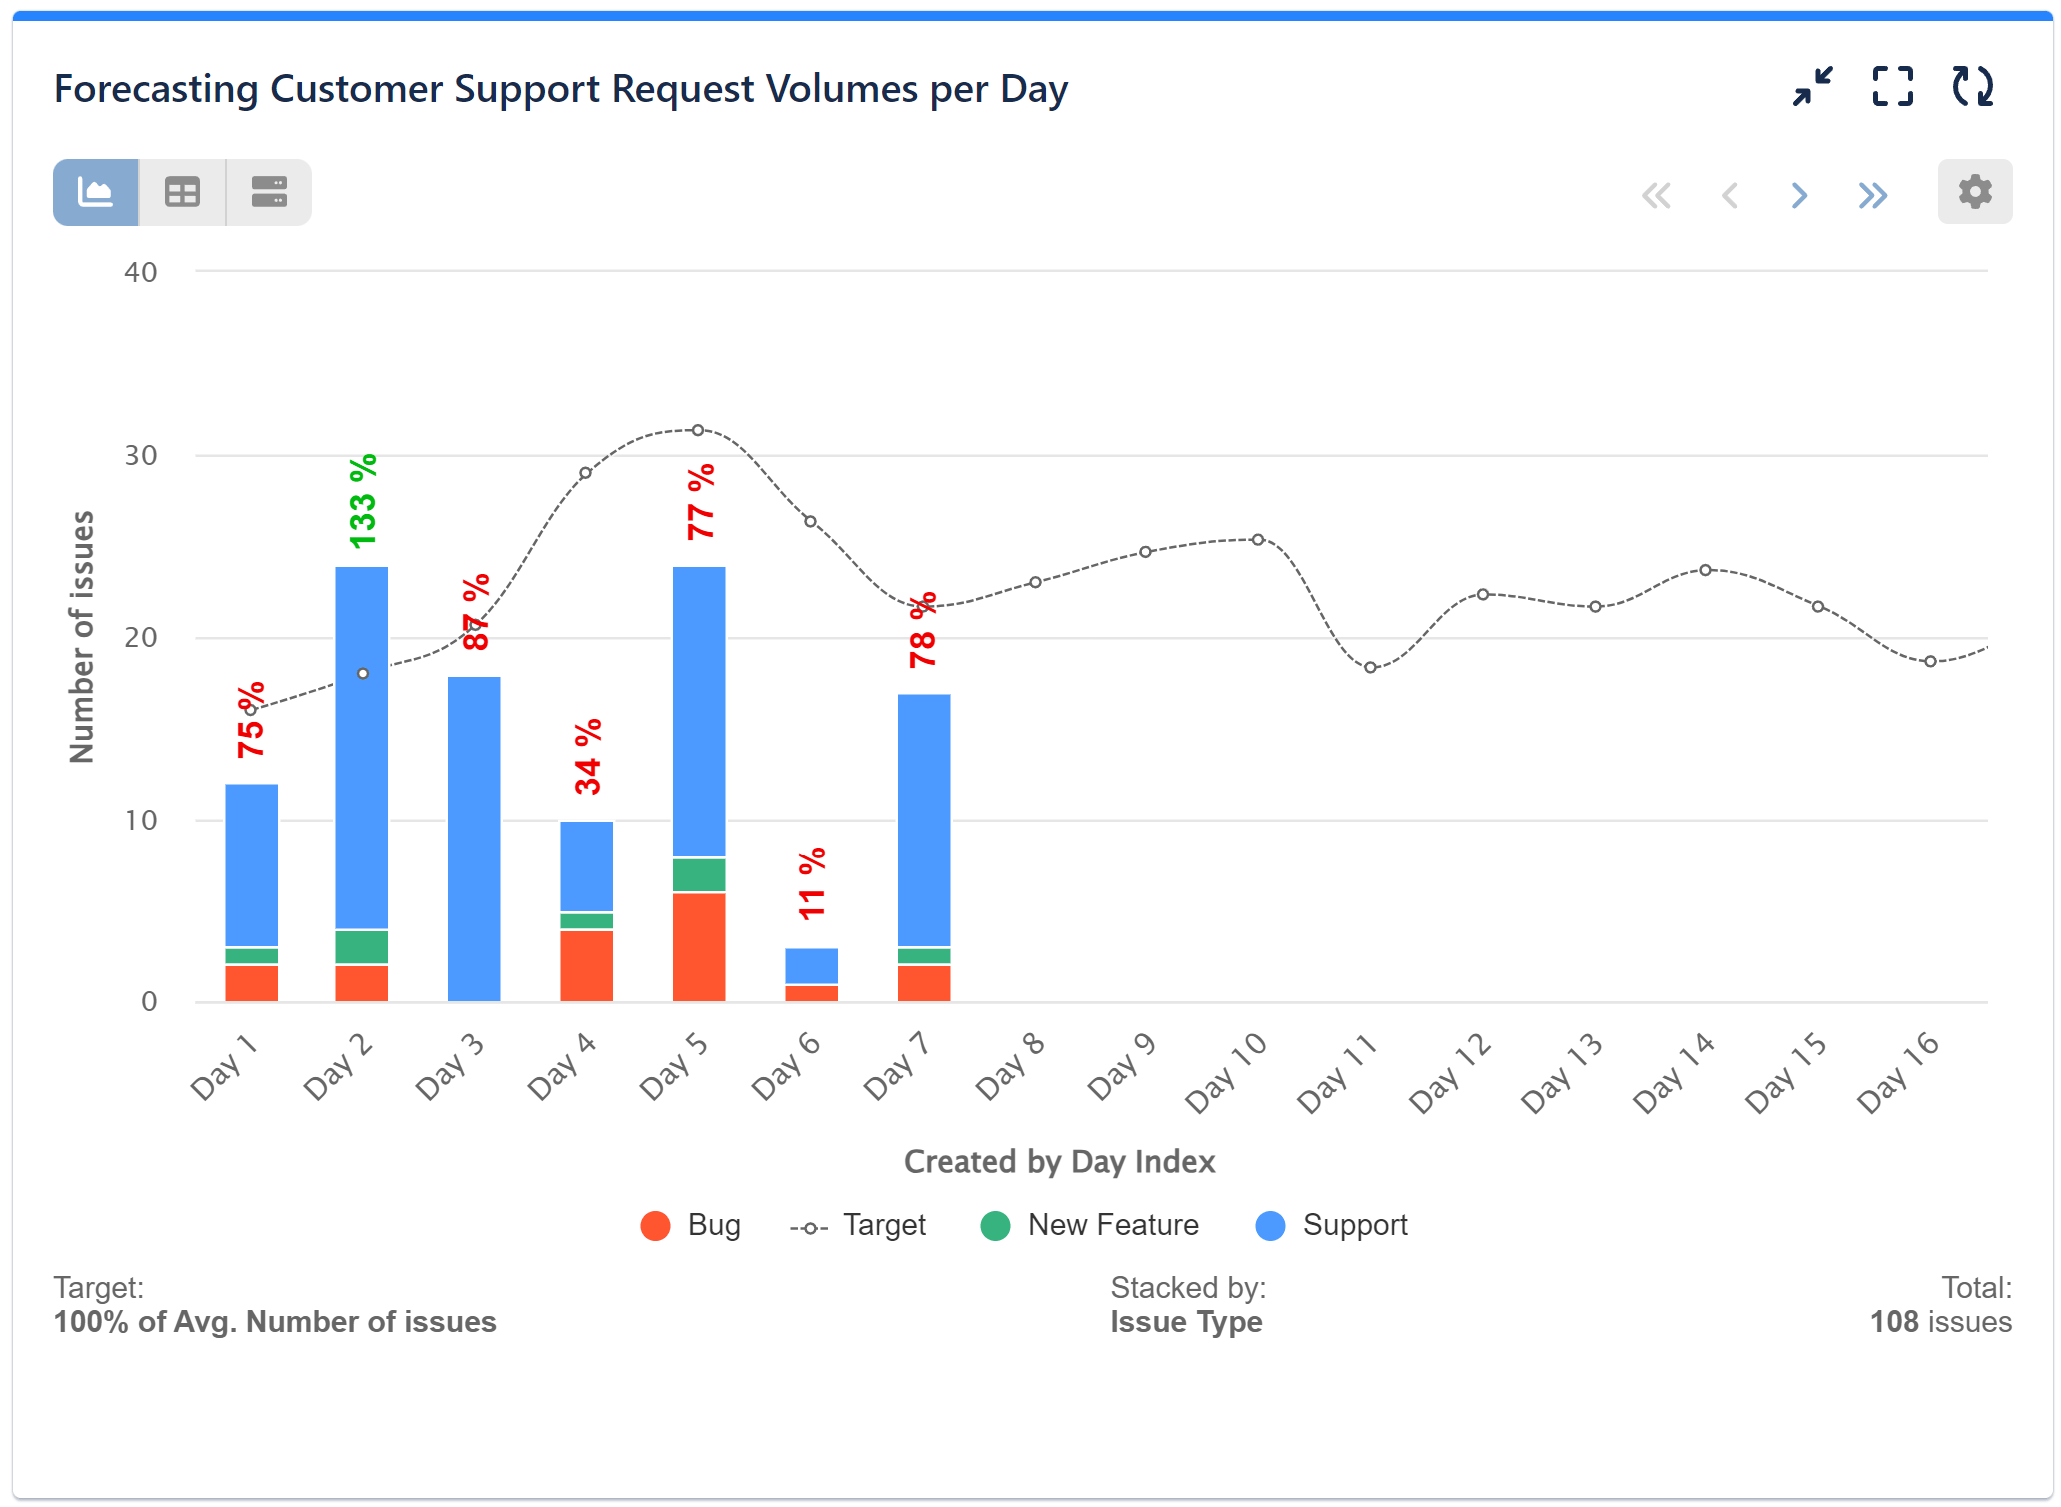
Jira Forecasting Report – Customer Support Request Volumes
The generated report below displays the expected customer support request volumes per day for the current quarter, based on the actual number of issues created in the past quarter. A forecasting trendline is visualized on the chart, providing insights into the anticipated volume trends over time. Additionally, we have stacked the data by ‘Issue type’ for richer insights. By leveraging multiple data sources, target feature, and calculating moving averages from historical data, the Performance Objectives app facilitates the creation of basic, yet insightful forecasting reports enhancing your strategic planning, resource allocation and decision making processes.
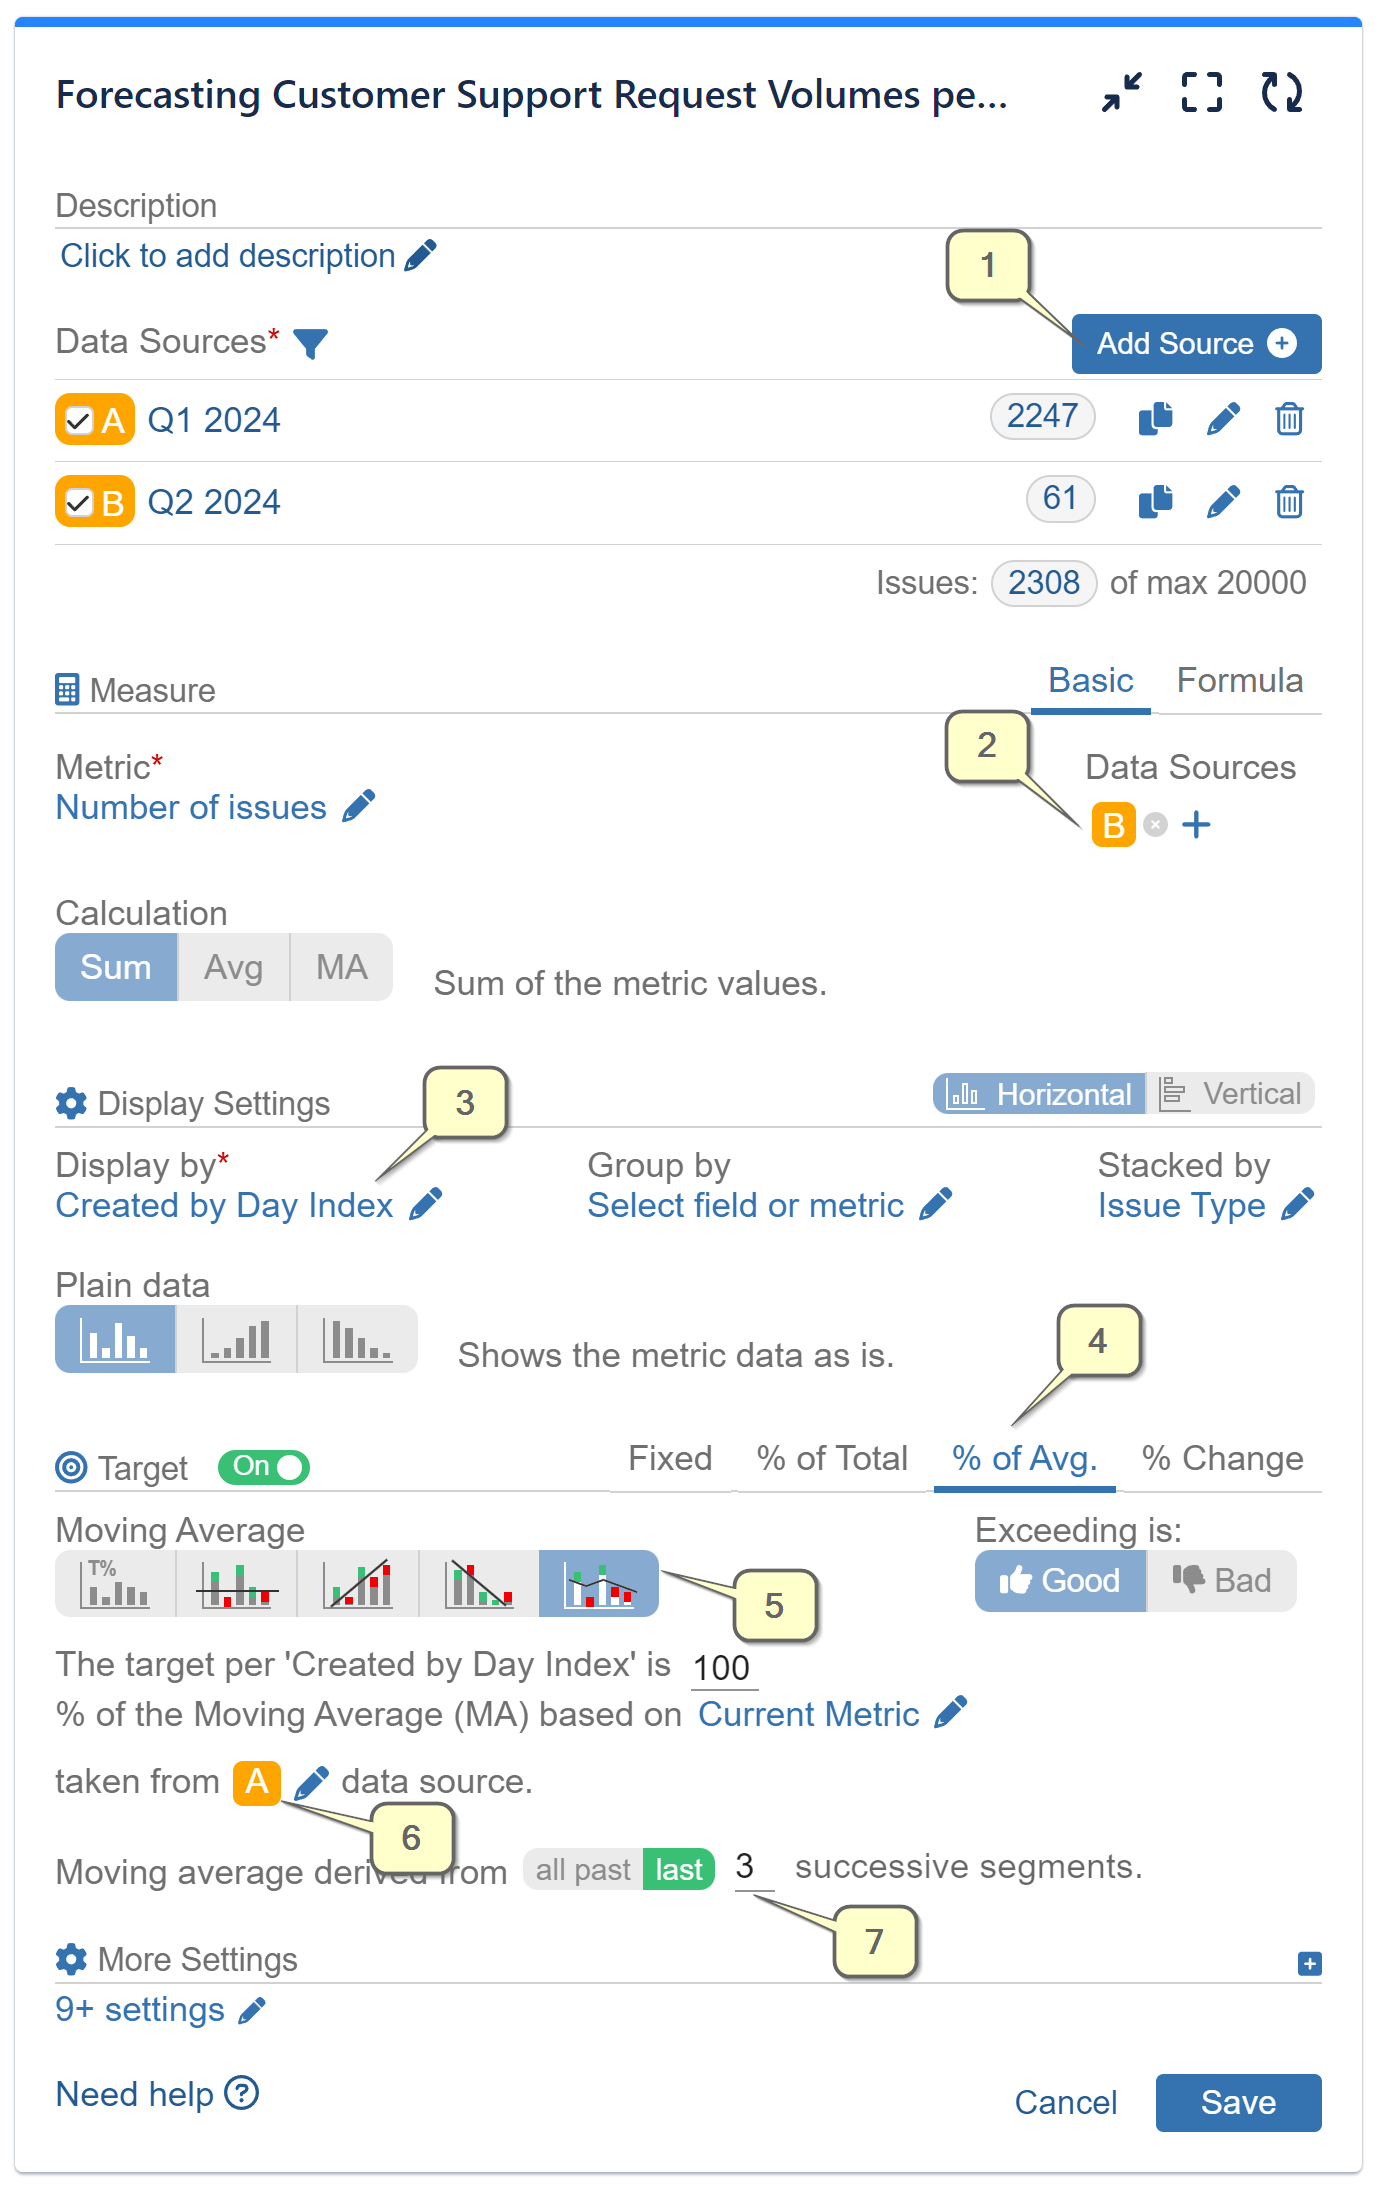
Here are the steps to create this report:
Step 1: Add two data sources. Data Source “A” must filter issues from a past period, while Data Source “B” should filter the issues for the current period for which you want to forecast.
Step 2: Keep the default metric “Number of issues,” but select Data Source “B” for it.
Step 3: Display the data by a date field that matches the one in your data source, and activate the “Show days by index” option. In our sample, we have chosen “Created” and specified “by Day,” but you may opt for week, month, quarter, or year.
In our sample, we have Stacked by ‘Issue type’, but please note that this step is optional.
Step 4: Turn on the Target feature and select “% of Avg.”
Step 5: Select “Moving Average” as the target type.
Step 6: For the target metric, choose Data Source “A.”
Step 7: Specify the number of successive segments based on which your target will be calculated. In our example, it is 3.
Keep in mind that the more past segments you include in the calculation, the smoother the resulting average will be. This is because each additional data point included in the average has less influence on the overall average as more data points are included. It’s essential to consider the trade-offs between responsiveness and smoothness when choosing the window size for a moving average, as a larger window size can introduce more lag in detecting changes in the data.
Understanding Moving Averages
Moving averages are a fundamental statistical method used to analyze time series data by smoothing out fluctuations to identify trends. By calculating the average of a subset of past data points, moving averages provide insights into the direction and momentum of a trend. If you want to learn more about the applications of the Moving Average feature within our app, read the respective article.
Selecting the Date Range and Granularity
With our app, you can determine the time frame and granularity of data you want to analyze. Whether it’s weekly, monthly, quarterly, or yearly reports, Performance Objectives for Jira allows you to customize the date range selected in the Data Sources to suit your forecasting needs. Learn more about our app’s Data Segmentation and Multiple Data Sources options in the respective article. To make sense, it is essential that you select a date field (for example ‘Created’) for your ‘Display by’ option, or, in other words, what’s on the x-axis of the chart. In our Configuration Overview you may find a list of all metrics and fields supported by the app.
Check our User Guide to explore the app’s features or read the KPI examples for inspiration on insightful reports for your Jira dashboard.
Start your 30 days free trial of Performance Objectives: Charts for Jira from Atlassian Marketplace.