Simplify Dashboard Management with Saved Filters
With the Performance Objectives app, you can effortlessly copy and duplicate the app’s chart configurations across dashboards or Jira instances. However, there are times when you only need to reuse the data source across gadgets, not the entire chart configuration. Reusing data source settings in different charts offers numerous benefits in terms of consistency, efficiency, accuracy, and scalability, making it a valuable practice for optimizing your Jira dashboard experience.
With the Performance Objectives app, you can seamlessly utilize your Saved Filters as a singular data source for generating charts and reports. Update your Saved Filter and watch as all gadgets on your Jira Dashboard automatically adjust, giving you effortless control. Merge two or more filters for insightful comparisons, and effortlessly integrate them across various gadgets on your dashboard, ensuring a consistent depiction of reported data. Let’s see how.
Reuse Chart Data Configurations for Optimized Jira Dashboards
Follow these simple steps to create Saved Filters out of your Data Source chart settings, reuse and leverage them as data source for your other dashboard gadgets in Jira. This approach grants you unmatched control over all gadgets on your dashboards using the saved filter, automatically adjusting them whenever you make edits to the filter.
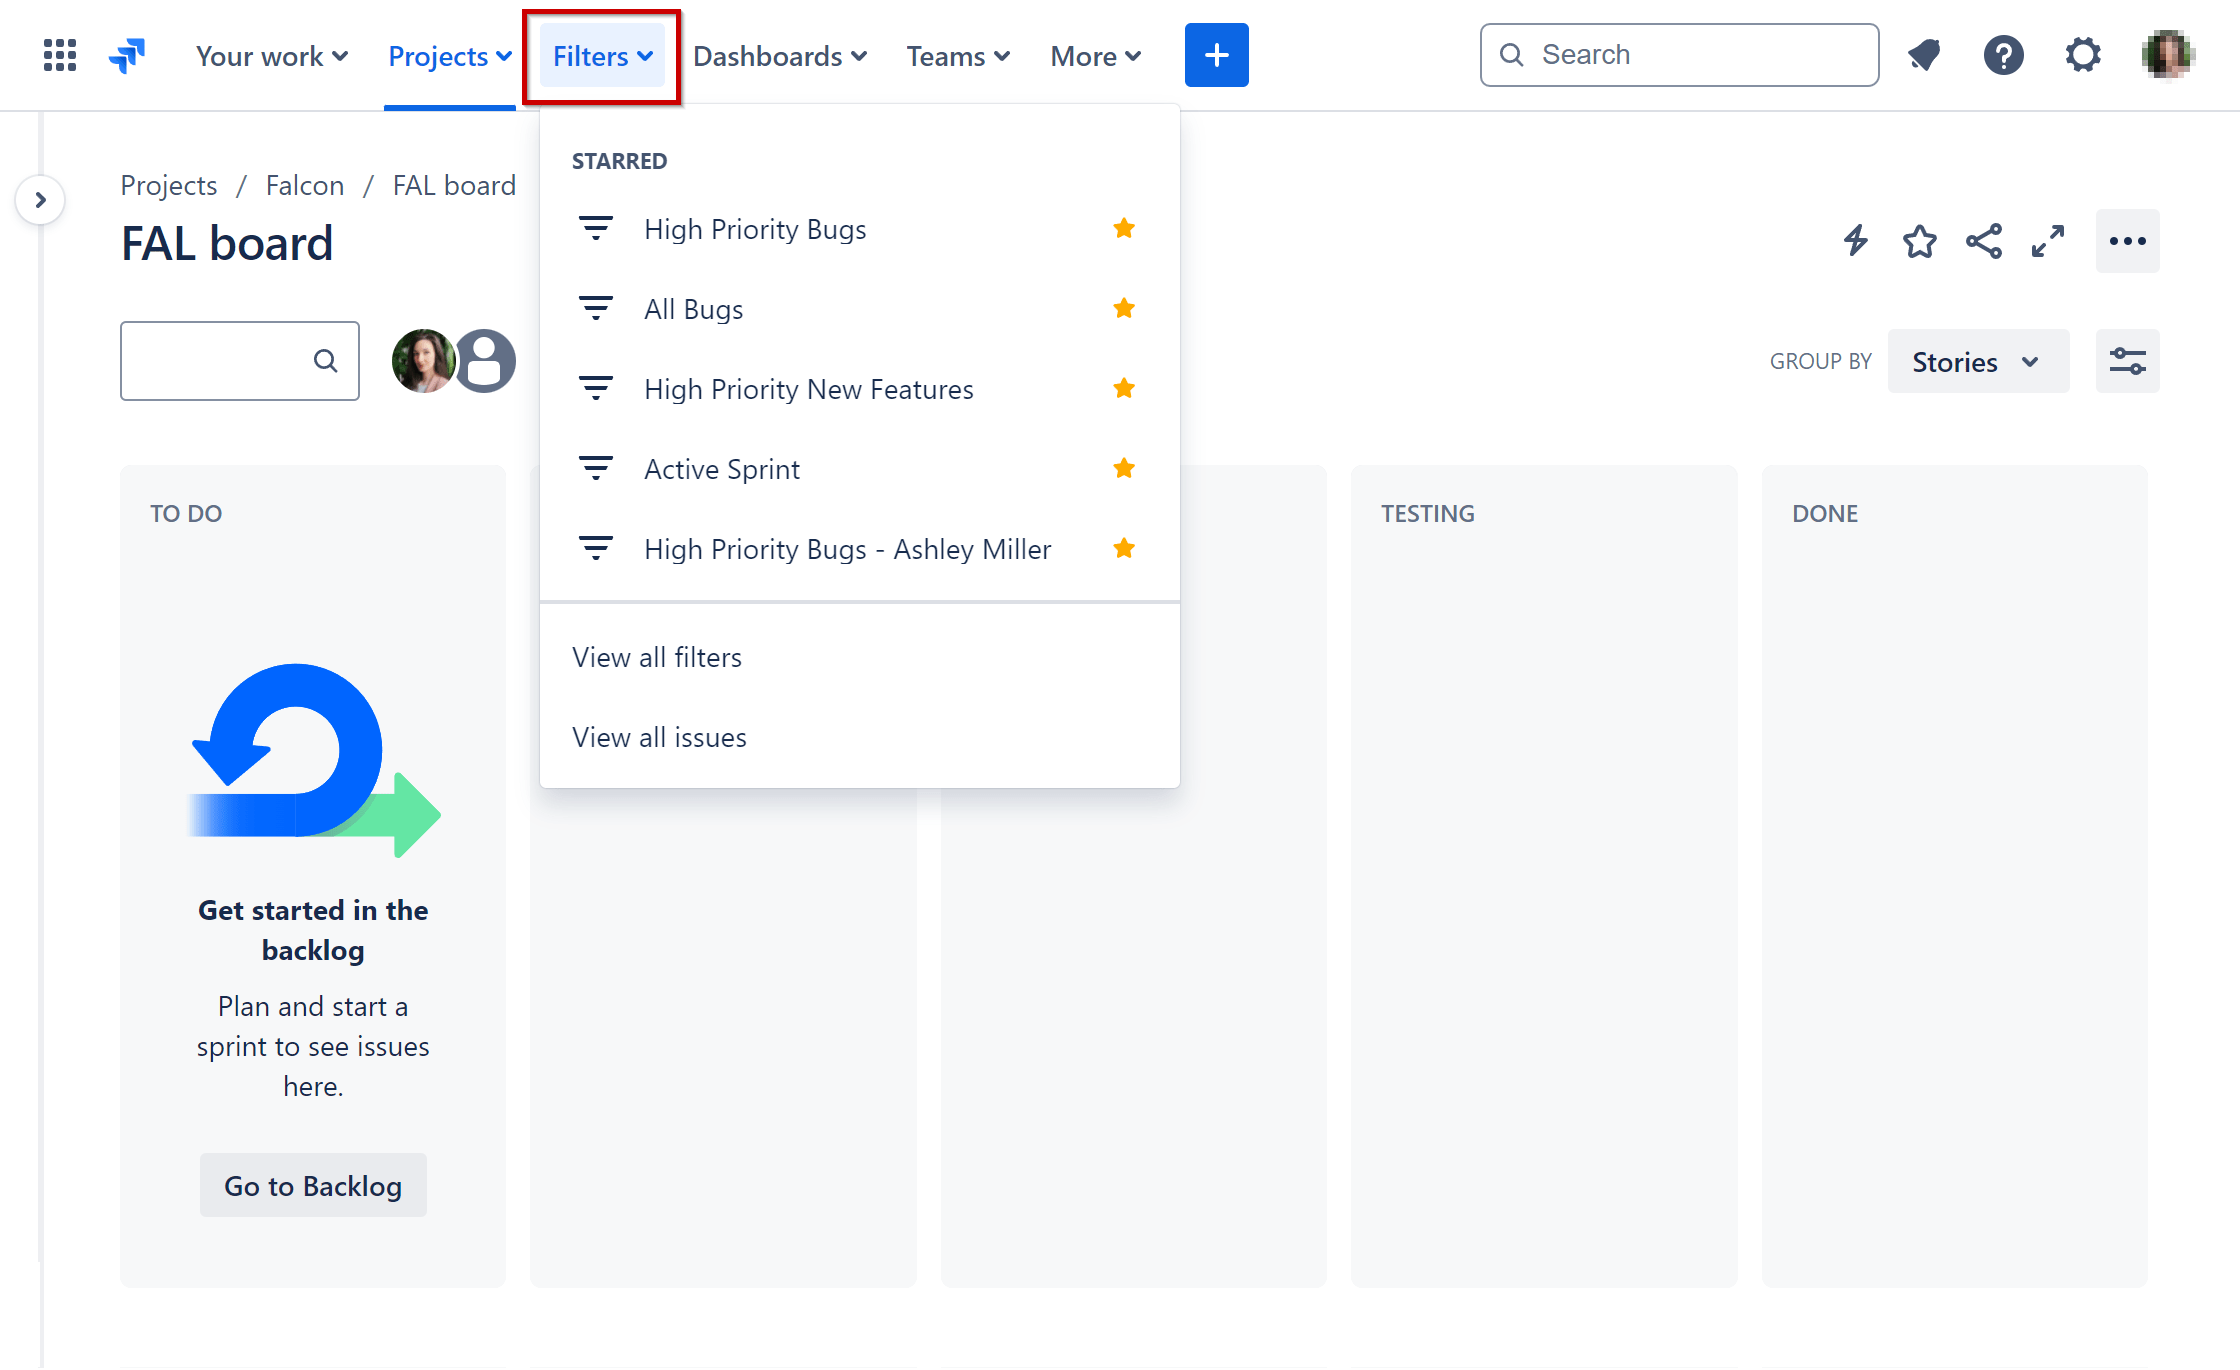
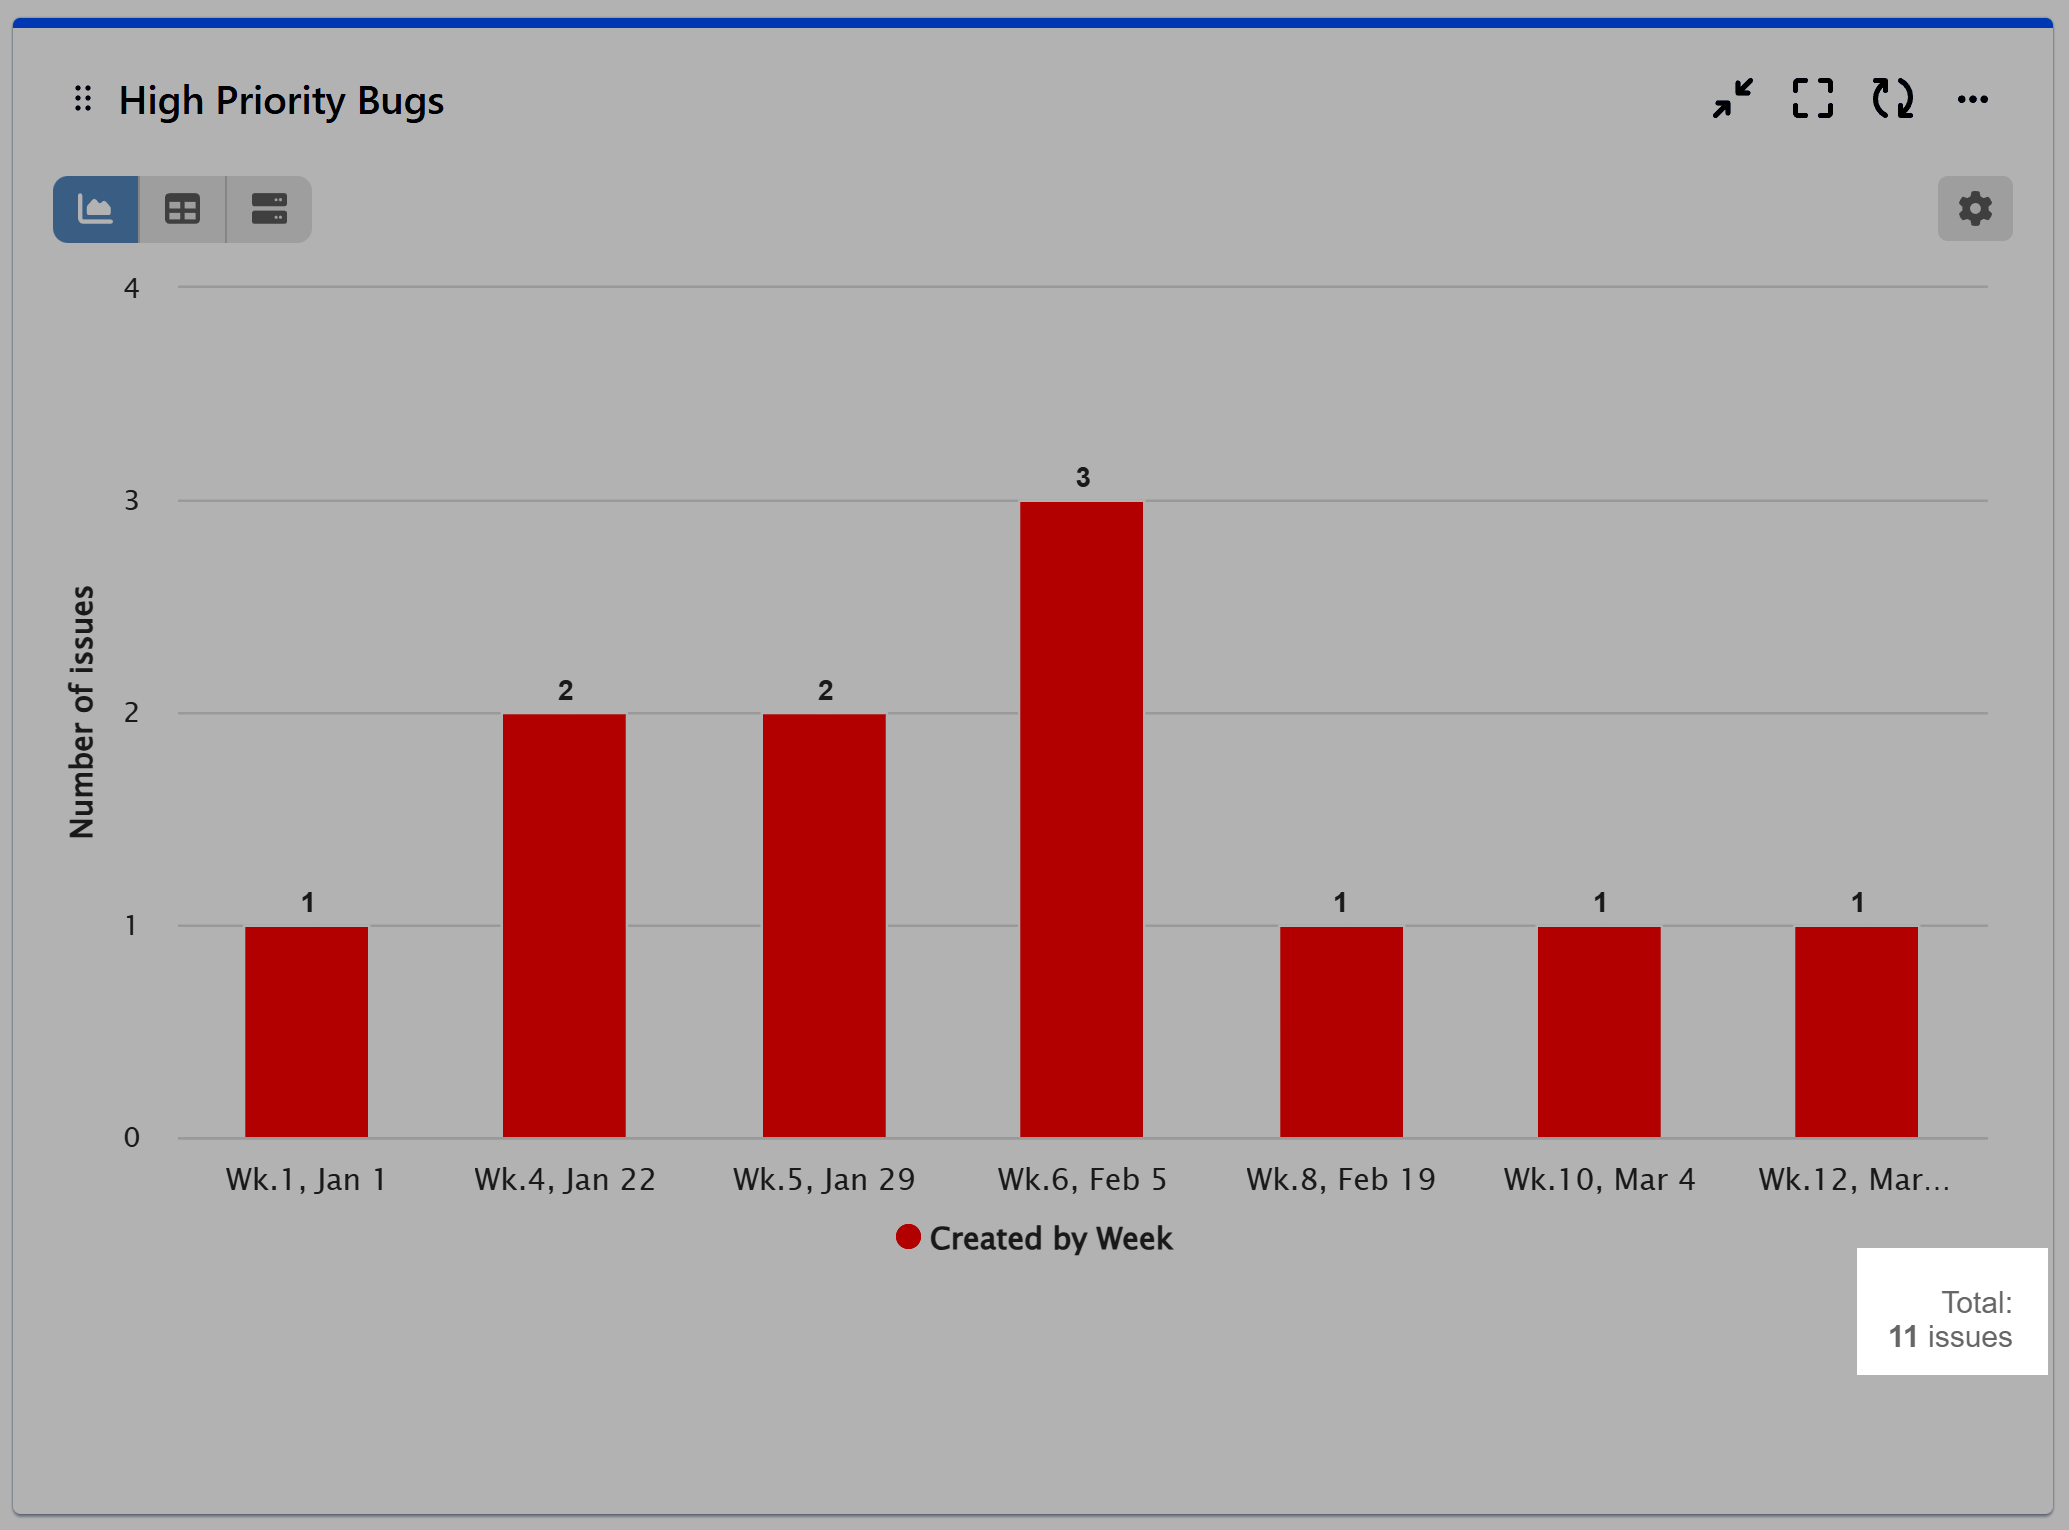
Step 1: Navigate to the desired chart configuration and click on the totals displayed on the chart to access the underlying data. Alternatively, you can access the issue list by clicking on the Total directly from the Data Source configuration.
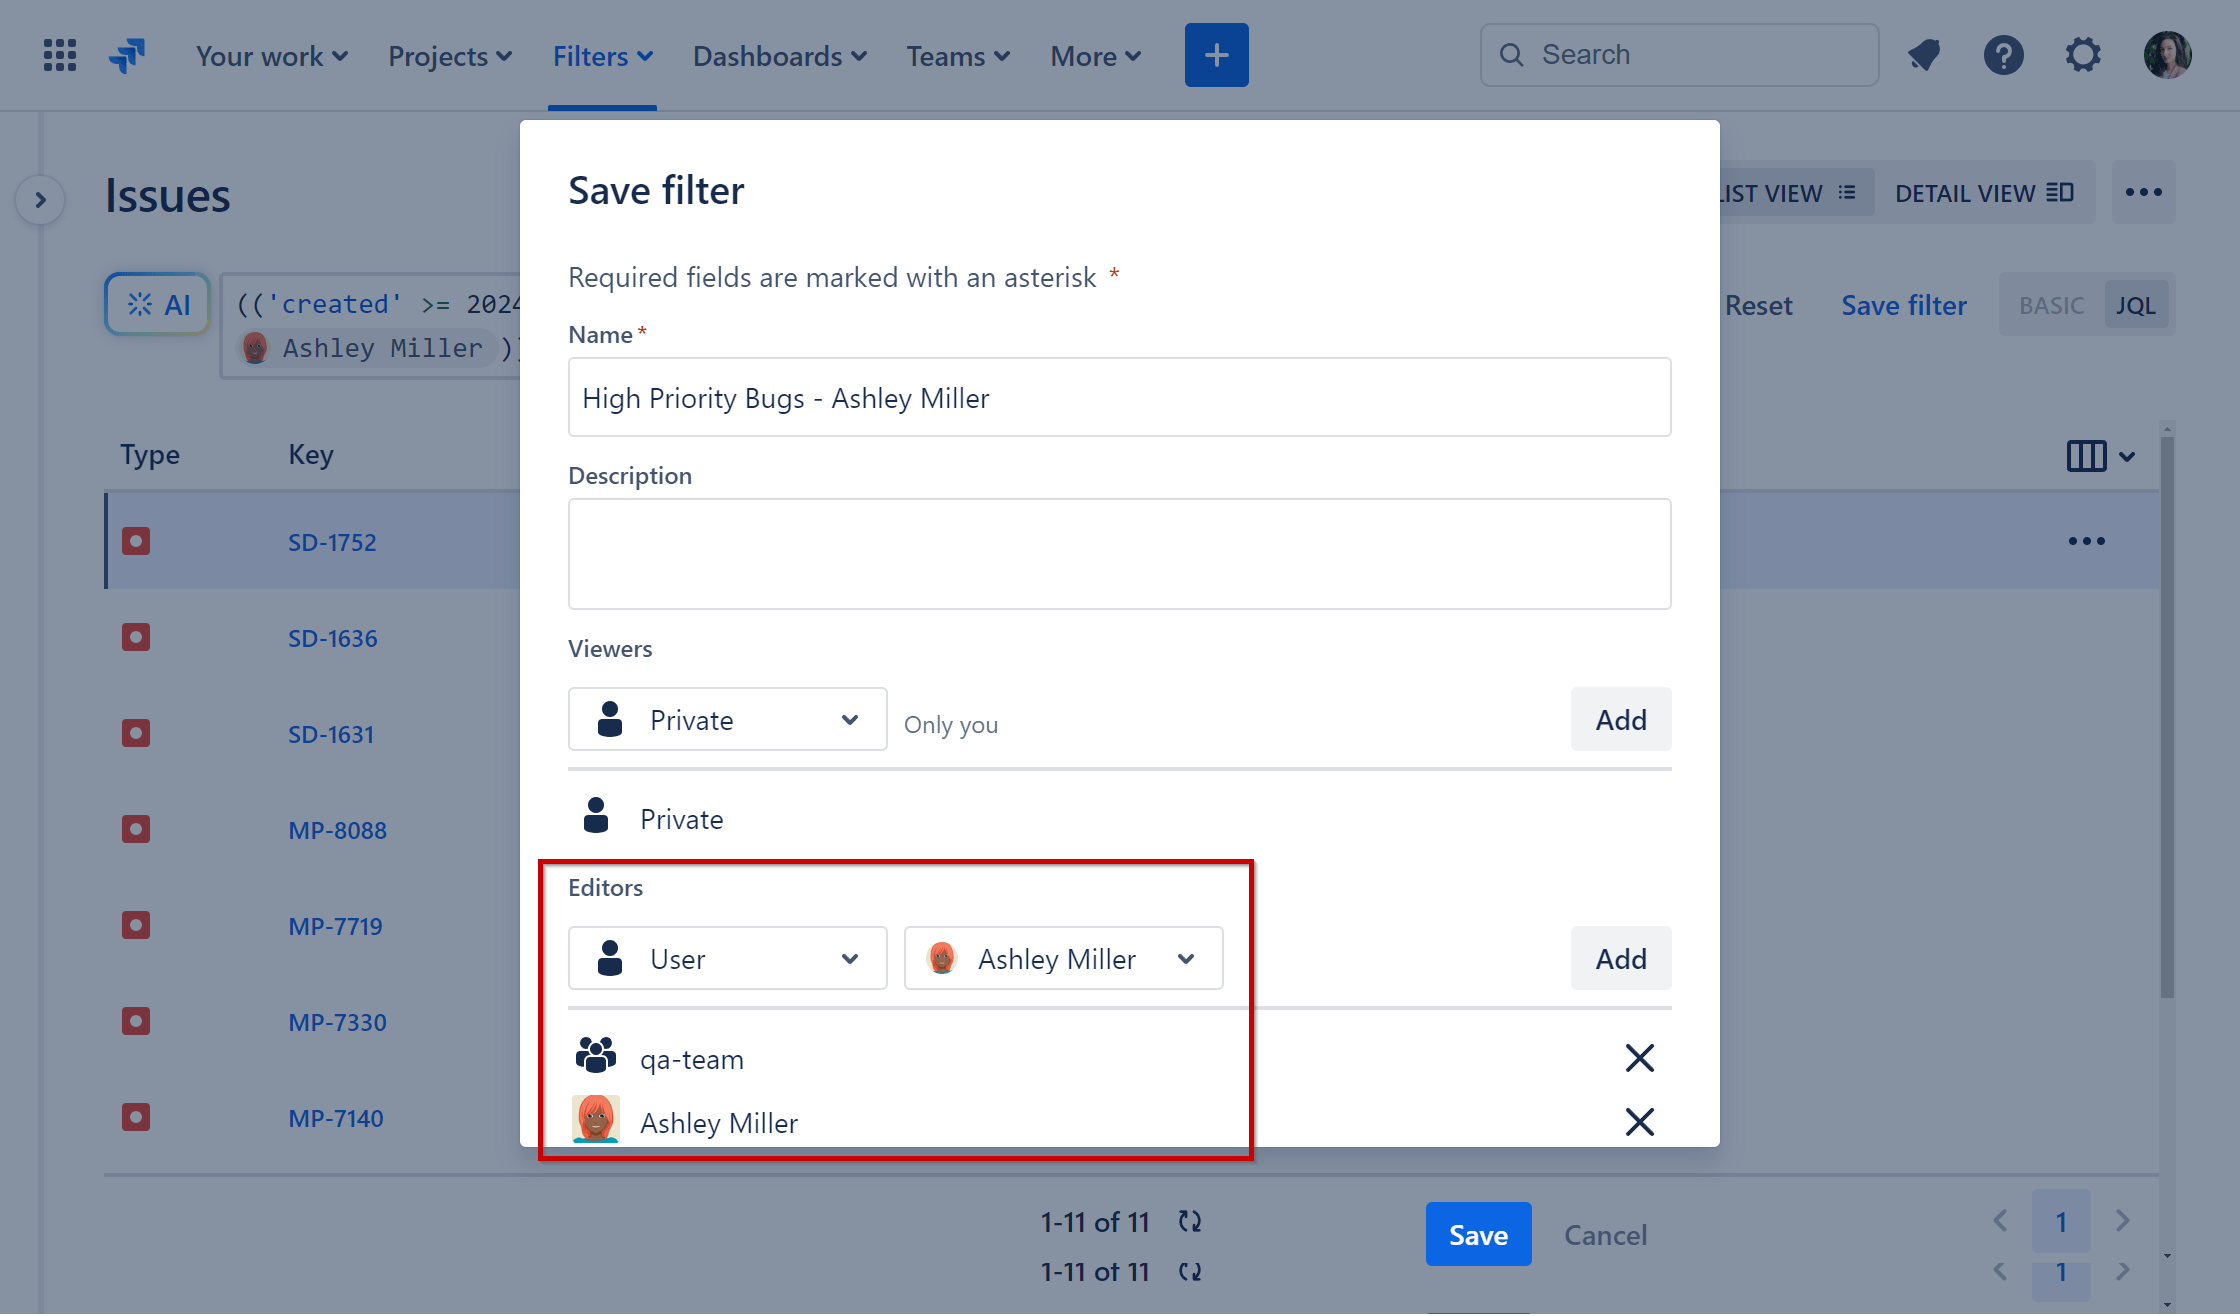
Step 2: On the Search Issues page in Jira, save the retrieved data into a custom filter.
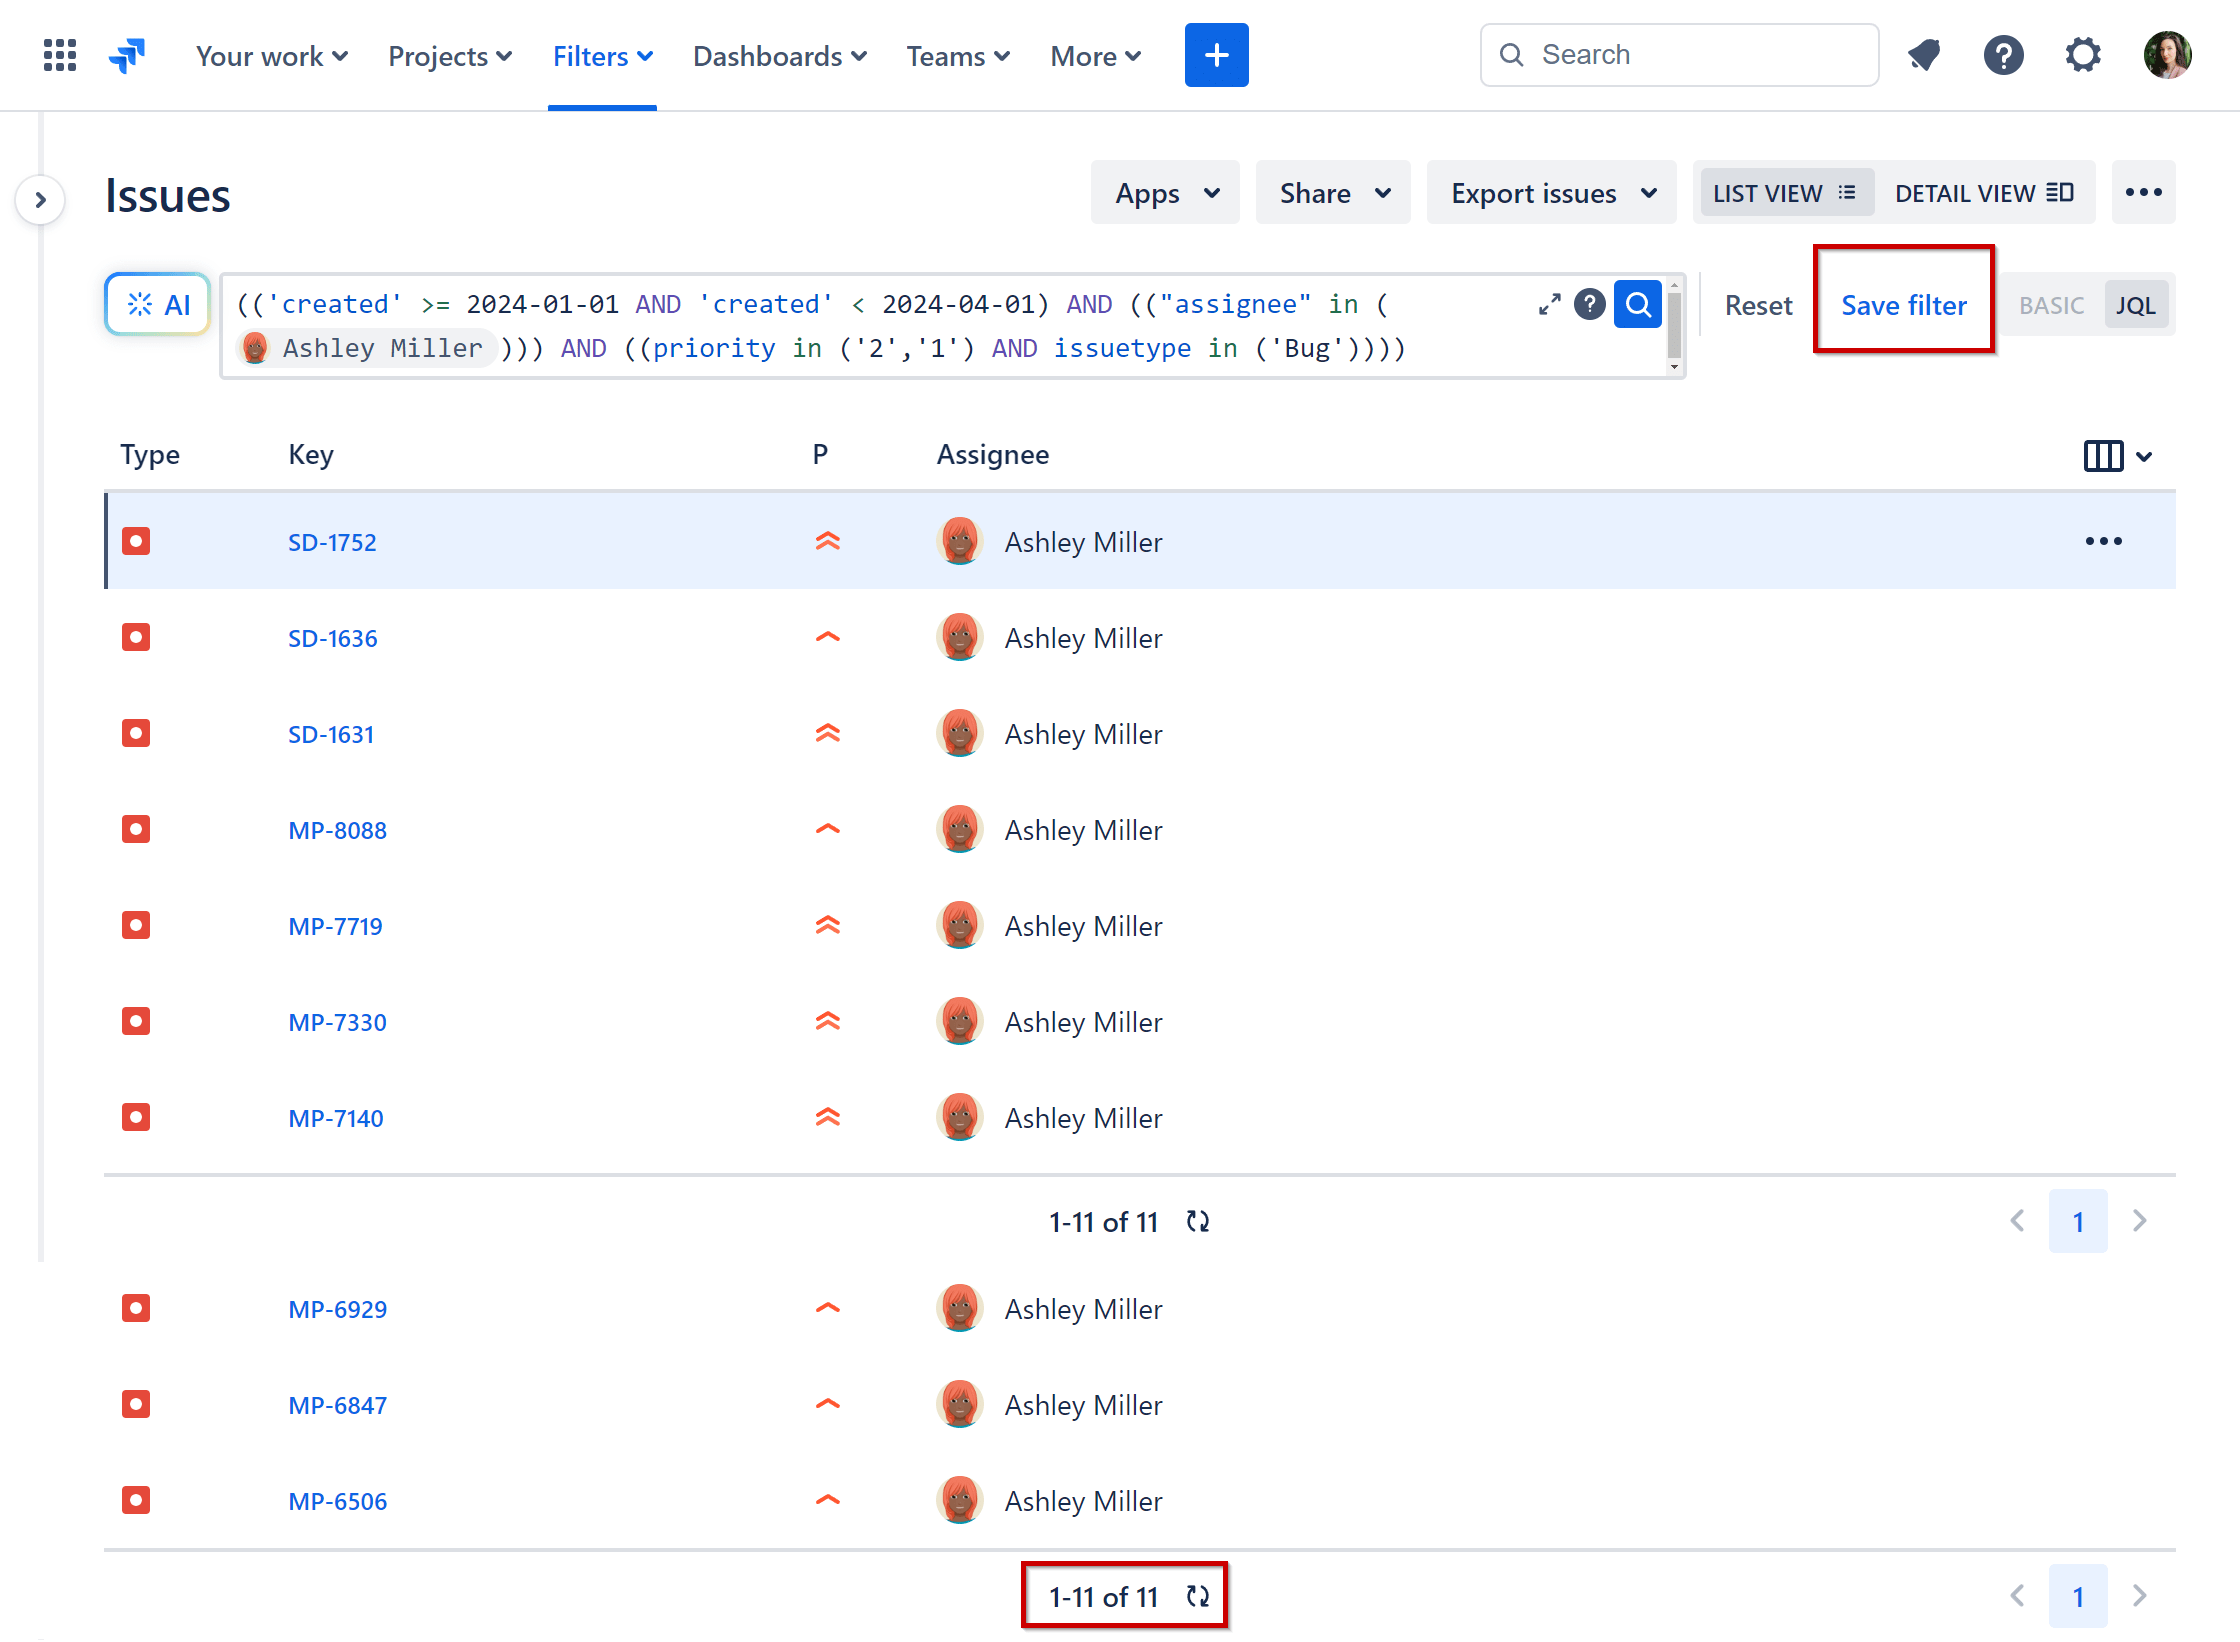
Step 3: Give the filter a descriptive name for easy reference and edit permissions to share the saved filter with other users.
Please remember that if you haven’t shared the saved filter, even though you’ve shared the dashboard with stakeholders, they won’t have access to the chart configurations created with that filter.
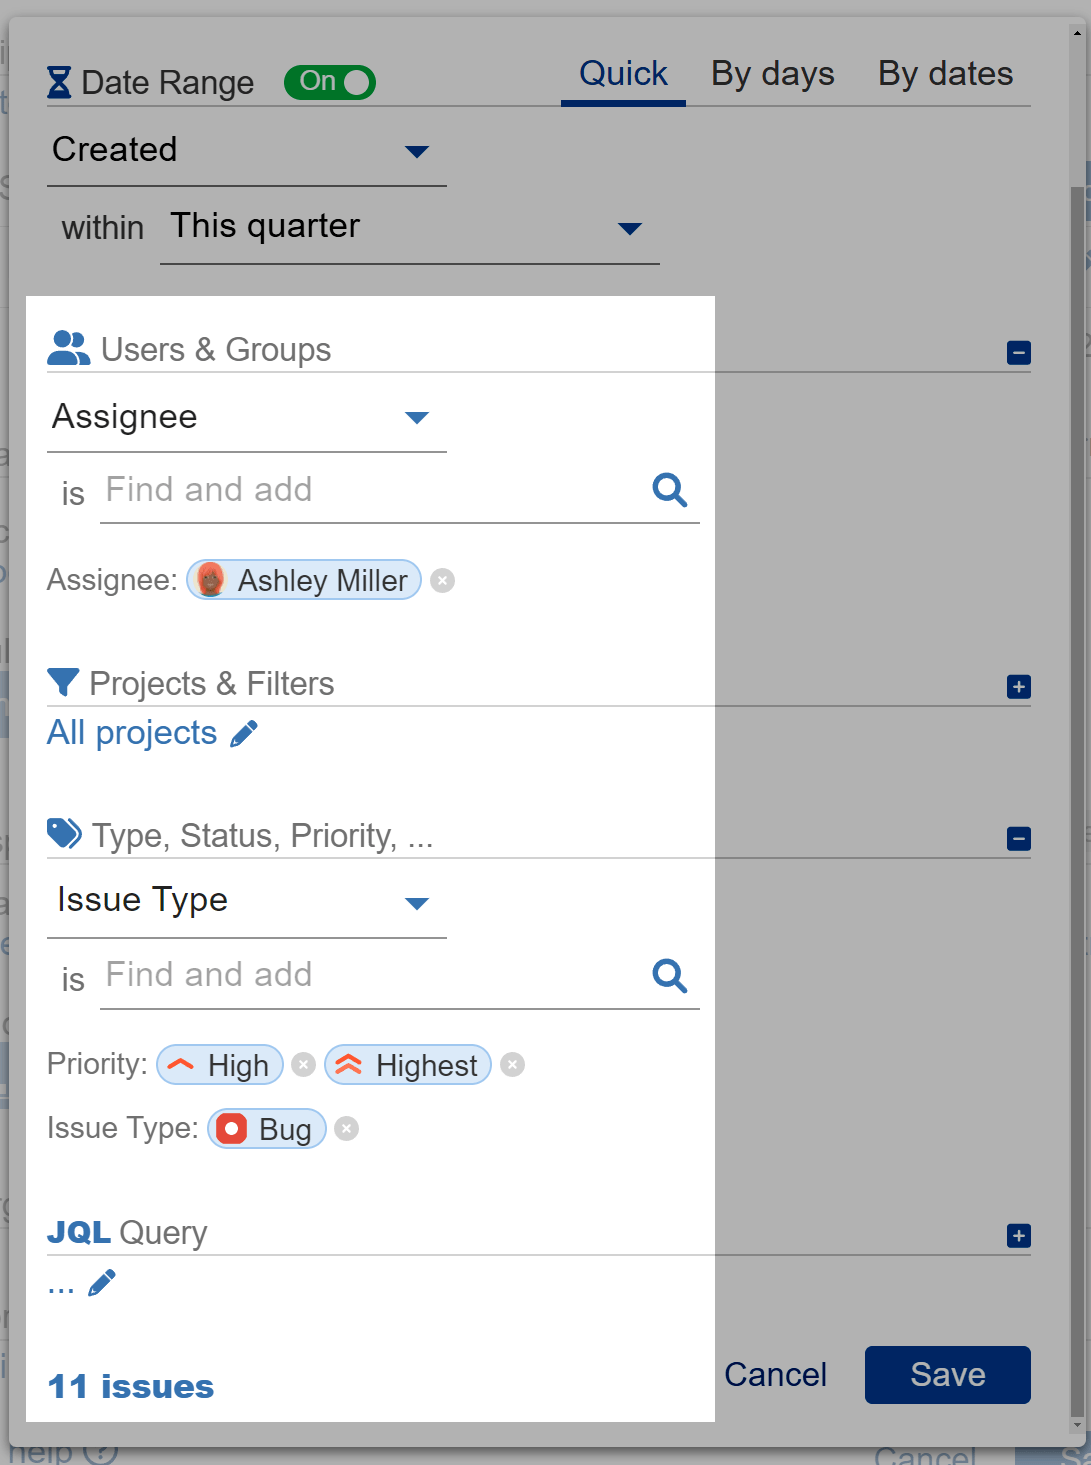
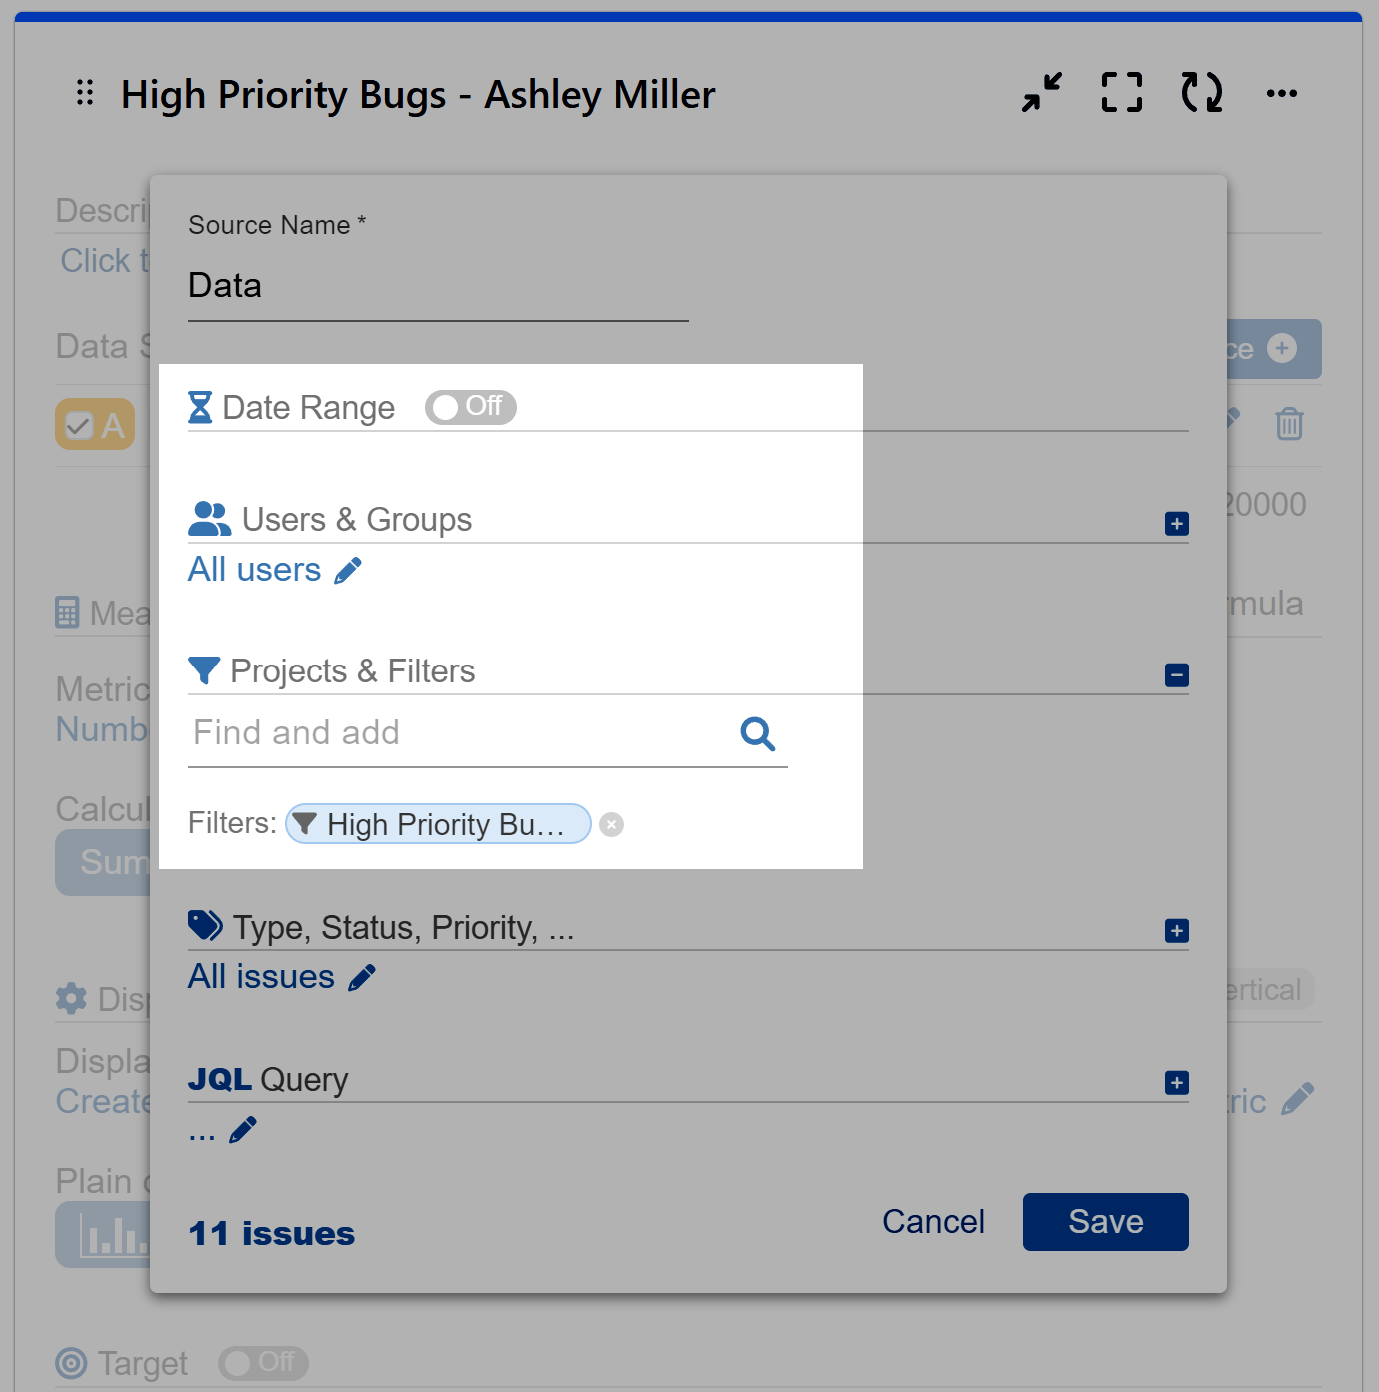
Step 4: Navigate to any other gadget within our app on your Jira dashboard. Disable the “Date Range” option and select the newly created saved data filter under “Projects & FIlters” to reuse the same dataset.
By utilizing saved filters in the Performance Objectives app, you can save time by efficiently reusing data across various gadgets, eliminating the need to duplicate entire chart configurations and then adapting it to your needs. Control Jira dashboards by simply editing the saved filter selected as the data source for the gadgets on it. Watch our video tutorial here:
If you’re looking to copy and duplicate your entire gadget configurations across Jira dashboards or export and import them into different Jira instances, refer to our Import/Export Gadget Configuration article for detailed guidance. To discover more about the features of our app, refer to our User Guide.
Start your 30 days free trial of Performance Objectives: Charts for Jira from Atlassian Marketplace.