Measuring the Percent of High Severity Defects can be a valuable Key Performance Indicator (KPI) in Jira. High severity bugs often have a significant impact on the quality and stability of a software project. By tracking the percentage of high severity defects, you can gain insights into the overall health of your software development process and the potential risks associated with your product. In this article we will show you how to leverage the Formula and Target calculation capabilities of Performance Objectives and Performance Trend dashboard gadgets for effortless and insightful KPI reporting in Jira.
Enhance Work Quality: Monitor % High Severity Defects within Jira
Below is an illustrative chart that calculates the ratio between high severity issues (e.g., High, Highest, or Blocker, Critical, Major) and the total number of raised bugs within the assessed timeframe, in our case 7 months, employing the following logic and formula:
% of High Severity Defects = ( # Defects – High, Highest, or Blocker, Critical, Major / # All Defects ) * 100
In our example, we use the Jira system field “Priority.” However, you can generate such reports using your custom fields for severity and/or priority levels.
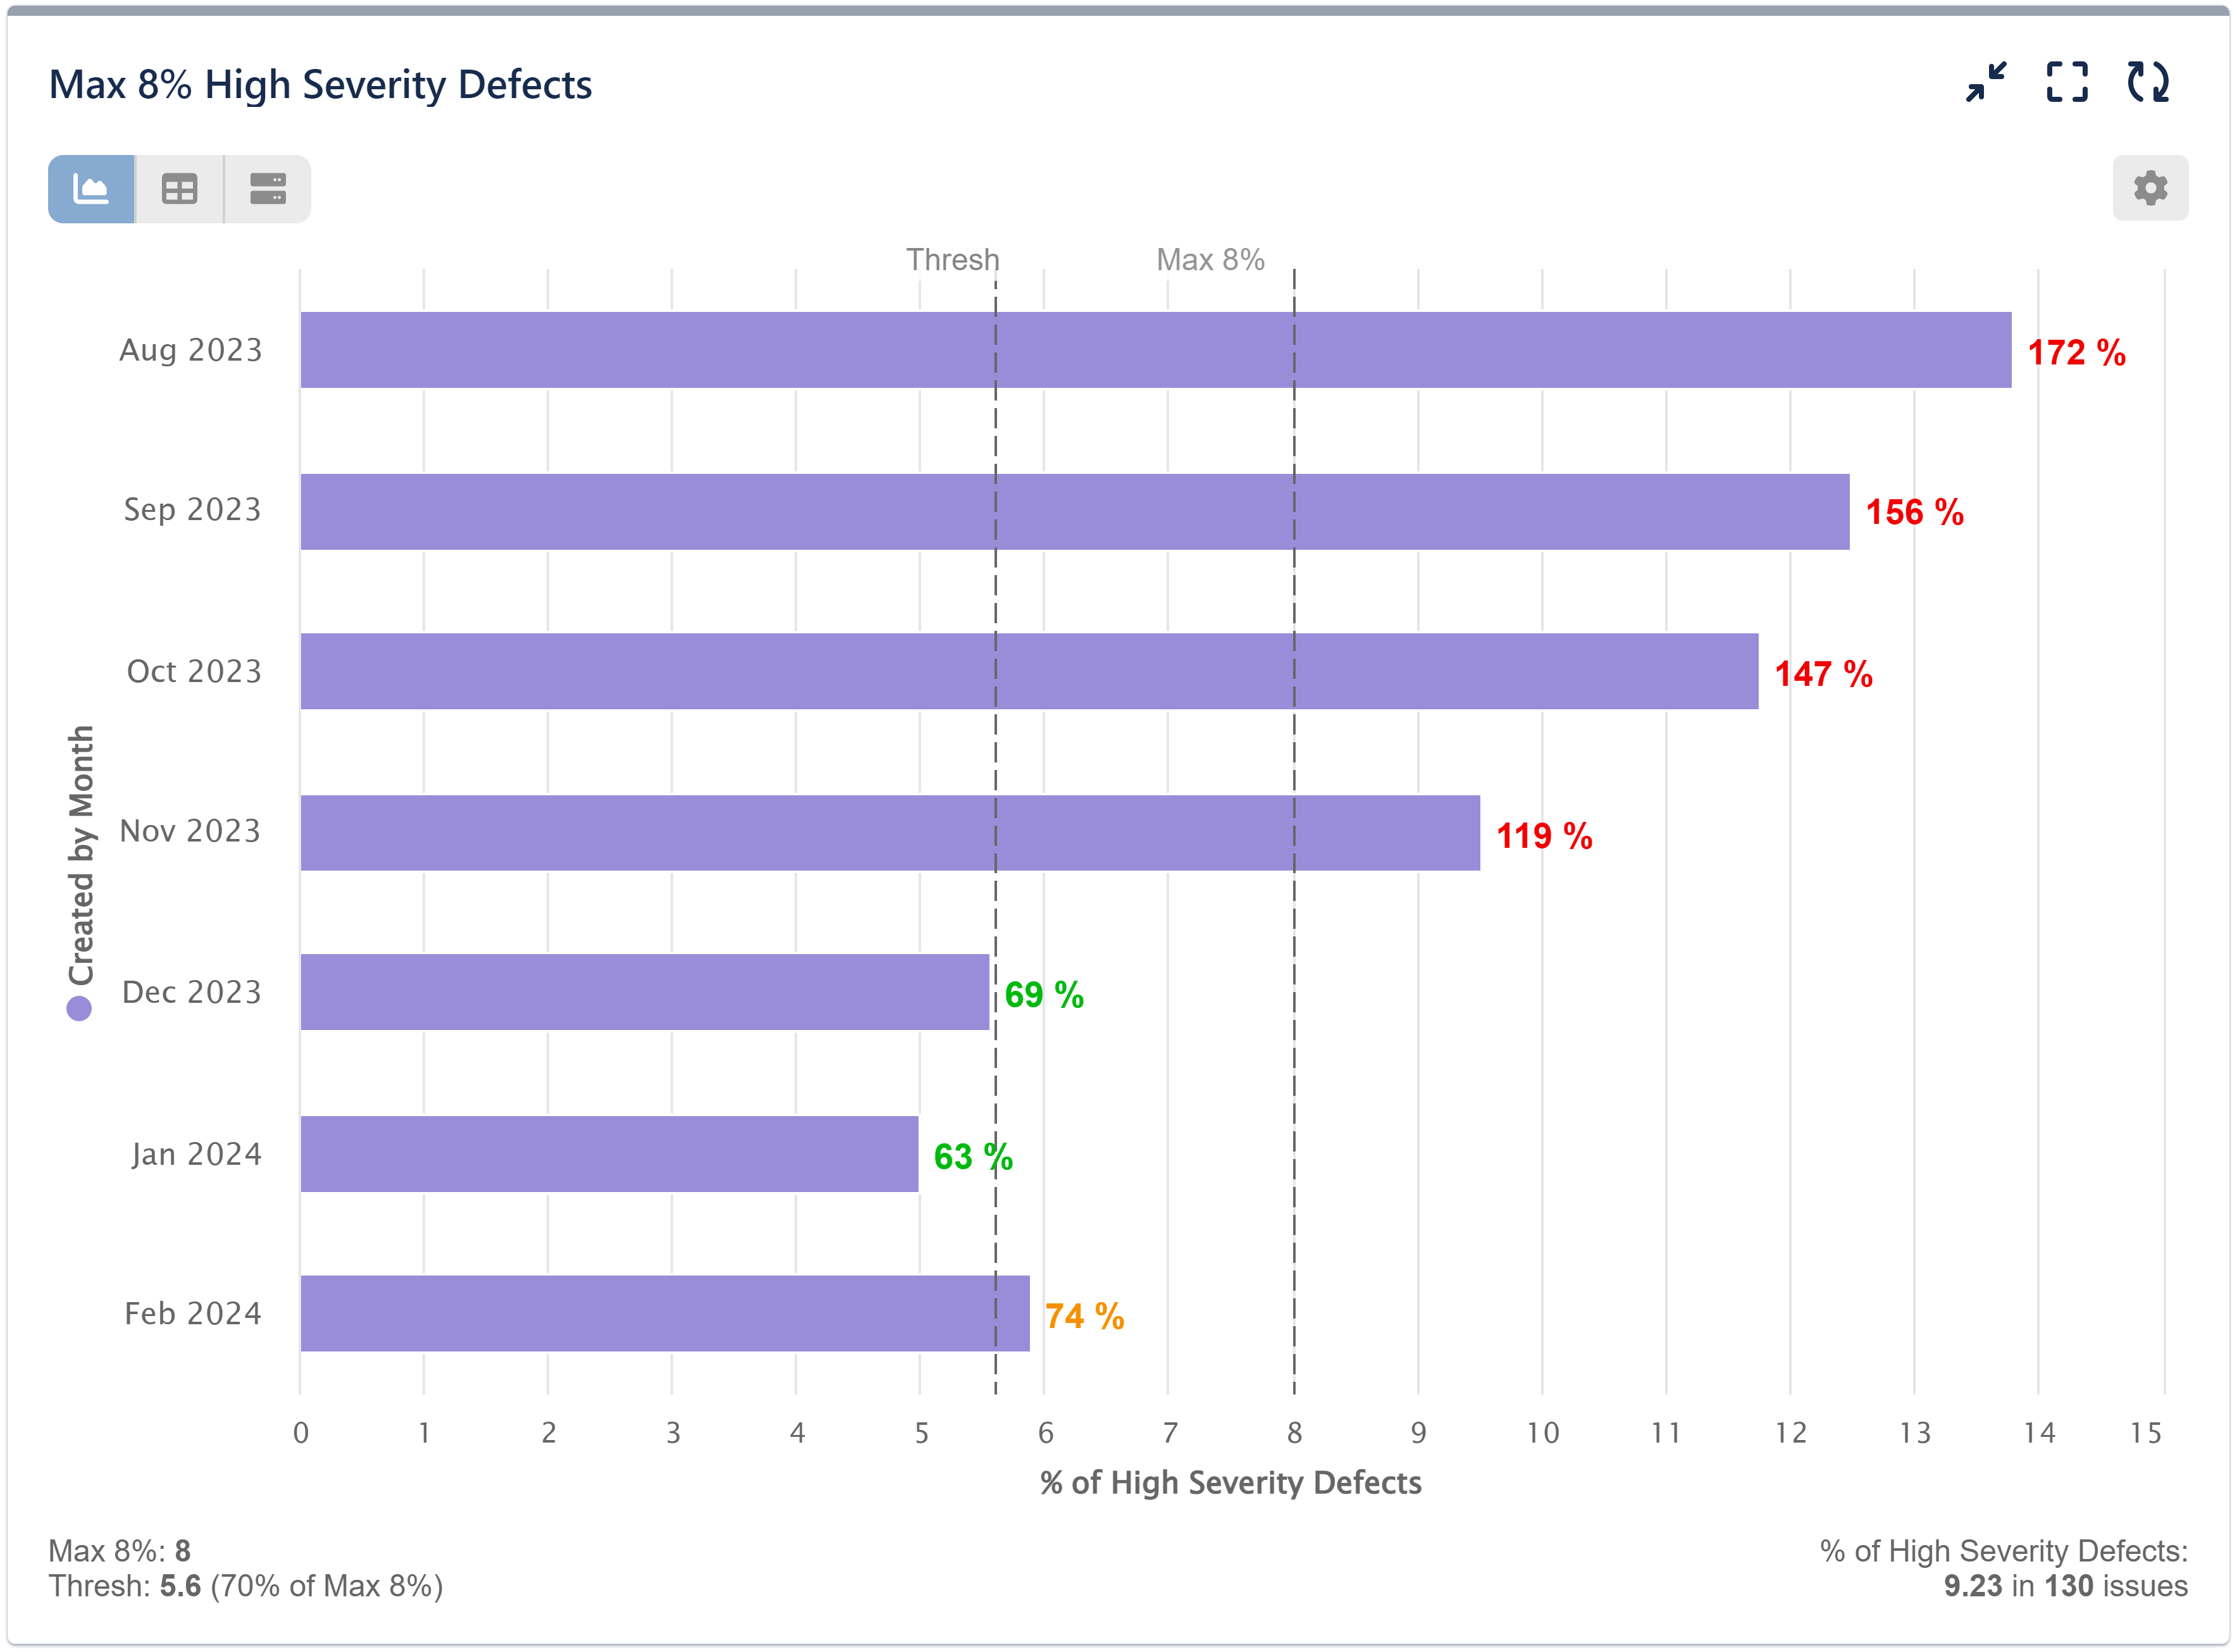
Review the following step-by-step KPI configuration employing the Performance Objectives dashboard gadget:
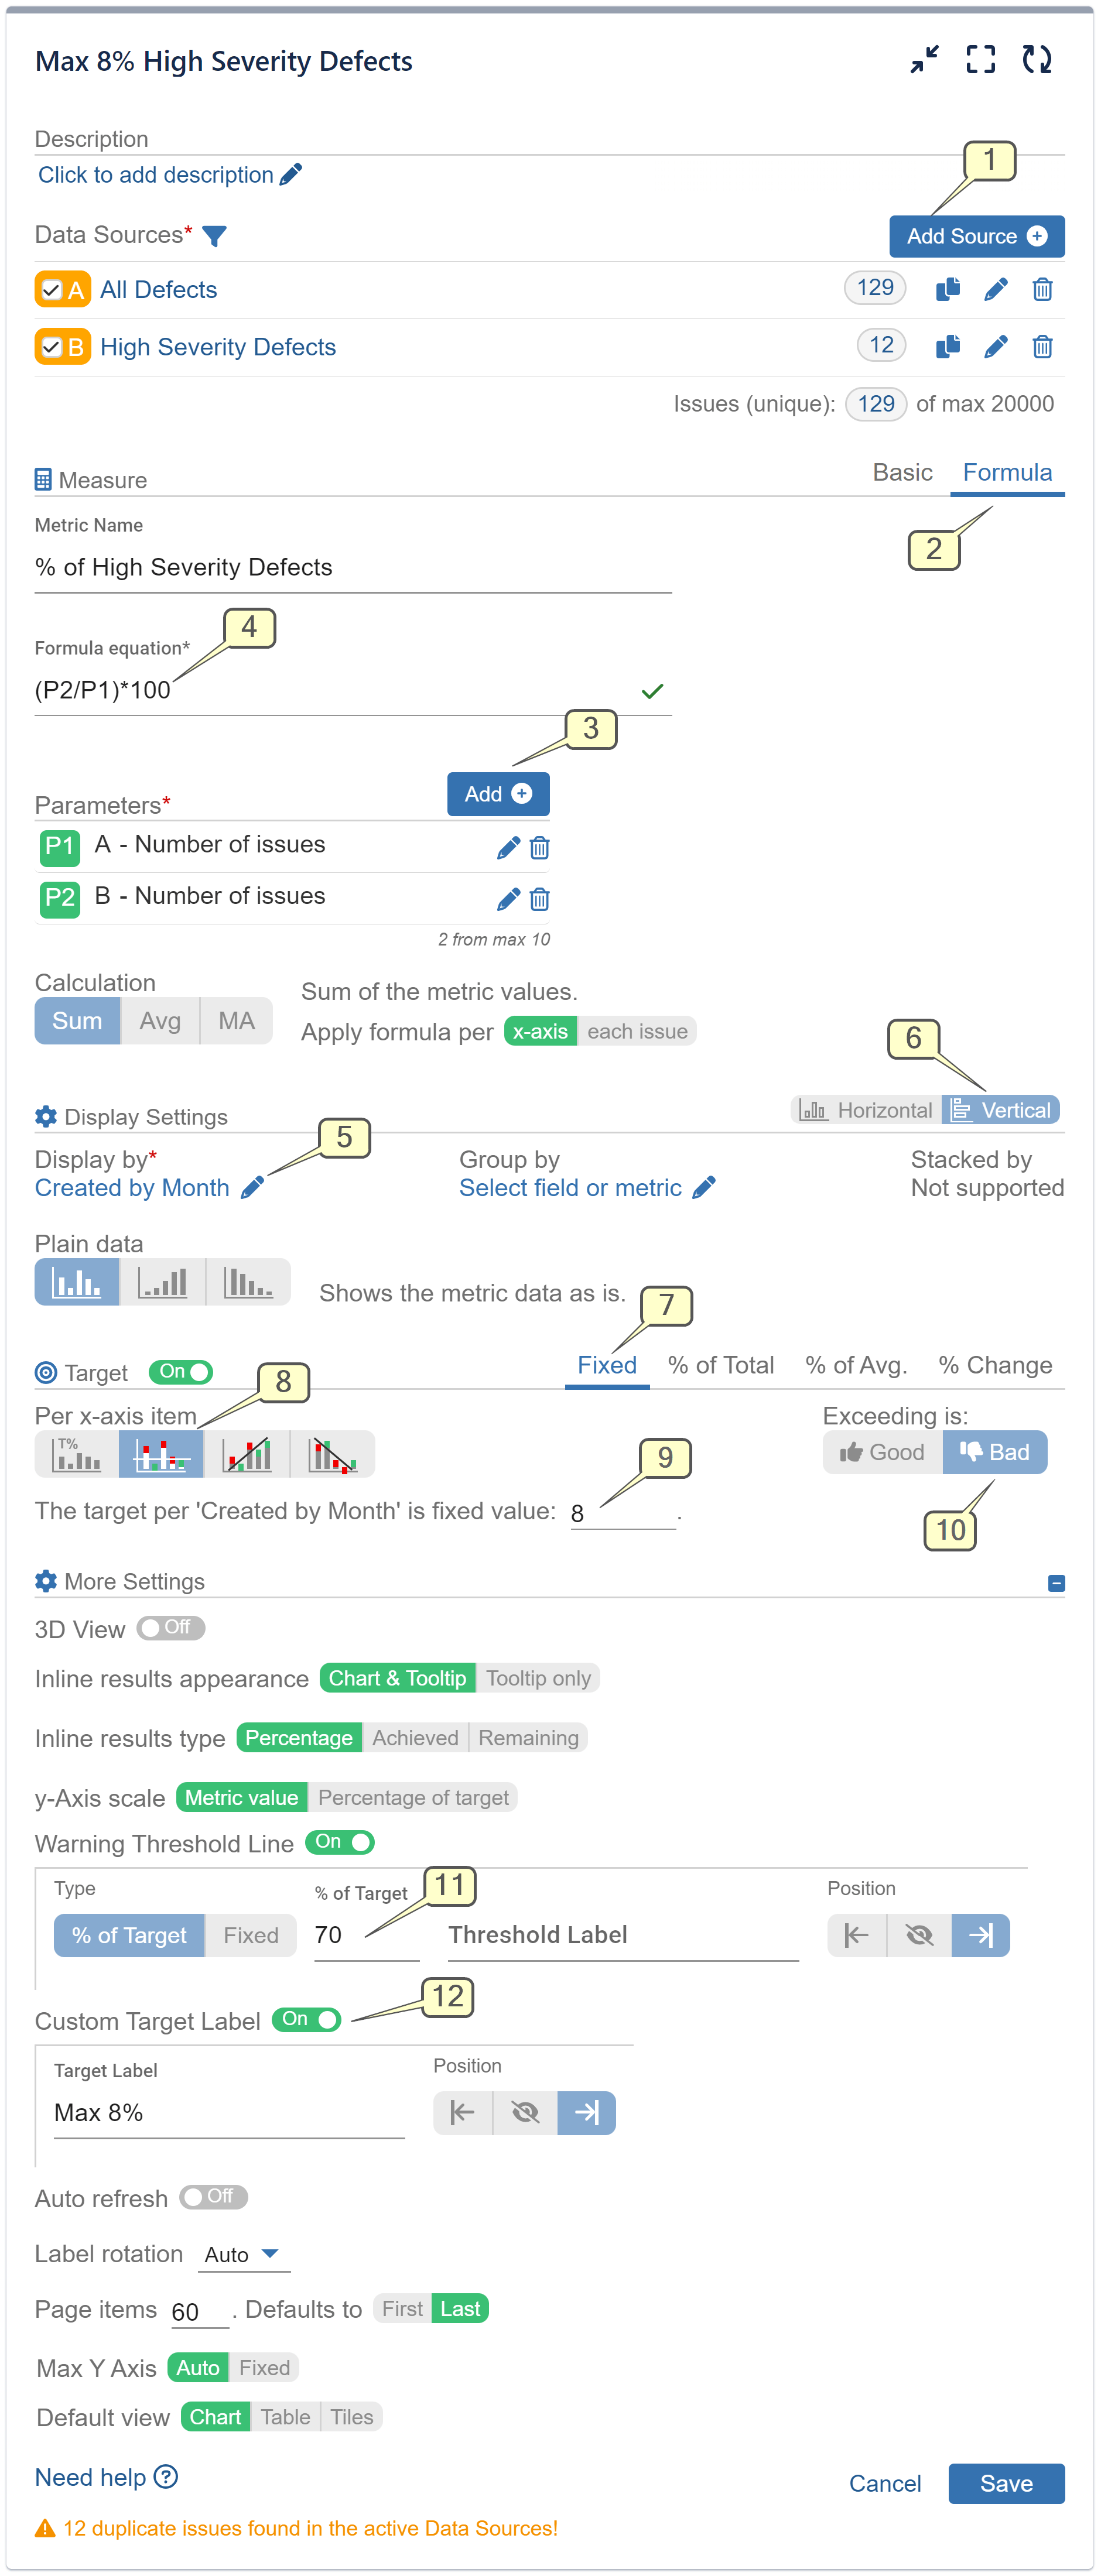
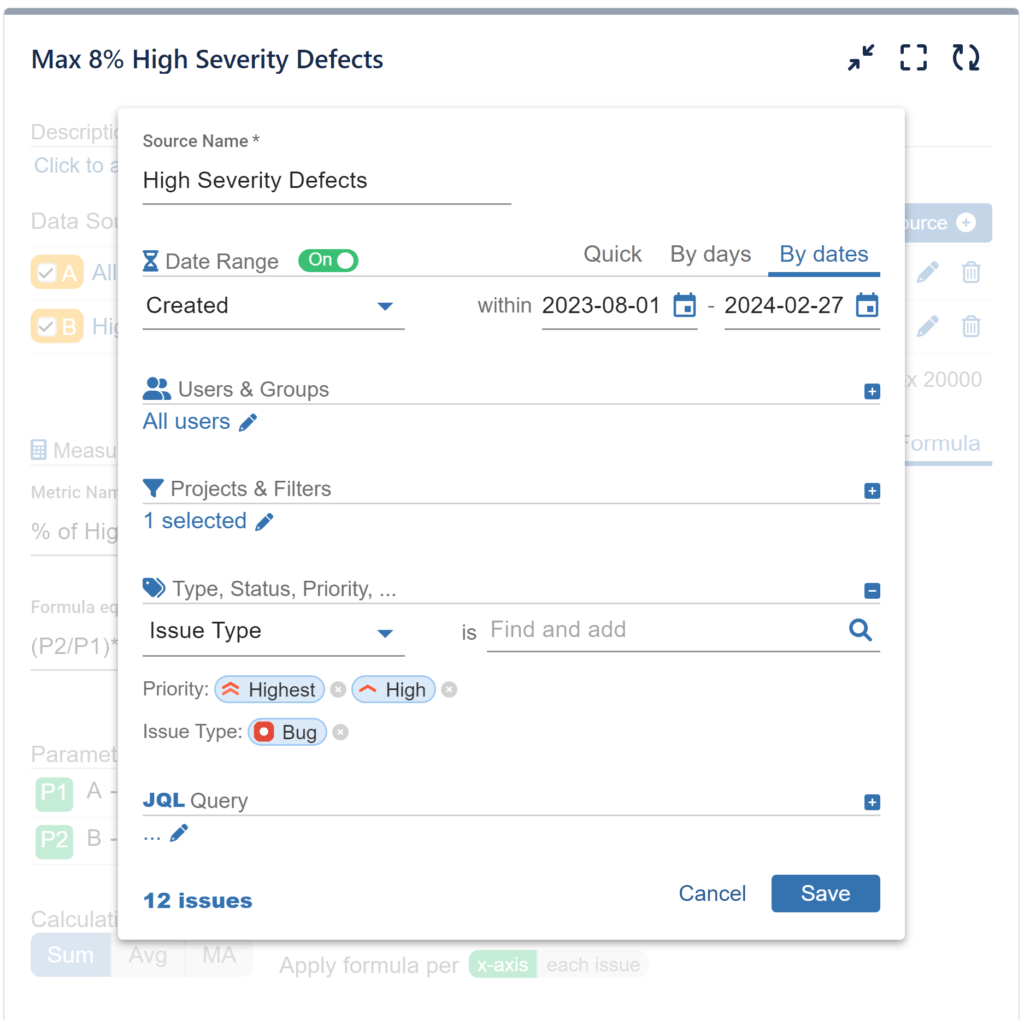
Step 1: Add two data sources. The first, named ‘All defects,’ should cover all bugs. The second, ‘High Severity Defects,’ should exclusively include critical Bugs (in our case high and highest priority).
Step 2: Opt for the ‘Formula’ metric type when configuring the metric.
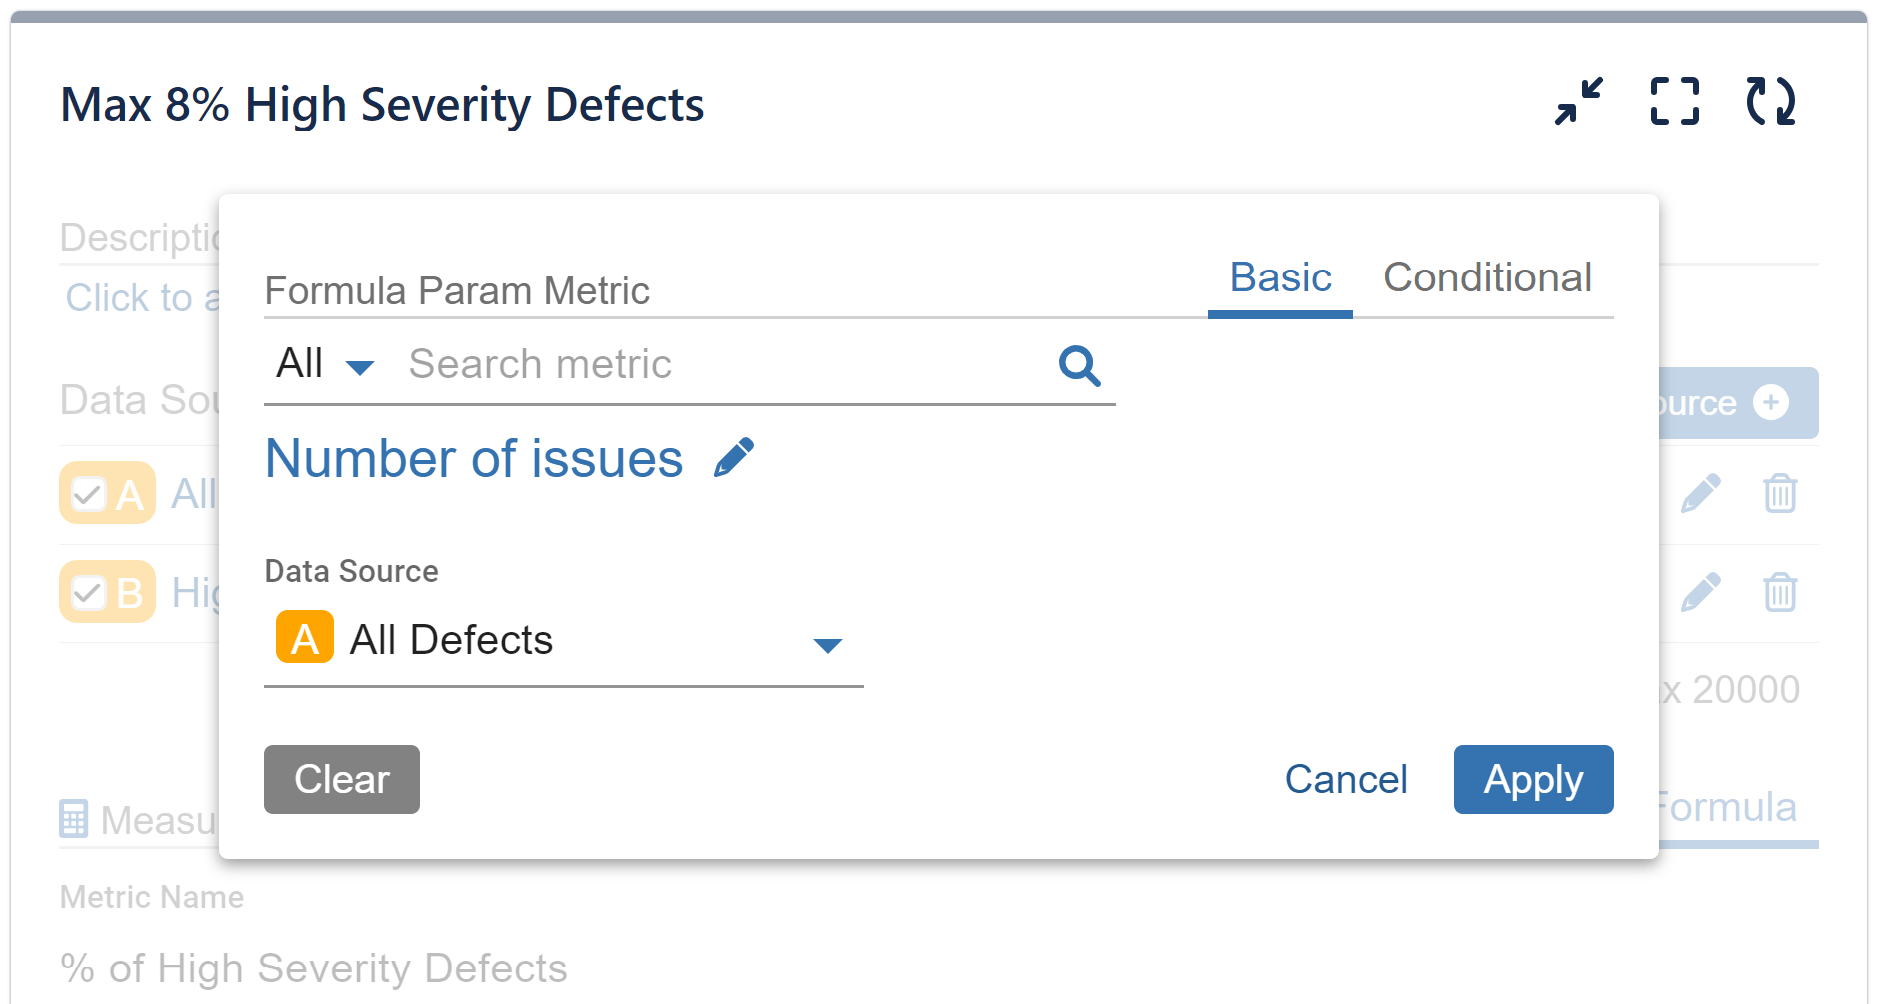
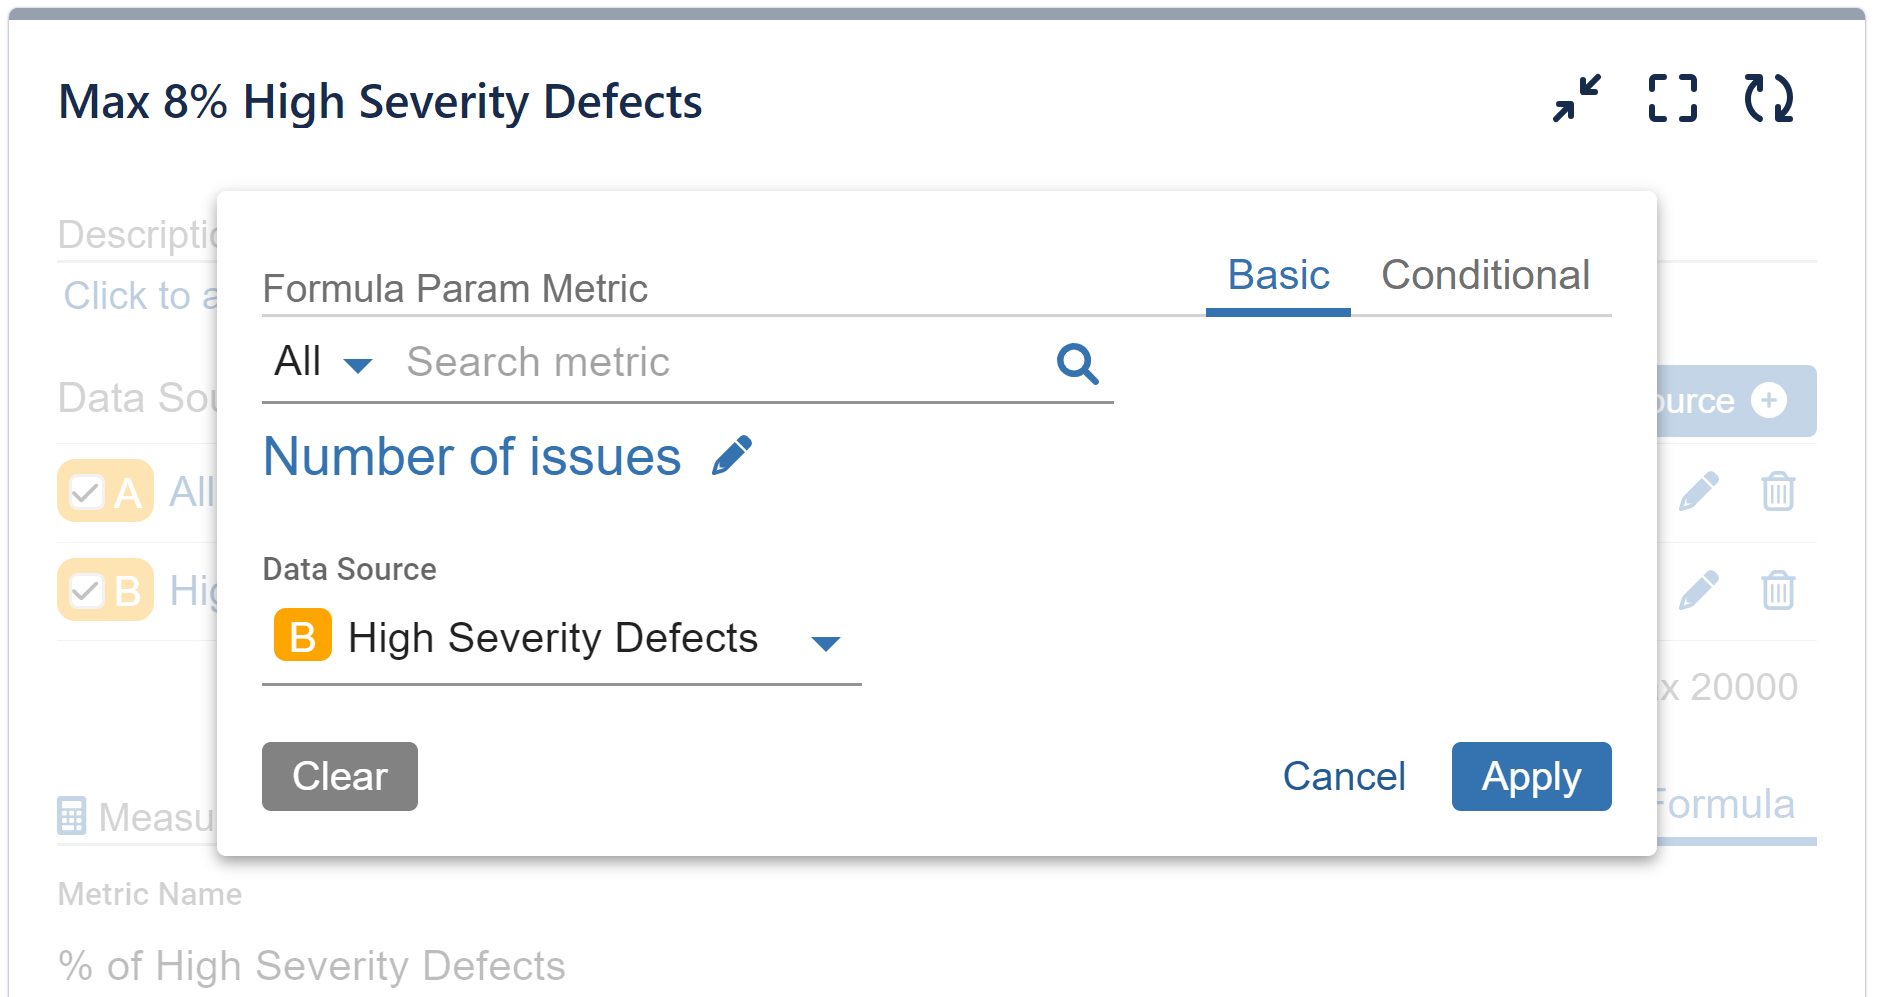
Step 3: Progress to add two parameters essential for the Formula’s computation.
Step 4: Set the formula equation as (P2/P1)*100.
Step 5: To display the data per month on the x-axis, adjust the granularity of the ‘Created’ date field from ‘Week’ to ‘Month’ within the ‘Display by’ option.
Step 6: (Optional) Choose vertical orientation.
Step 7: Activate the Target section and ensure that the ‘Fixed’ tab remains selected.
Step 8: Set results to be evaluated per x-axis item. In the sample case the target will be calculated against each month shown on the x-axis.
Step 9: Set target value.
Step 10: Set the target as negative by choosing ‘Exceeding is: Bad’. This will cause values above the target to be perceived as negative, resulting in them being highlighted in red.
Step 11: (Optional) Within the ‘More Settings’ section, activate and set the ‘Warning threshold’. Consequently, values surpassing the threshold but falling below the target level will be colored in amber.
Step 12: (Optional) In the ‘More Settings’ section, enable the ‘Custom Target Label’ option and define it as text that signifies the negative target, such as “Max 8%”.
Additional instructions for Step 1: Performance Objectives: Charts for Jira supports various data segmentation options. You can conveniently filter specific filters, issue types, priority levels (as in our use case), resolution states, labels, or statuses to tailor your analysis precisely to your requirements.
Additional instruction for Step 3: In our scenario, we’ve selected “Number of Issues” for both Parameter 1 and Parameter 2. What’s crucial to note is that each parameter draws data from distinct sources. P1 utilizes data A (All Defects), whereas P2 utilizes data B (High Severity Defects).
Preview our video guiding you through the step-by-step process of configuring the “% High Severity Defects” report in Jira.
For a deeper comprehension of incident severity levels, you might find this Atlassian article to be informative.
Using the Performance Objectives: Charts for Jira app, you have the ability to create a dedicated “KPI Dashboard” directly on your Jira dashboard. This dashboard can include a set of reports focused on your objectives, all aimed at reinforcing your SMART goals. Our support team is prepared to assist you.
For additional use cases that can enhance your performance management process, take a look at the KPI Examples page.
Start your 30 days free trial of Performance Objectives: Charts for Jira from Atlassian Marketplace.