Table of Contents
Optimizing Sprint Performance with Average ‘Time in Status’ Metric in Jira
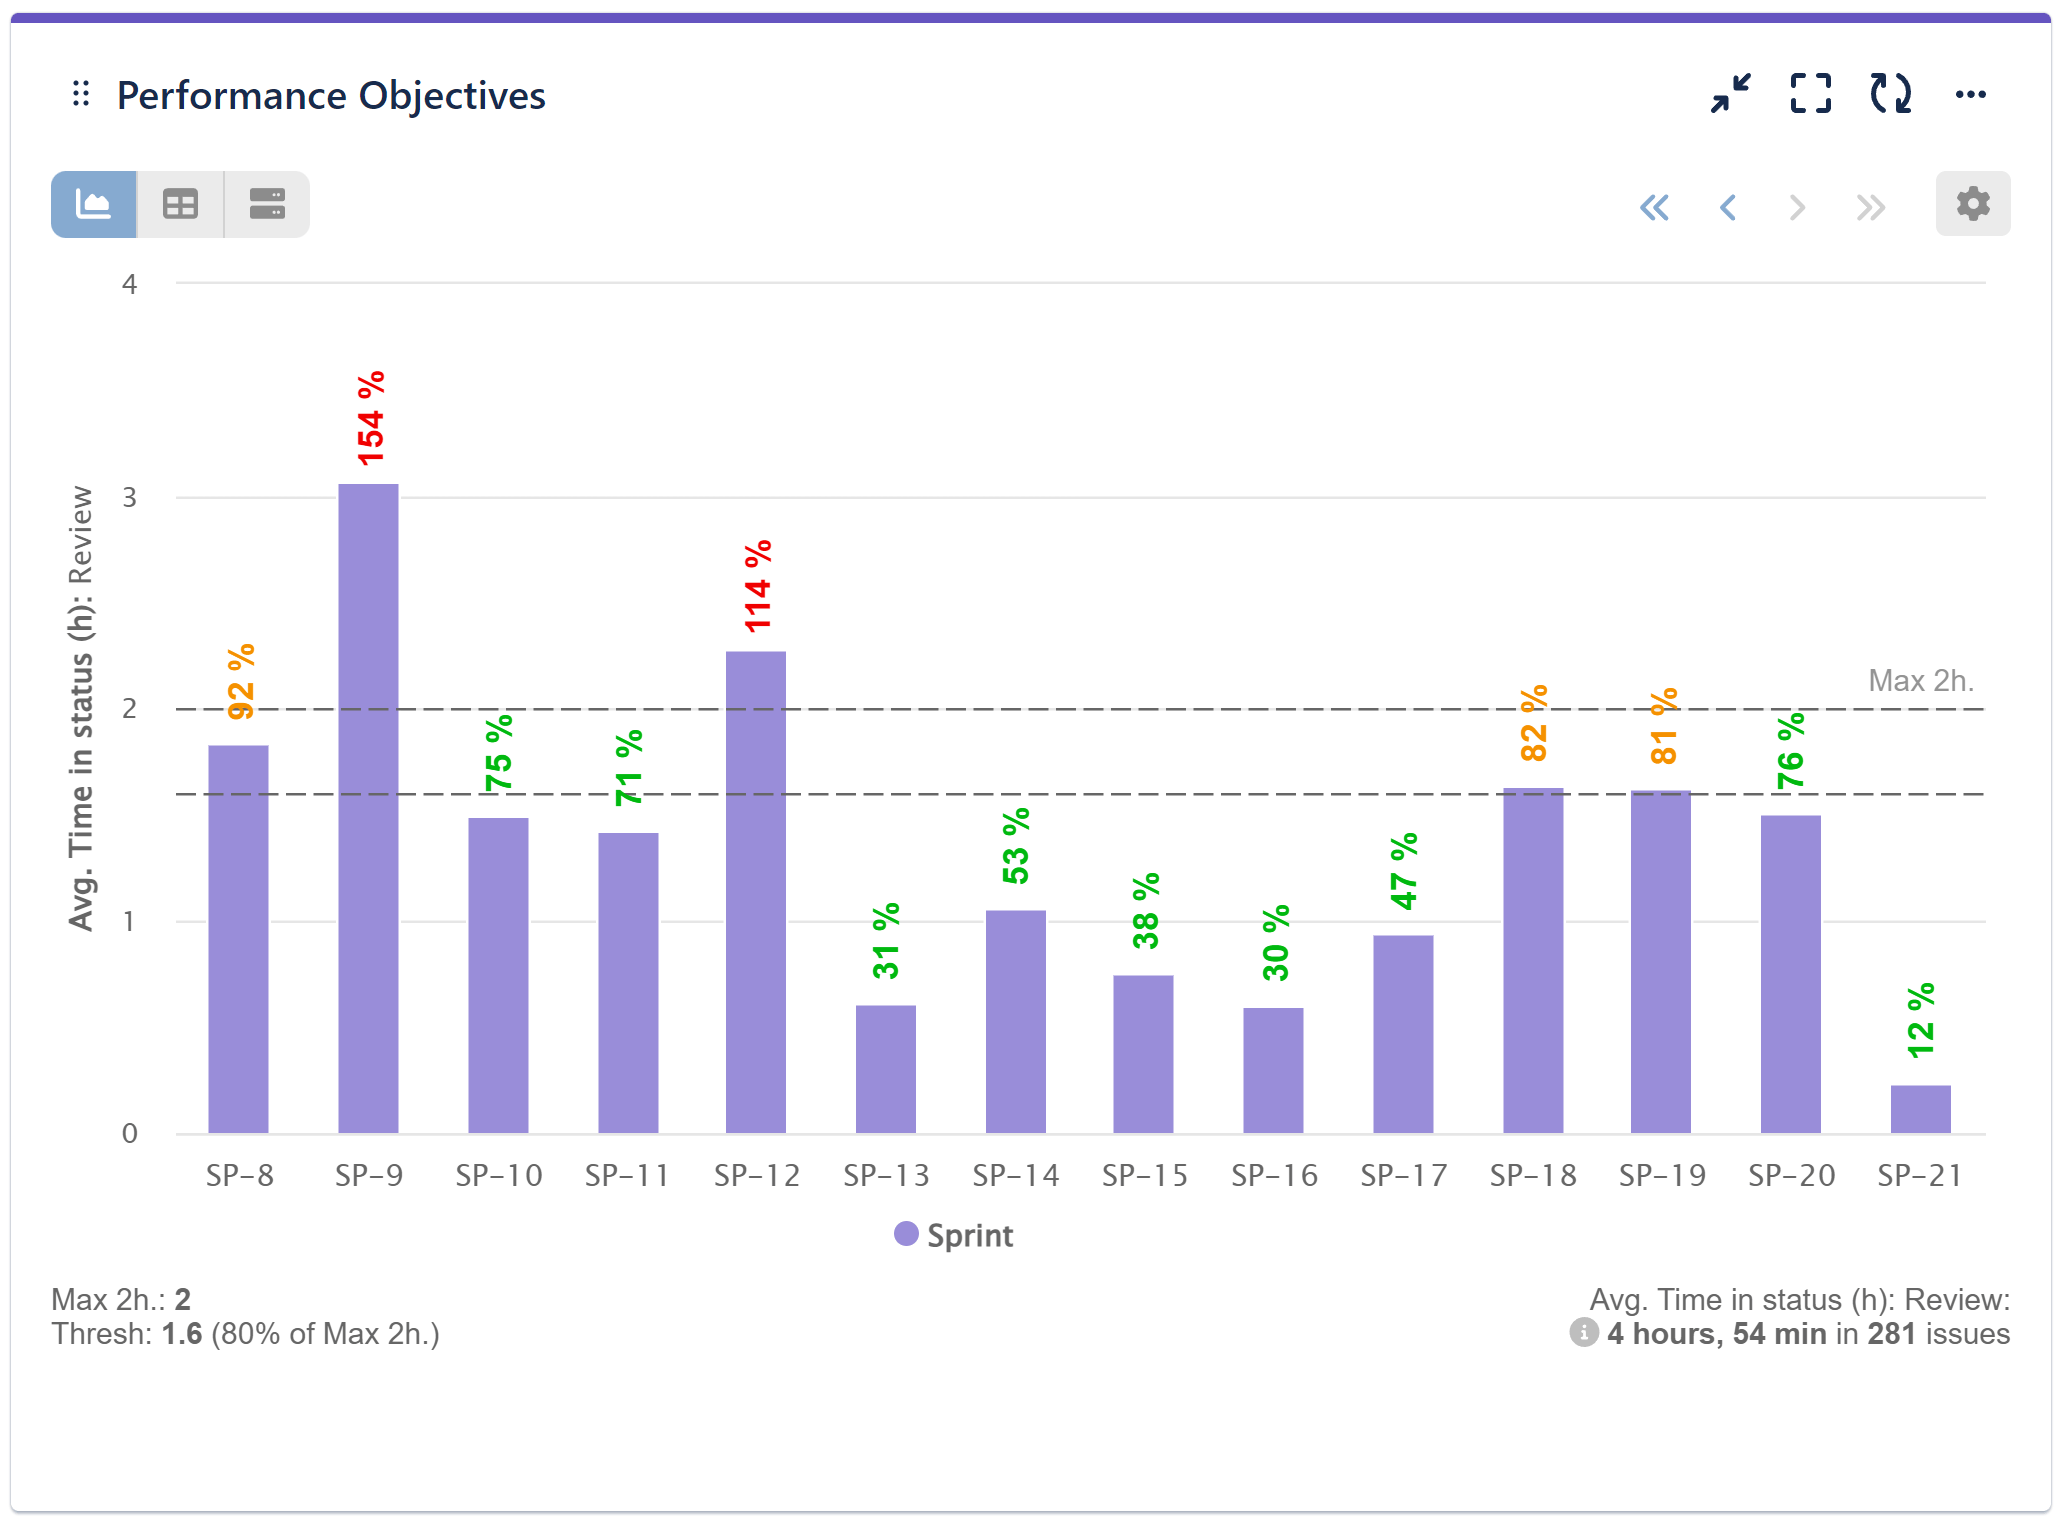
In the dynamic world of Agile project management, tracking and improving team performance is crucial for the success of each sprint. One effective way to achieve this is by generating an Average Time in Status in Sprint report in Jira, utilizing the Performance Objectives app. This report provides valuable insights into how long tasks remain in specific statuses, such as Review, Testing, In Progress, or any other status in your workflow. By displaying this data on a sprint-by-sprint basis along the x-axis and setting targets for maximum time spent in each status, teams can identify and eliminate bottlenecks, enhance sprint velocity, and increase the likelihood of achieving the sprint goal.
Generating Average Time in Status in Sprint KPI Report
The core of this report lies in the ‘Time in Status‘ metric, which is ready to use within our app, the Performance Objectives for Jira. By defining and tracking the time tasks spend in critical statuses like “Review”, teams can set actionable goals to reduce these durations. For instance, setting a target to decrease the average time spent in the Review status can significantly reduce blockers, ensuring a smoother workflow. This aligns with the “fail fast, fail early” principle, encouraging teams to address issues promptly and iteratively. By focusing on this metric, teams not only improve their current sprint performance but also foster a culture of continuous improvement, ultimately driving higher efficiency and productivity in their Agile processes.
Now, let’s configure this report in a few steps.


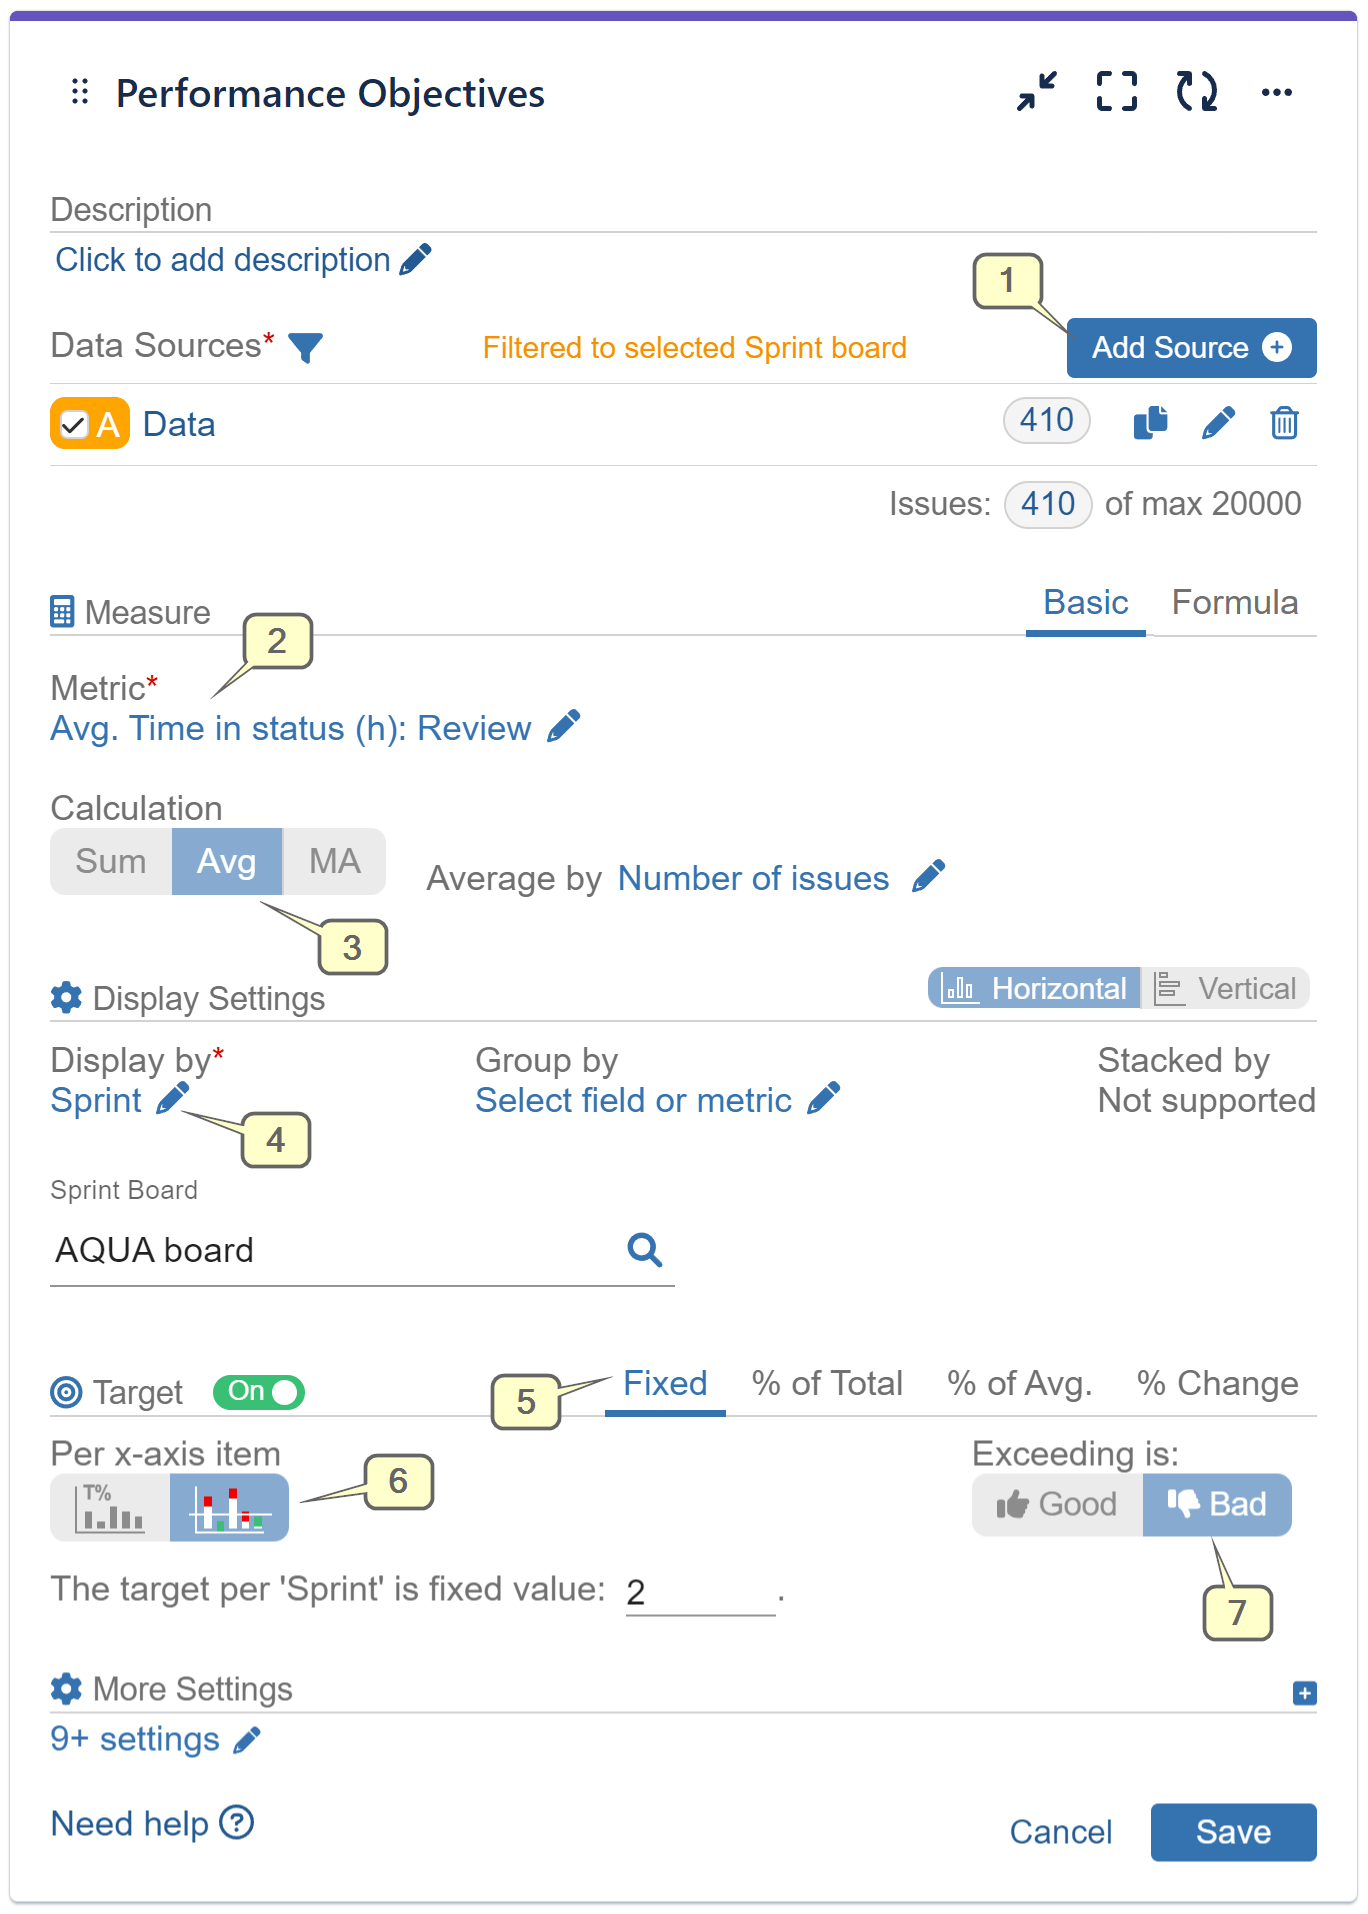
Step 1: Add a Data Source. In our example, we’ve filtered our demo project “AQUA” and disabled the date range to view all previous sprints.
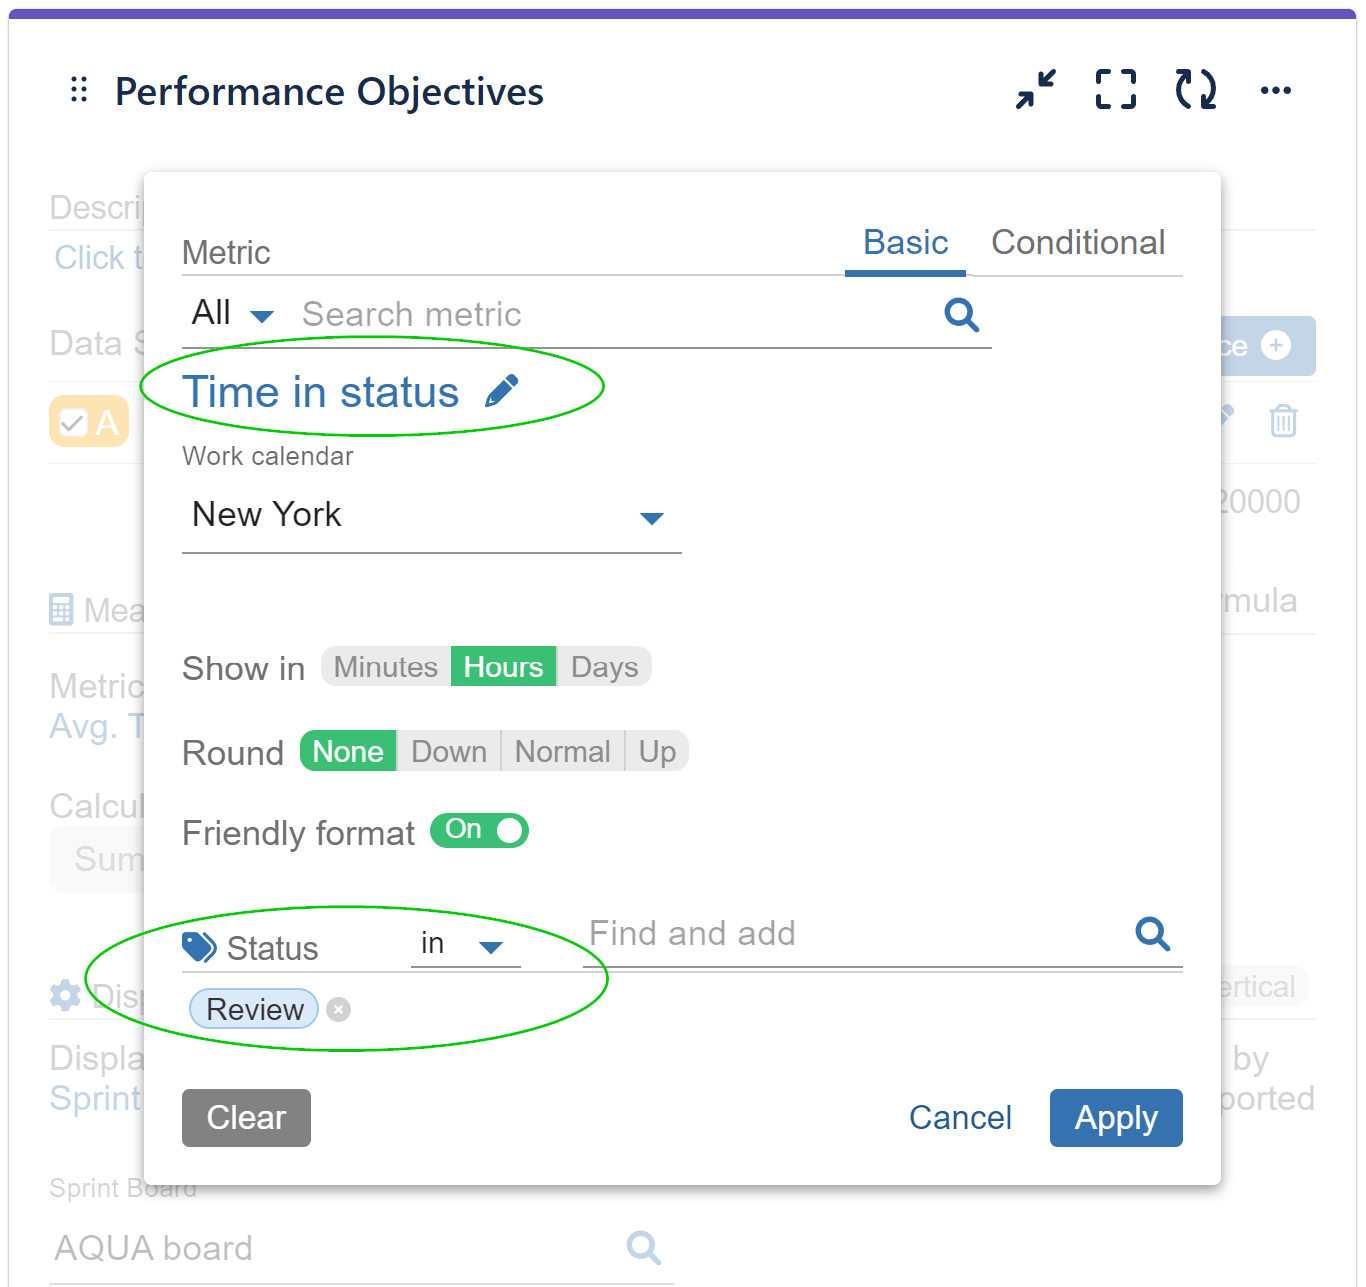
Step 2: Select the ‘Time in Status’ metric and specify the status “Review”.
Step 3: Switch from Sum to Average calculation. Average calculation provides insight into typical durations, mitigating the impact of outliers and offering a clearer understanding of overall task progression.
Step 4: Choose ‘Sprint’ for the ‘Display by’ field and add the Sprint Board you want to analyze.
Step 5: Turn on the Target section and opt for a Fixed target.
Step 6: Select “Per x-axis item” as the target type and set the value of your choice. In our sample report, it is 2 hours.
Step 7: Specify that exceeding 2 hours in the chosen status on average is considered undesirable by choosing “exceeding is Bad”.
Step 8: (Optional) Under More Settings, add a warning threshold of your choice as an early indicator of approaching the target.
Step 9: Optional) Under More Settings, set a custom target label to “Max. 2 h”.
Detailed image for Step 2:
In the sample report we have used status “Review”, but you have the flexibility to select each status of interest, such as “In Progress” or “Testing,” allowing you to easily identify bottlenecks in each step of your workflow.

Here’s a video guide to help you step by step through the process of configuring an Average Time in Status in Sprint KPI report in Jira:
With the powerful features of the Performance Objectives app and the ready-to-use metrics it supports, you can build various insightful KPI reports for your Jira dashboard. To explore more about our app’s features, refer to the User Guide, gain inspiration from our KPI Examples or contact our Support team for demo or assistance!
Start your 30 days free trial of Performance Objectives: Charts for Jira from Atlassian Marketplace.