Table of Contents
Discover the Power of ‘Time in Status’ Metric
Unlock the full potential of your Jira workflow with the ‘Time in Status‘ metric available in Performance Objectives: Charts for Jira app. Unlike the limited scope of the built-in Jira gadget, Average Time in Status, which only focuses on resolved issues, this dynamic metric provides a comprehensive view of the elapsed time in one or multiple statuses of your Jira issues. Leveraging the history of your Jira issues, the ‘Time in Status’ metric is compatible with Jira Software, Jira Service Management, and Jira Work Management, offering valuable insights across your entire project portfolio.
By diving into the ‘Time in Status’ metric and analyzing it based on ‘status history’ or ‘assignee history’, you gain the ability to identify bottlenecks and pinpoint areas for improvement. Whether your objective is to decrease the time spent in the ‘Waiting for Support’ status or to track Key Performance Indicators (KPIs) like a “Maximum of 2 days in the ‘Review’ status”, this metric empowers you to set actionable goals and drive efficiency within your team.
In this article, we will explore a sample configuration showcasing the utilization of the ‘Time in Status’ metric in the Performance Trend gadget. However, it’s important to note that this powerful metric is also available in other essential gadgets of the app, including “Performance Objectives”, “Multi Metric Combined”, “Multi Metric Trend”, and “Circular Chart”. Join us as we delve into the world of ‘Time in Status’ metric and discover how it can revolutionize your performance analysis and workflow optimization.
Configuring Accumulated Time in Status Report in Jira Using the ‘Performance Trend’ Gadget
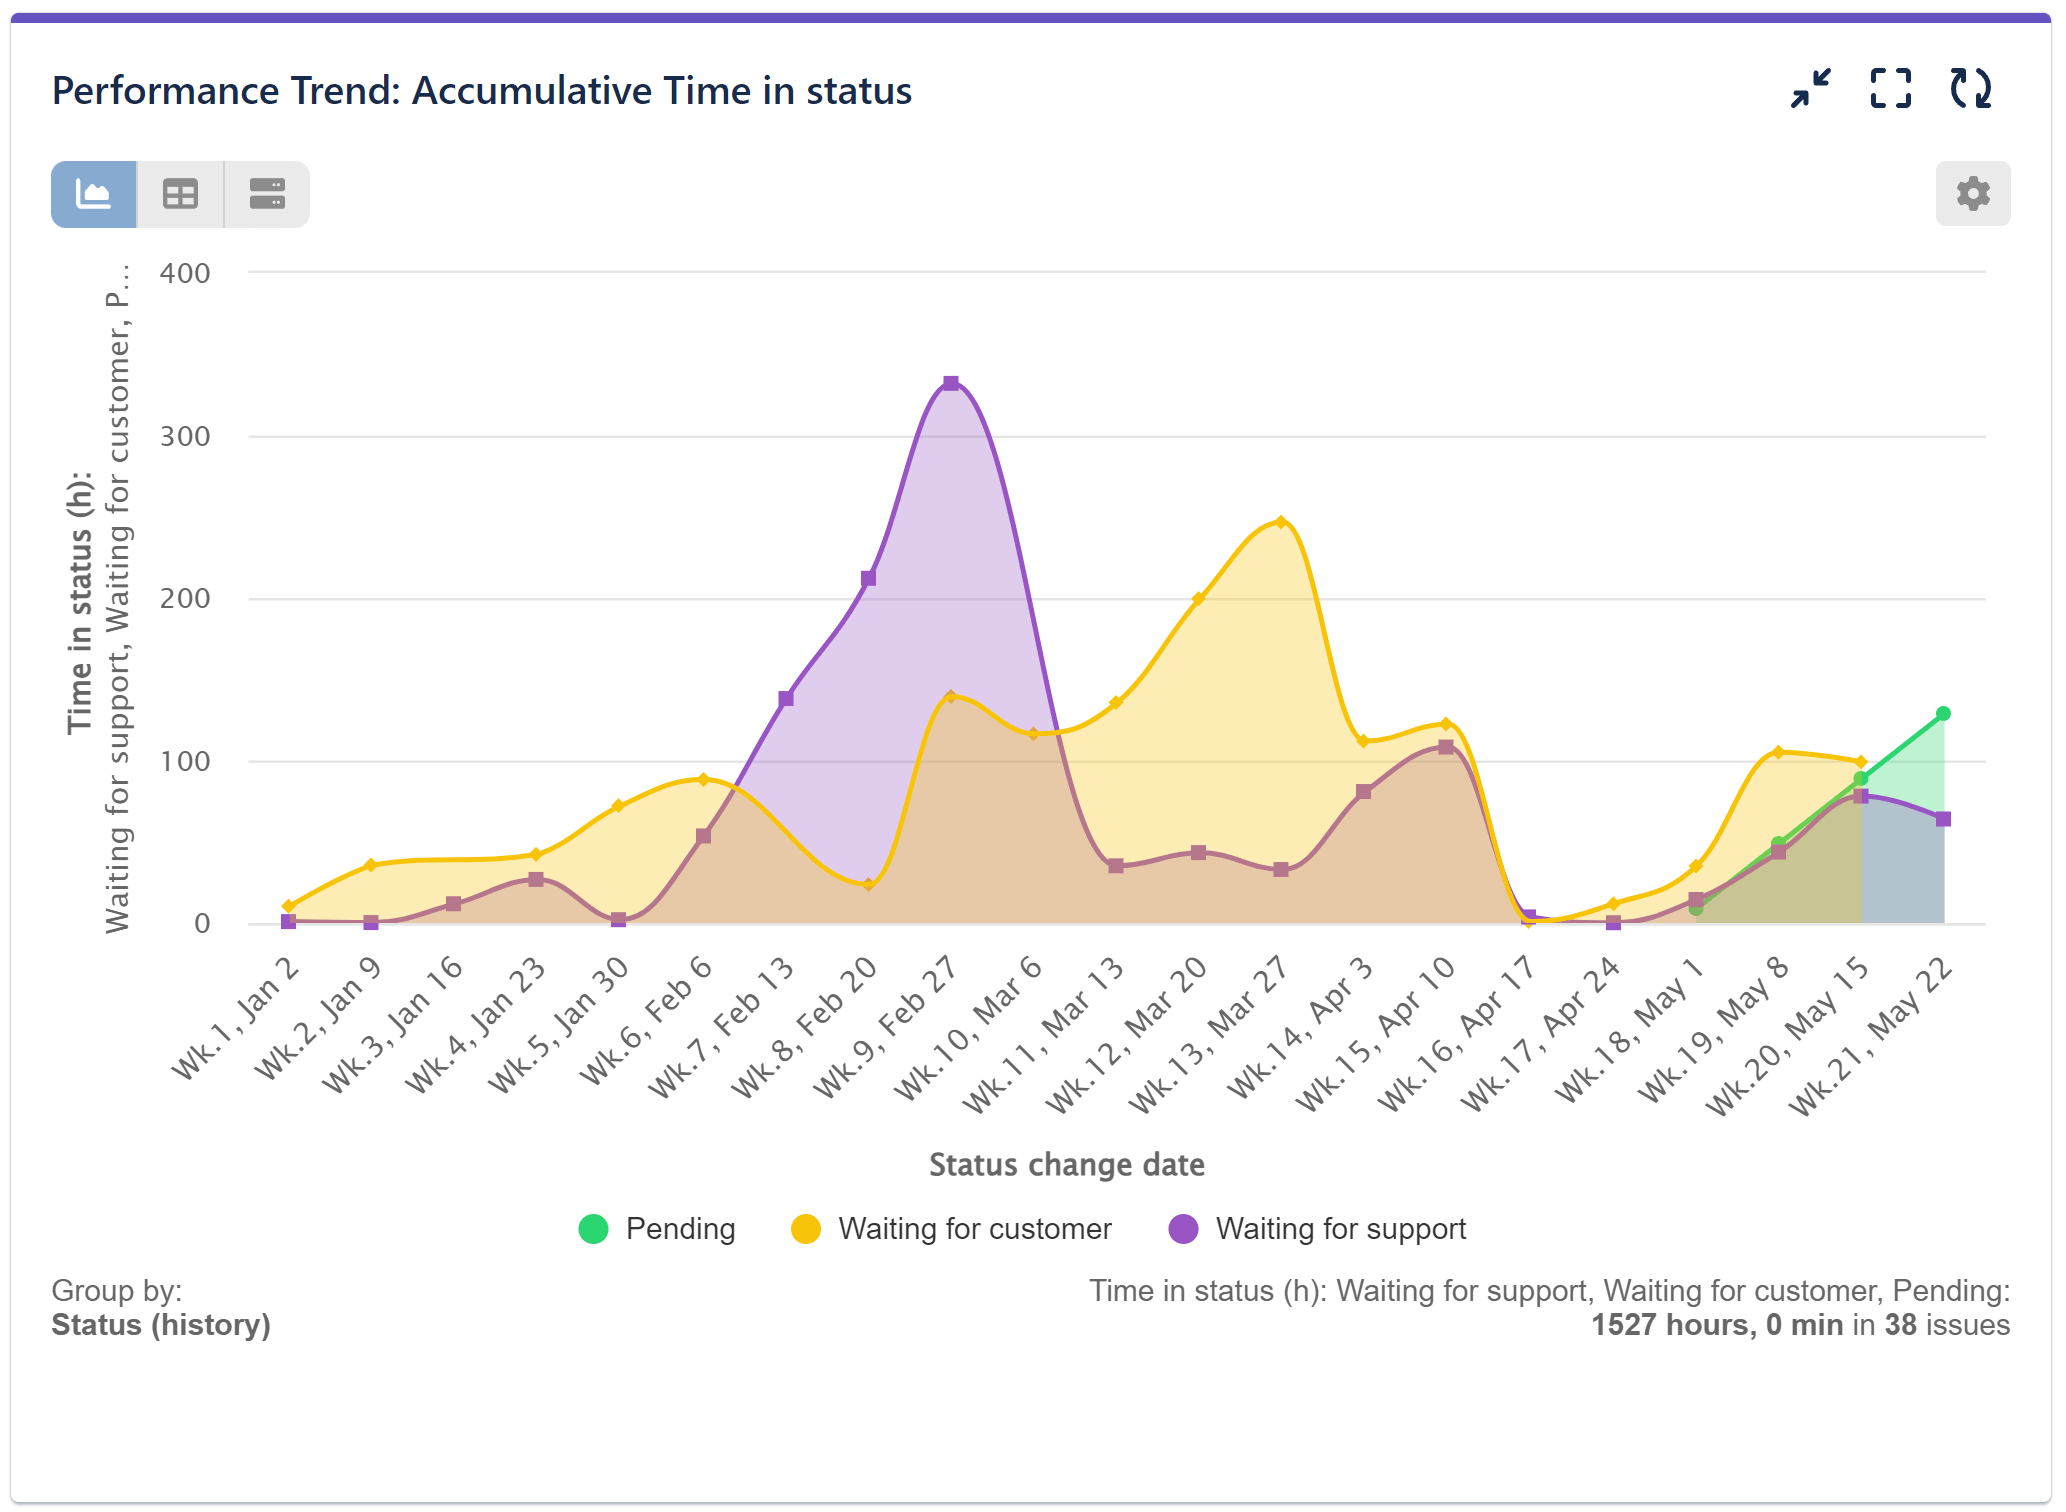
The purpose of this step-by-step configuration is to create a report that displays the accumulated ‘Time in status’ for each period of the selected granularity, such as weekly, since the first status change occurred. By following these steps using the ‘Performance Trend’ dashboard gadget, you can gain insights into the historical progression of the metric and visualize how issues transitioned through different statuses over time.
Step 1: Add a data source to filter the issues you want to analyze. In this example, we’ll use all the issues created this year in the ‘Galaxy’ project.
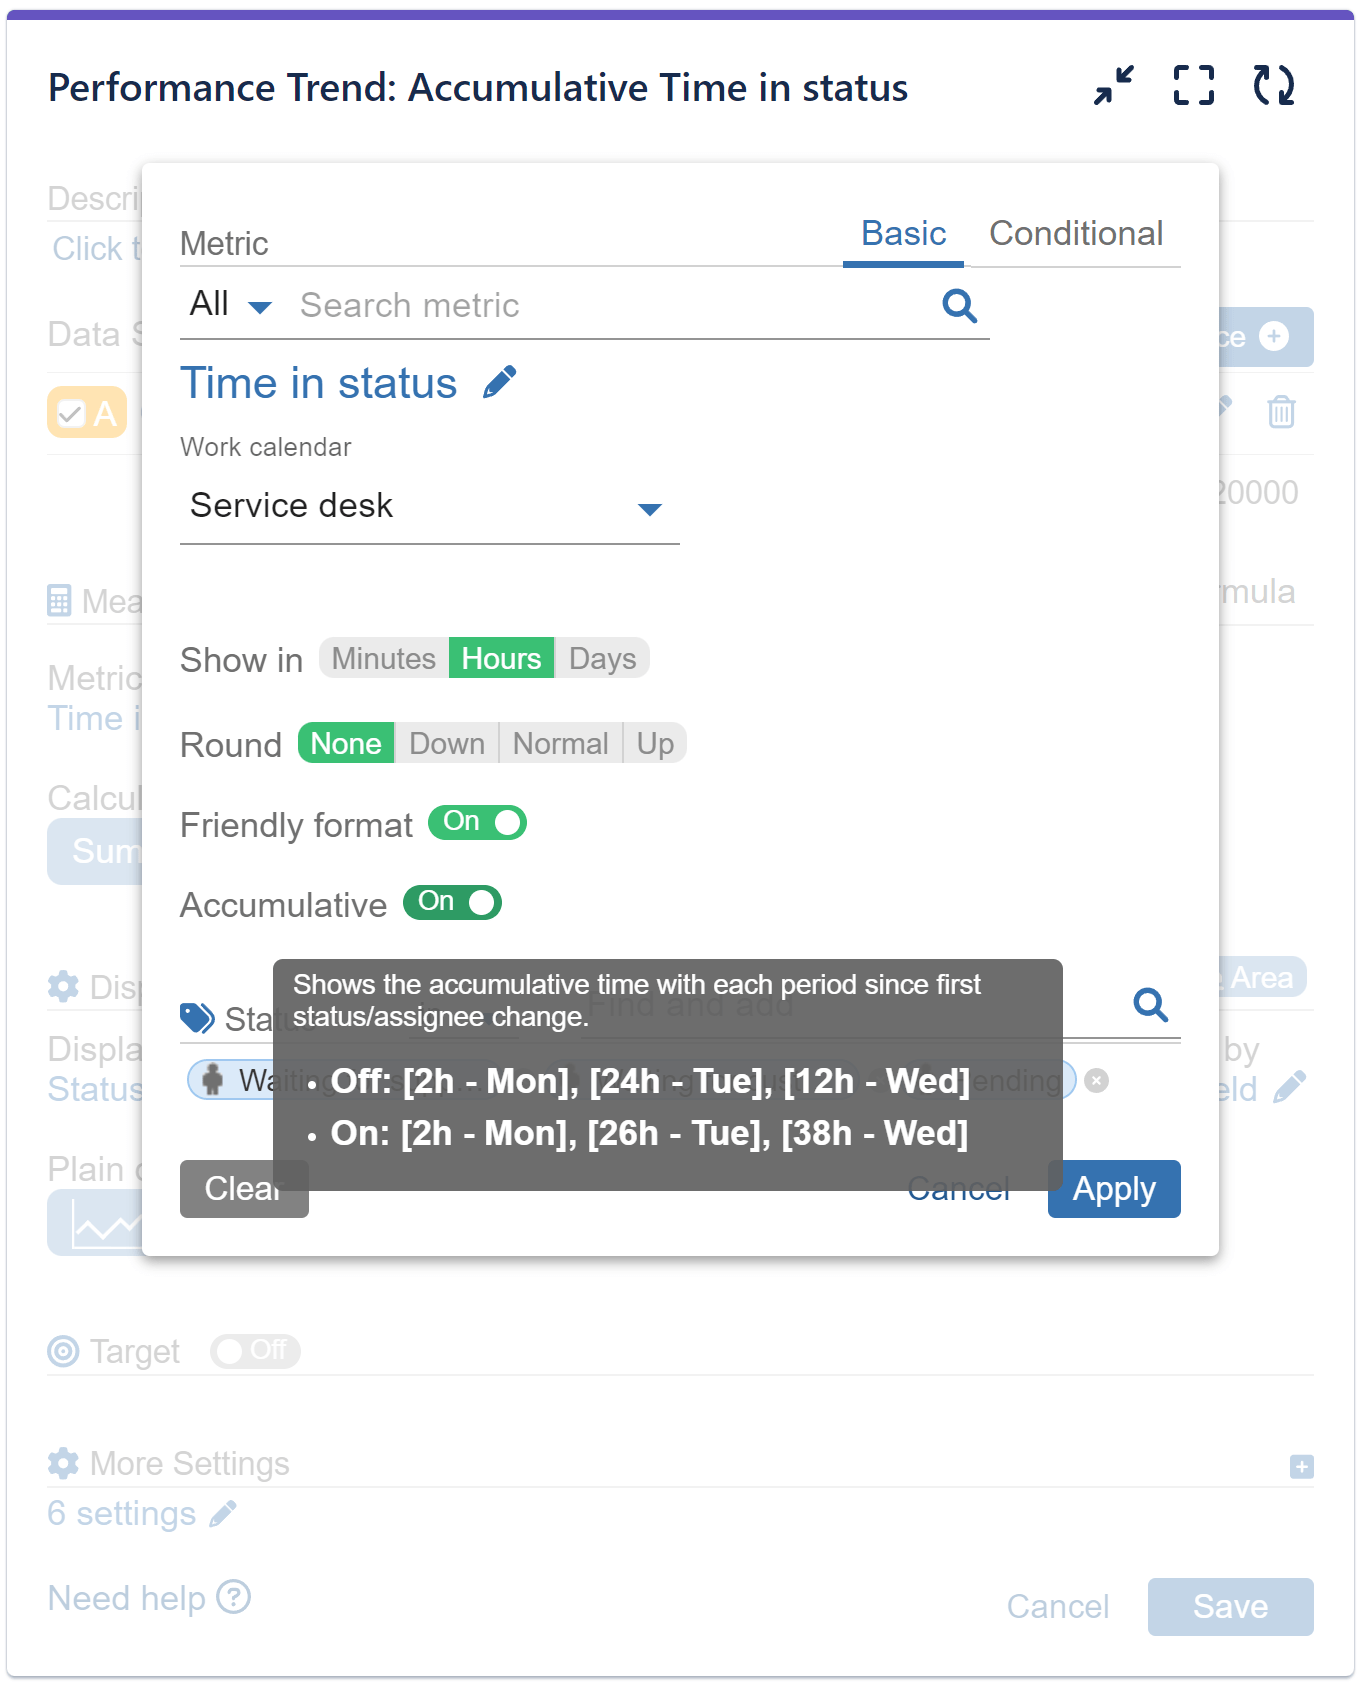
Step 2: Select the metric ‘Time in status’ and choose one or multiple statuses to include or exclude. Customize the other options based on your specific requirements and preferences.
Step 3: Set the ‘Display by’ option to ‘Status change date’, which becomes available after selecting the ‘Time in Status’ metric. This configuration allows you to break down the metric by the historical moments when status changes occurred.
Step 4: Return to the metric selector and enable the ‘Accumulative’ toggle, which becomes available after selecting ‘Status change date’ for the ‘Display by’ field. This setting provides accumulative view of the data.
Step 5: Choose the ‘Status (History)’ field for the ‘Group by’ option. This selection will display the metric based on the statuses to which issues were transitioned over the defined period. Note that selecting the ‘Status’ field may not be as informative in this specific use case, as it represents the current (last) status of the filtered issues.
Step 6: Switch to the area mode, as it is better suited for presenting accumulative data. Once you’ve made all the necessary configurations, save the configuration to generate the report.
View the recorded video encompassing the provided configuration steps:
Expanded Field Options: Unlock New Insights with ‘Time in Status’ Metric
After selecting the ‘Time in status’ metric, several new field options become available, enhancing your analysis capabilities. These fields include:
- Assignee (history): This field displays the metric based on the user to whom issues were assigned over time. It allows you to track and analyze the ‘Time in status’ metric in relation to assignee changes, providing insights into individual performance and workload distribution.
- Assignee change date: By selecting this field, you can break down the ‘Time in status’ metric based on the historical moments of assignee changes. This breakdown enables you to identify bottlenecks or top contributors in terms of the time spent in different statuses, allowing for targeted improvements and resource allocation.
Did you know that ‘Time in status’ metric can also be used as a target or parameter in the Formula metrics feature available in Performance Objectives gadget? This feature allows you to create custom KPIs by combining multiple metrics from different data segments in user defined math equations.
To further explore related topics and metrics, you may find the following articles helpful: Cycles in status, Time in assignee, Cycles in assignee, Time between, Time since, Work calendars. These resources provide additional insights and guidance on utilizing various metrics to analyze and optimize your workflow.
Start your 30 days free trial of Performance Objectives: Charts for Jira from Atlassian Marketplace.