JQL Data segmentation option in Performance Objectives for Jira app provides you the ability to segment relevant data and customize your reports to a wide degree to suit your needs.
JQL Data segmentation is available in all Performance Objectives gadgets and is present in the Data Source configuration window as shown on the right image.
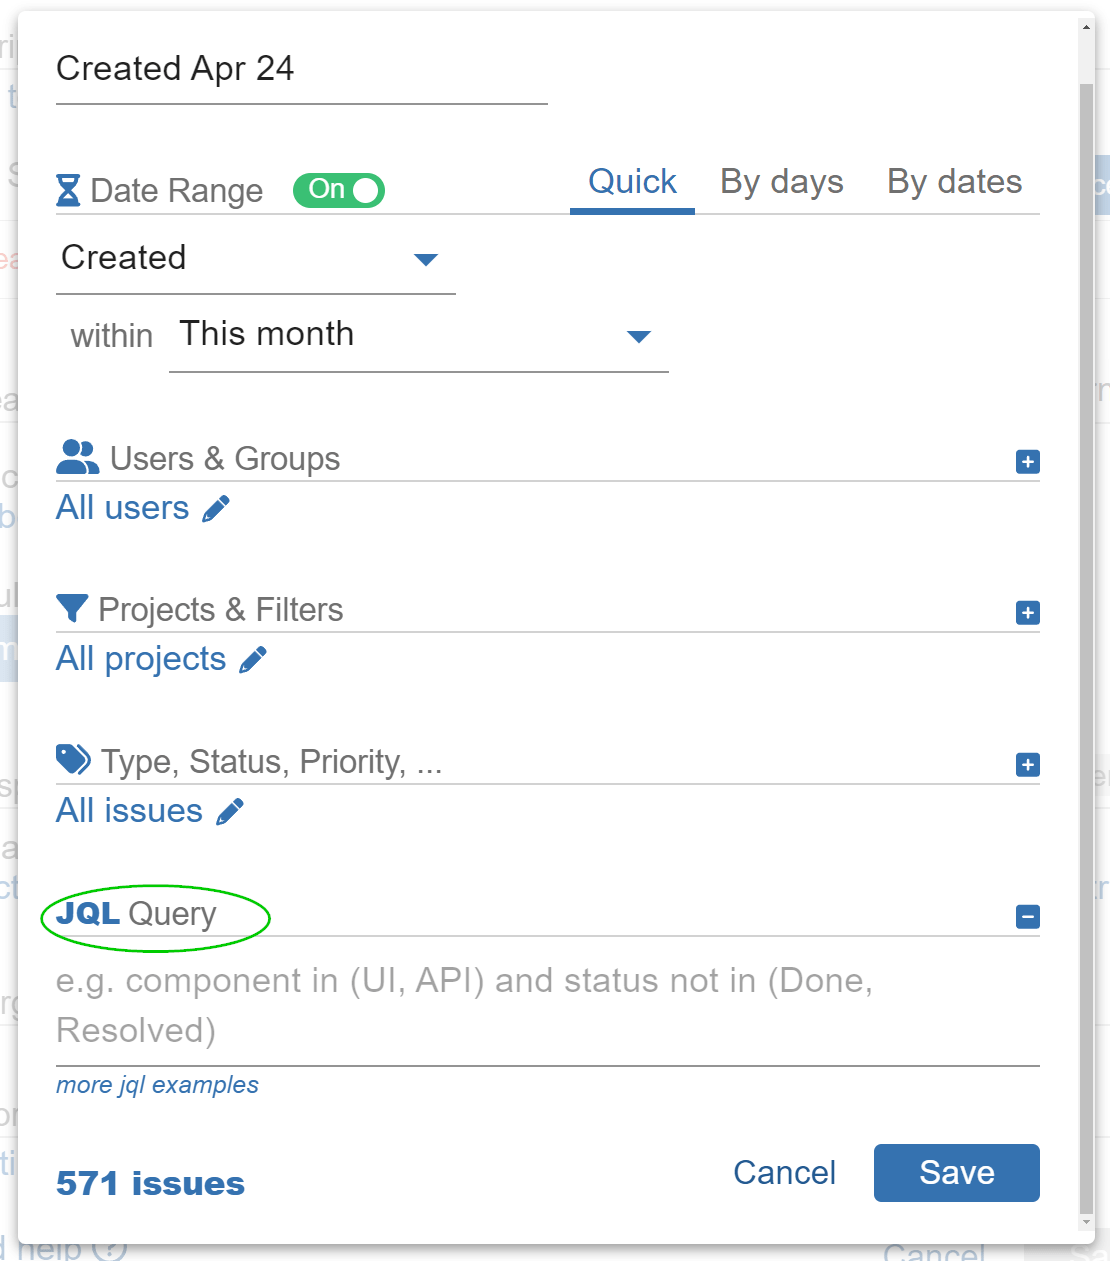
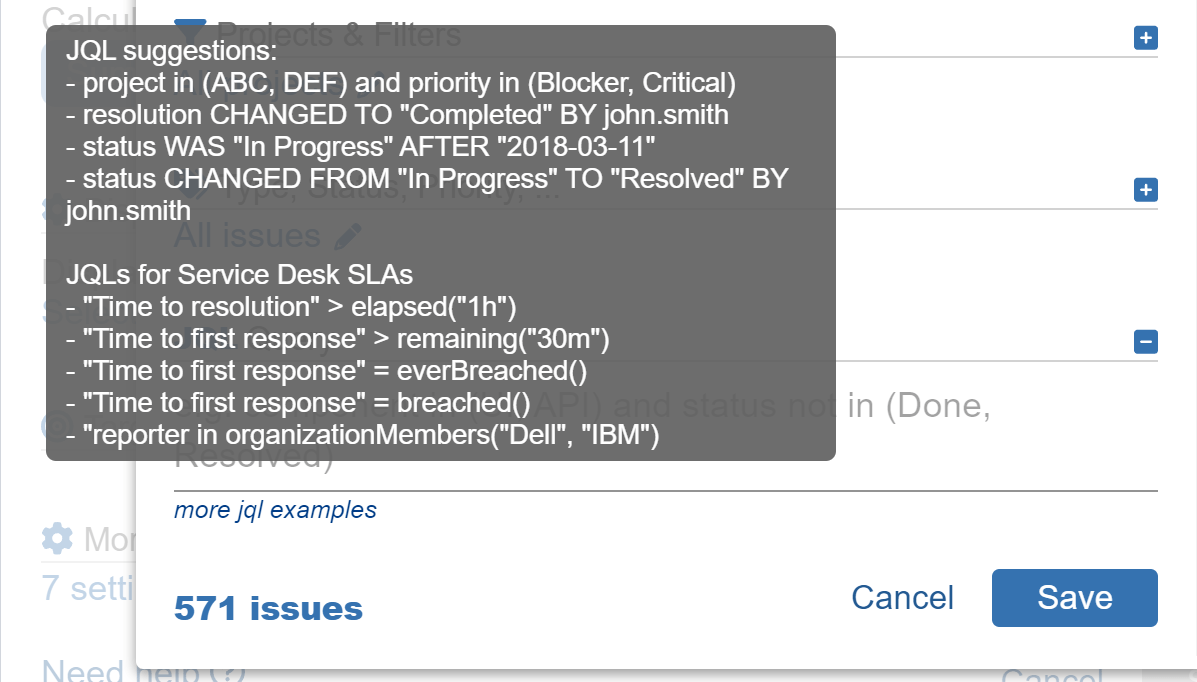
You will find some JQL examples in the tooltip under the query:
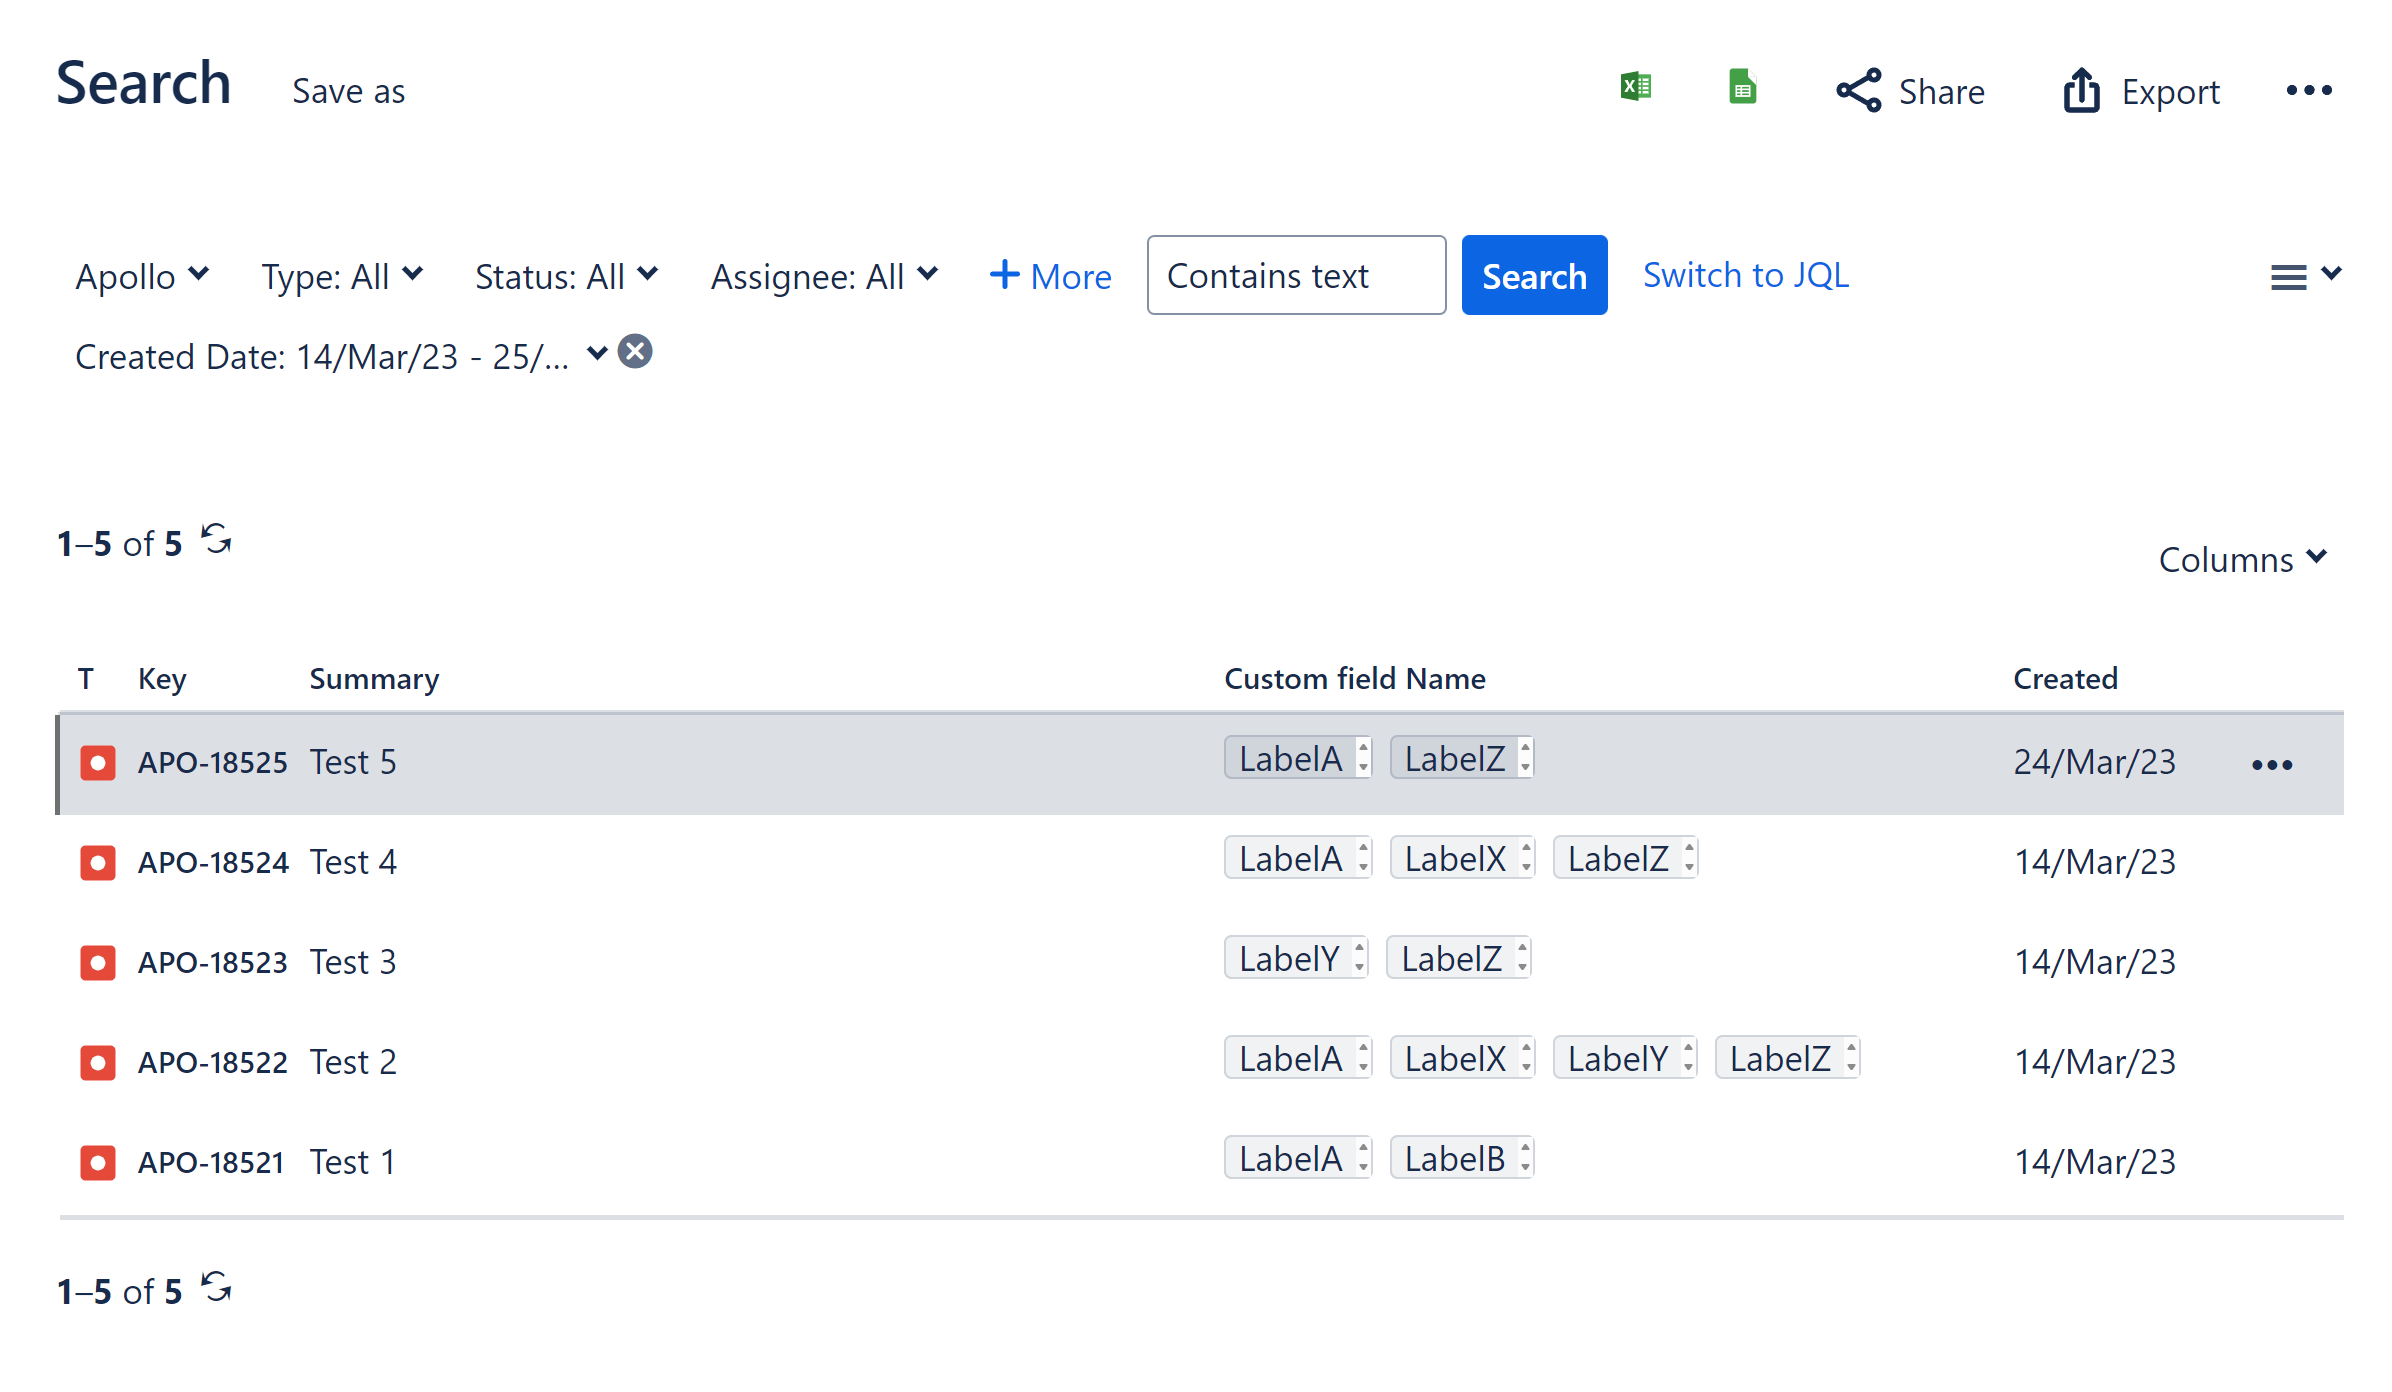
One option to easily get the JQL query you need is to use the advanced issue search under ‘Filters’ in your Jira instance. Go to Navigation bar > Choose Filters > Advanced issue search. Switch to basic search and filter issues you want to view, then click ‘Switch to JQL’, copy the query for the selected field and use it in your data source segmentation in the Performance Objectives app. You can also save it as filter and use this filter in the Performance Objectives data source configuration.
You can also try another way – switch to JQL in Advance issue search, start typing your JQL query and Jira will offer you autocomplete suggestions based on context.
Comprehensive information on how to use JQL for your advanced search is available in Atlassian support documentation. You may find this article helpful: Advanced search reference – JQL fields | Jira Software Cloud | Atlassian Support.
Use case: Report on issues segmented by particular values of a Jira custom field.
A common request among users is to report on custom labels created as Jira custom fields and extract only certain field values of these labels.
Let’s say that you have custom label field and you want to create two types of reports on that custom field:
Type 1: Show all issues than contain you custom label, no matter of the label value.
Type 2: Show only issues that contain certain values of your custom label field.
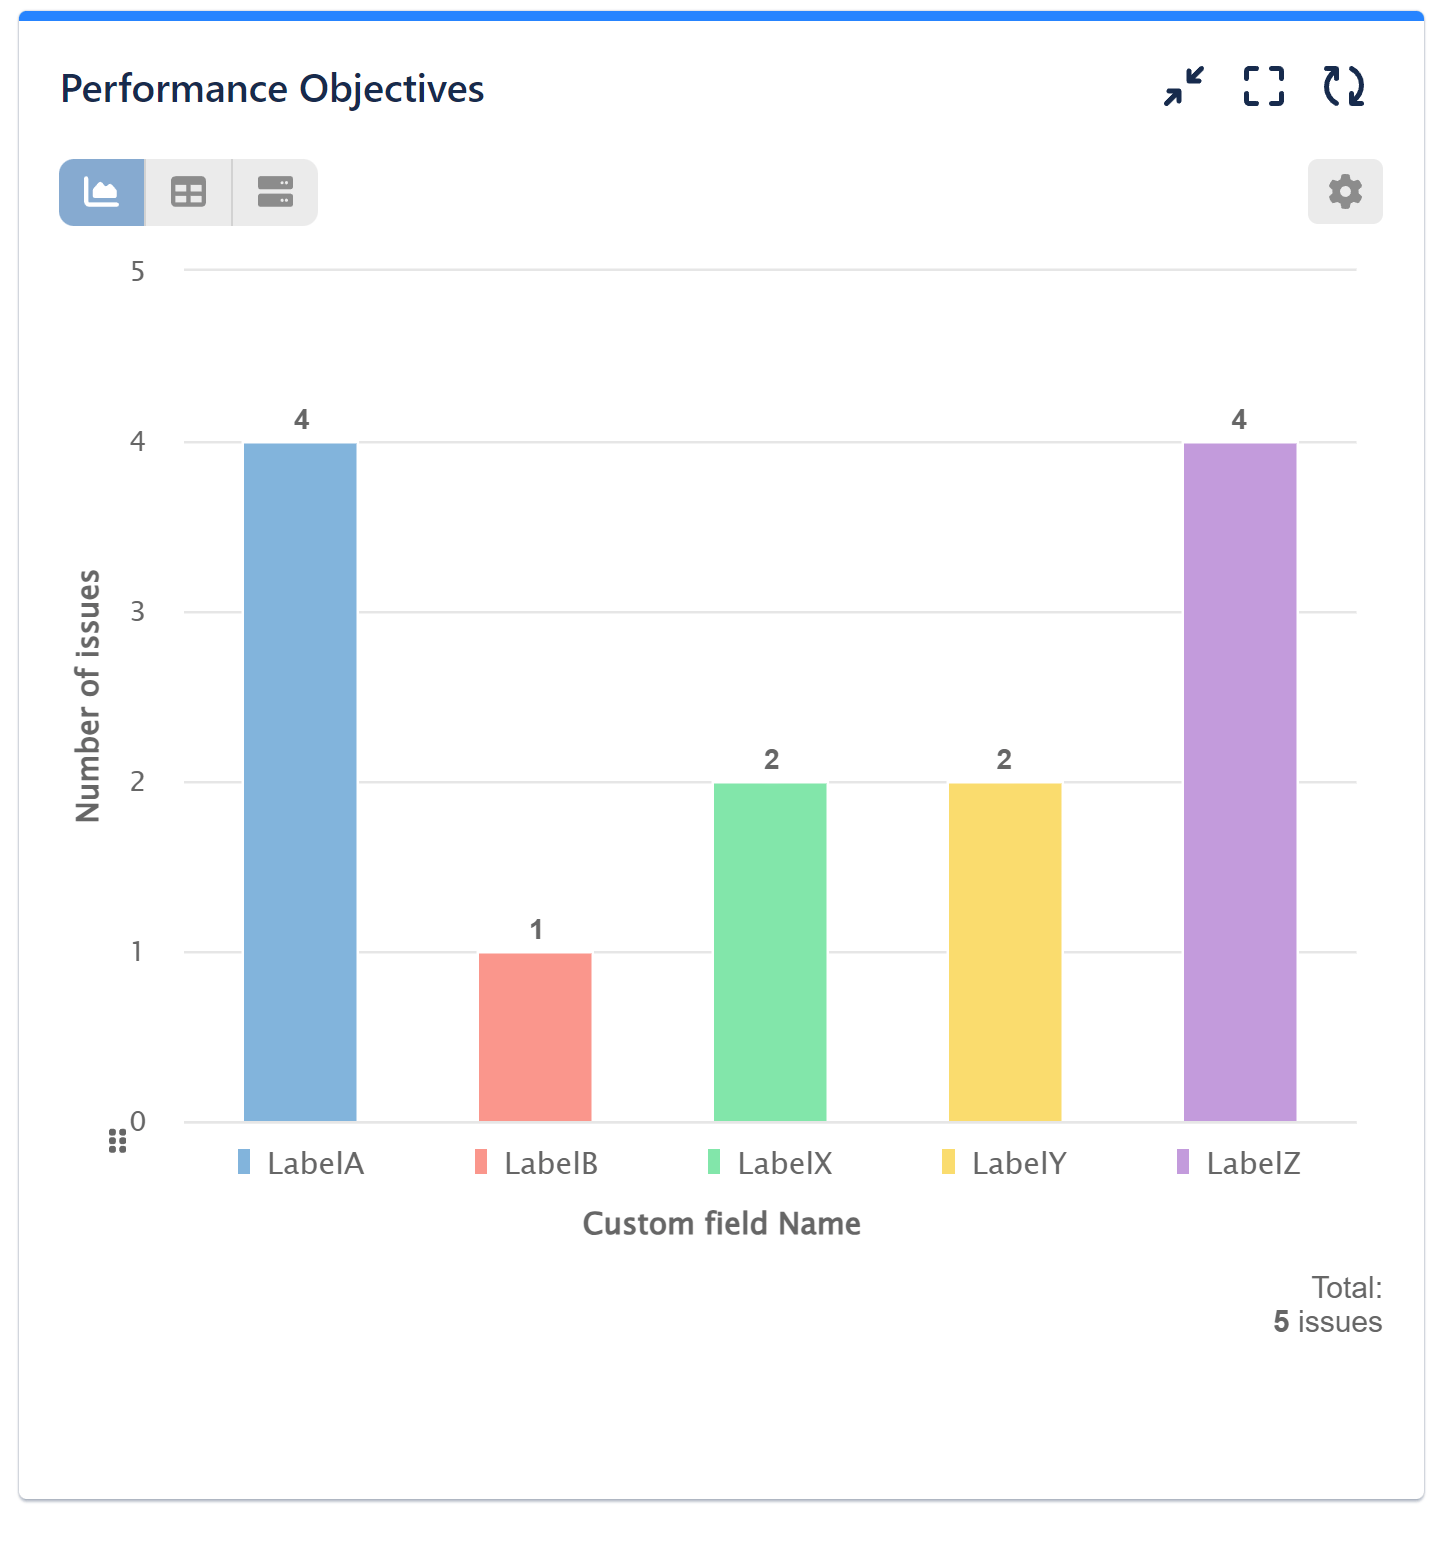
Here are 5 test issues created to describe the case – custom field is “Custom field Name” and field values are LabelA, LabelB, LabelX, LabelY, LabelZ:
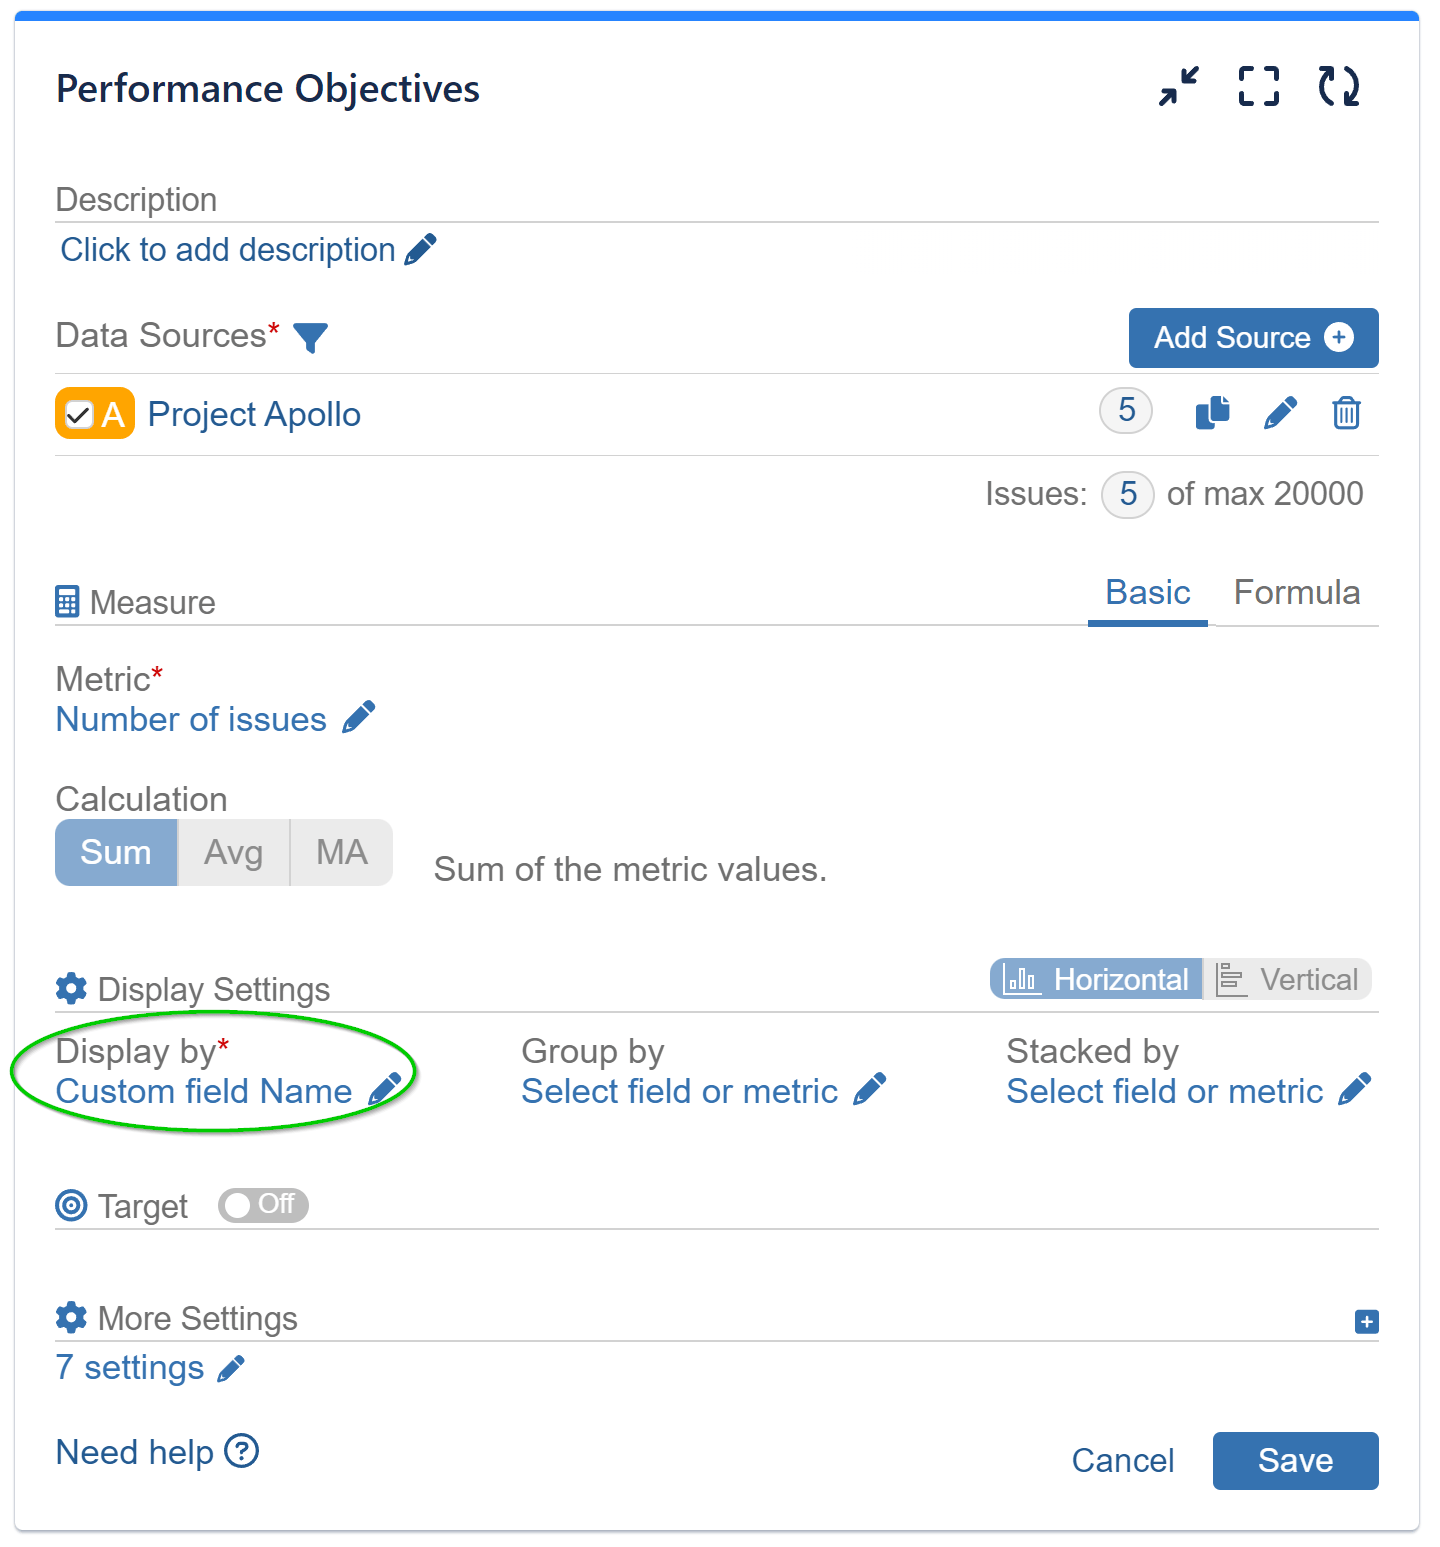
The basic report (Type 1) is to display all values of ‘Custom field Name’. You can easily achieve this with Performance Objectives app, as well as with native Jira. Here are the settings and the visualization on a bar chart with our app:
But if you want to create report only for certain values or sets of values of your custom field and display them separately (Type 2), you cannot achieve that in standard Jira reporting, although you can filter them with JQL.
With Performance Objectives app and JQL data segmentation you can filter issues based on any value and/or sets of values of your custom field and visualize them in your preferred chart type.
Here are some JQL examples for the same set of test issues shown above. Please check the video below with step-by-step configuration using these JQL queries to create 3 separate segments and display them on the same bar chart.
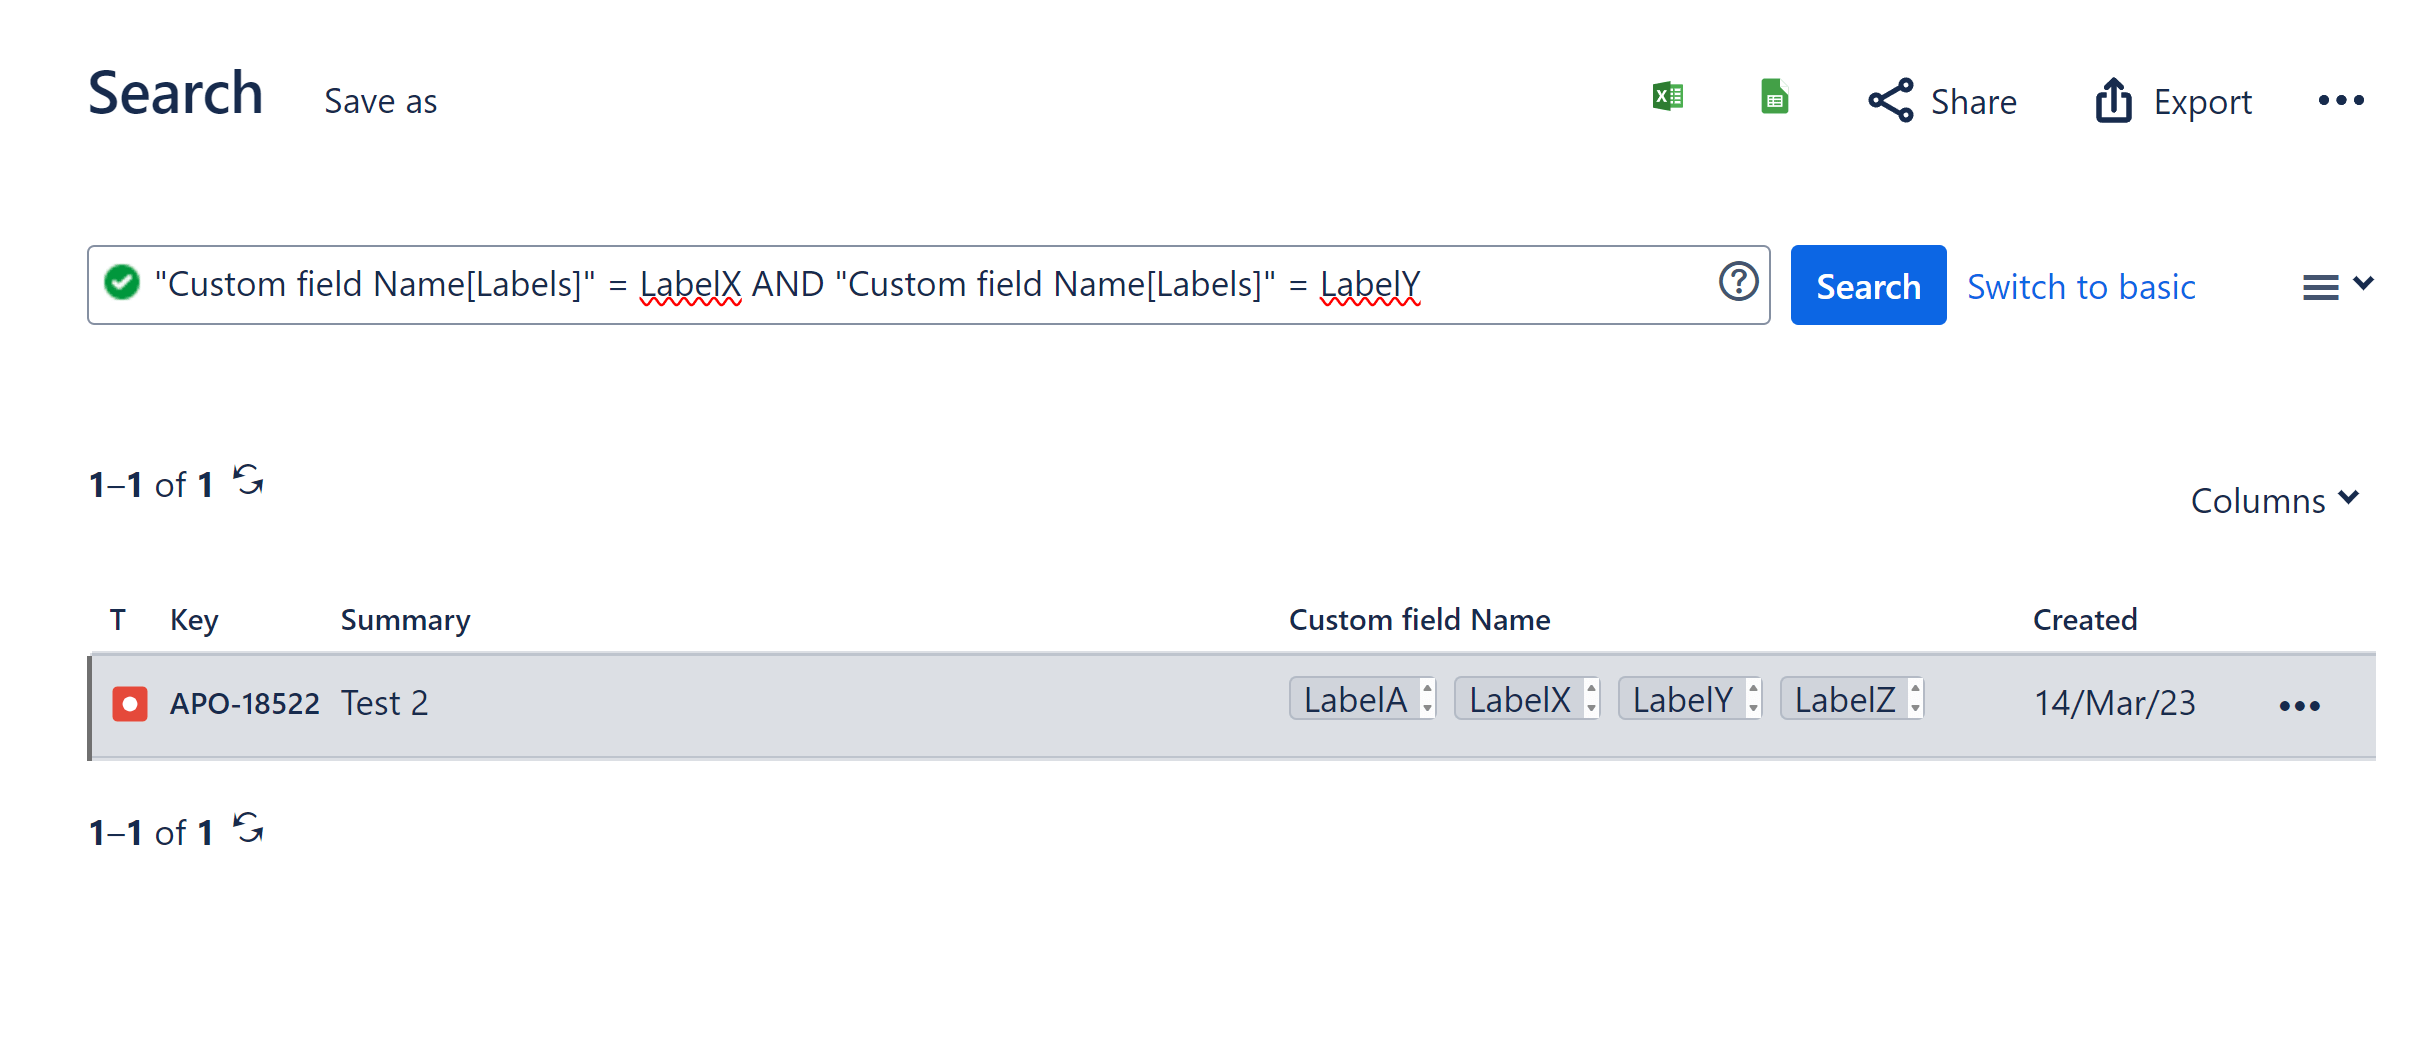
Scenario 1: Show issues that contain both LabelX and LabelY:
JQL query: “Custom field Name” = “LabelX” AND “Custom field Name” = “LabelY”
The query will filter only the following issue from our test case:
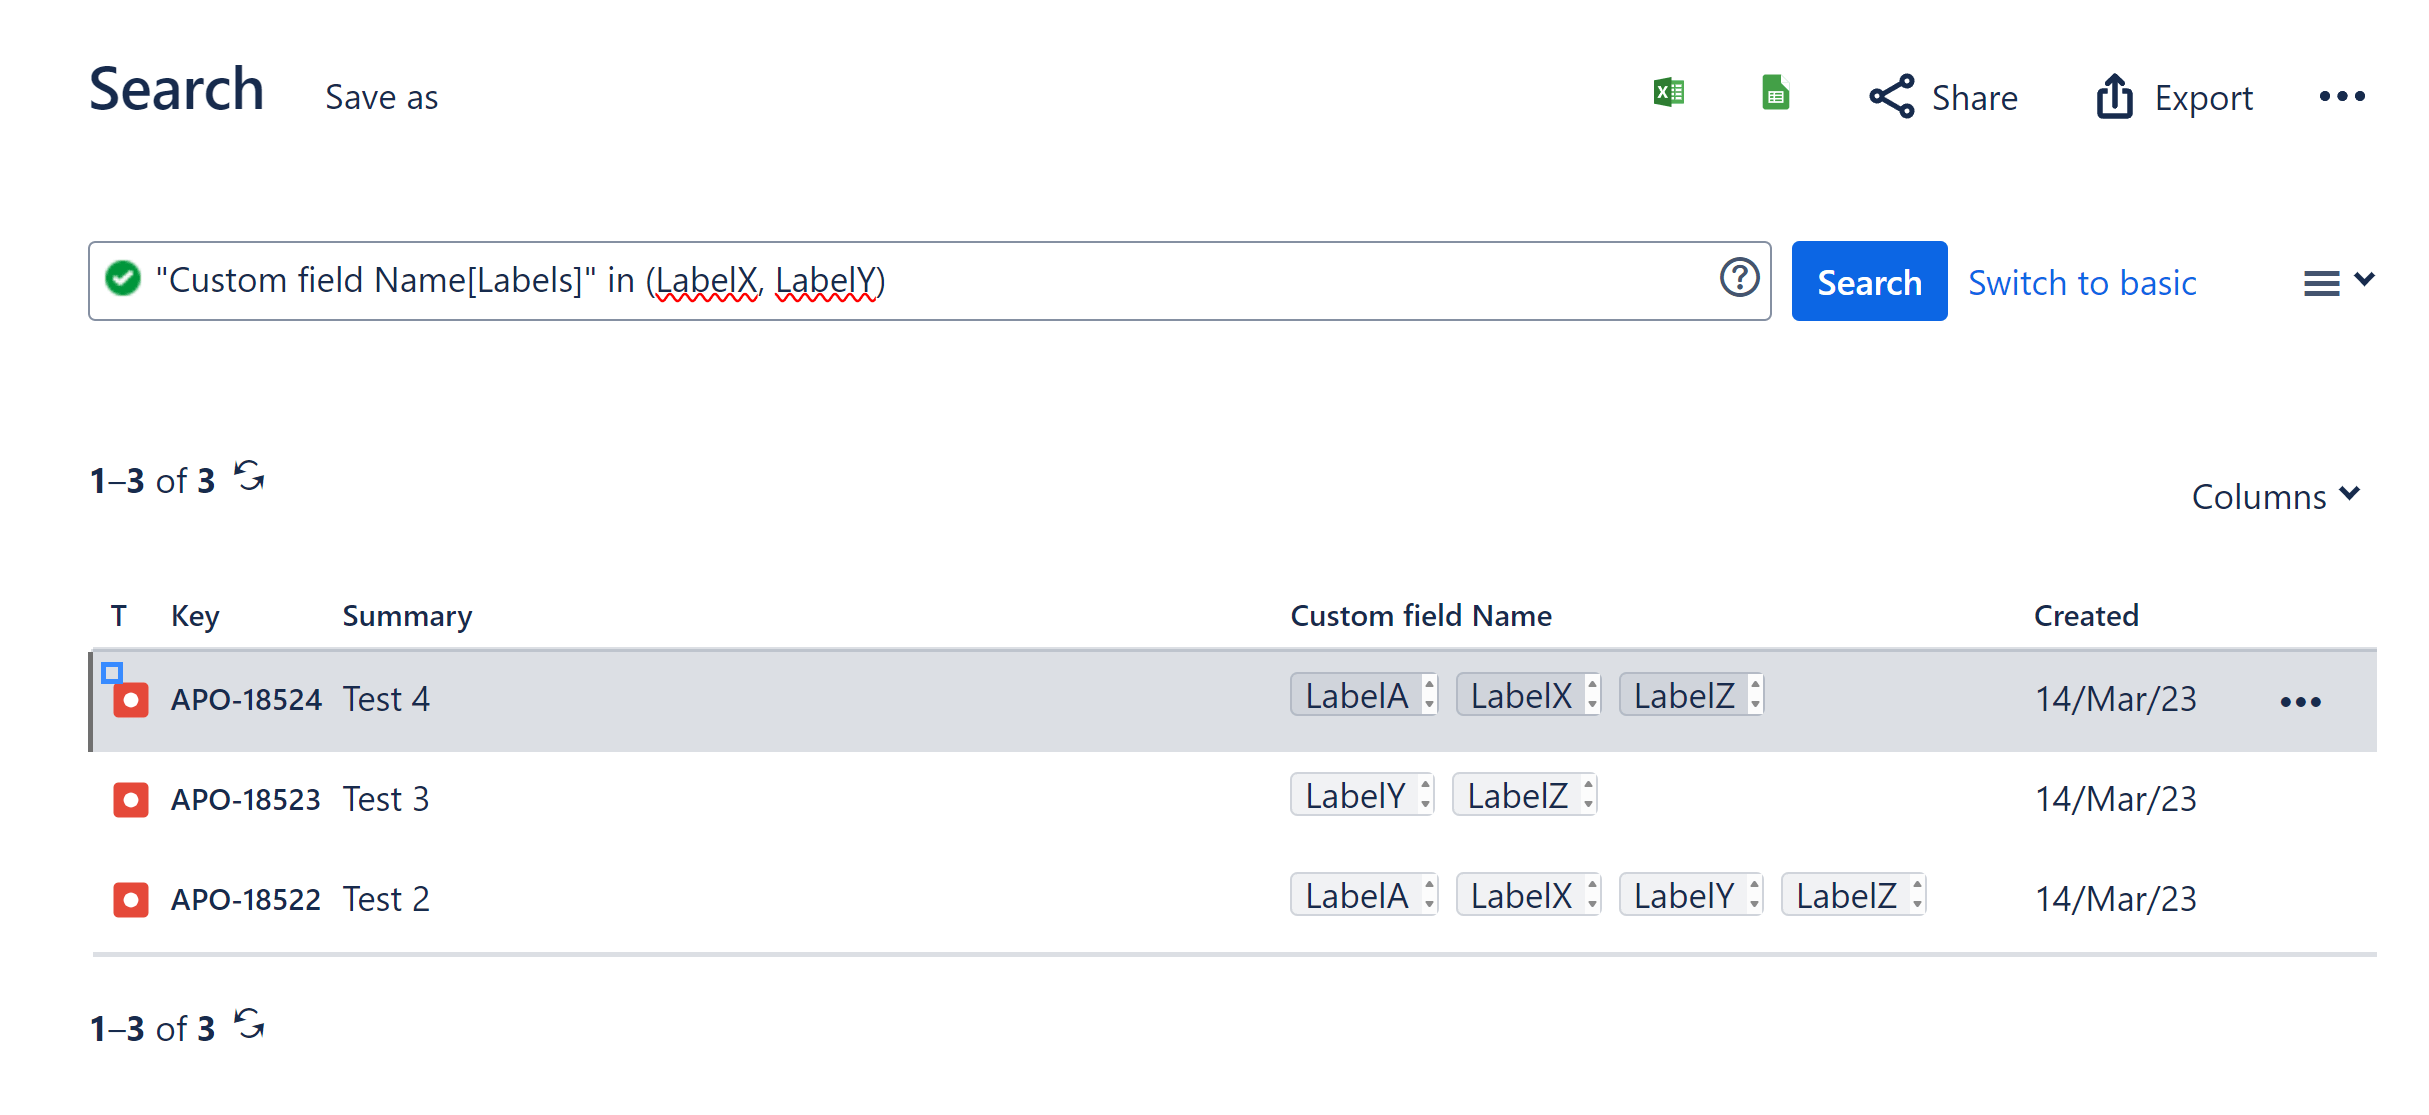
Scenario 2: Show issues that contain any of the labelX or LabelY:
JQL Query: “Custom field Name” in ( “LabelX” , “LabelY”)
The query will filter only the following issues from our test case:
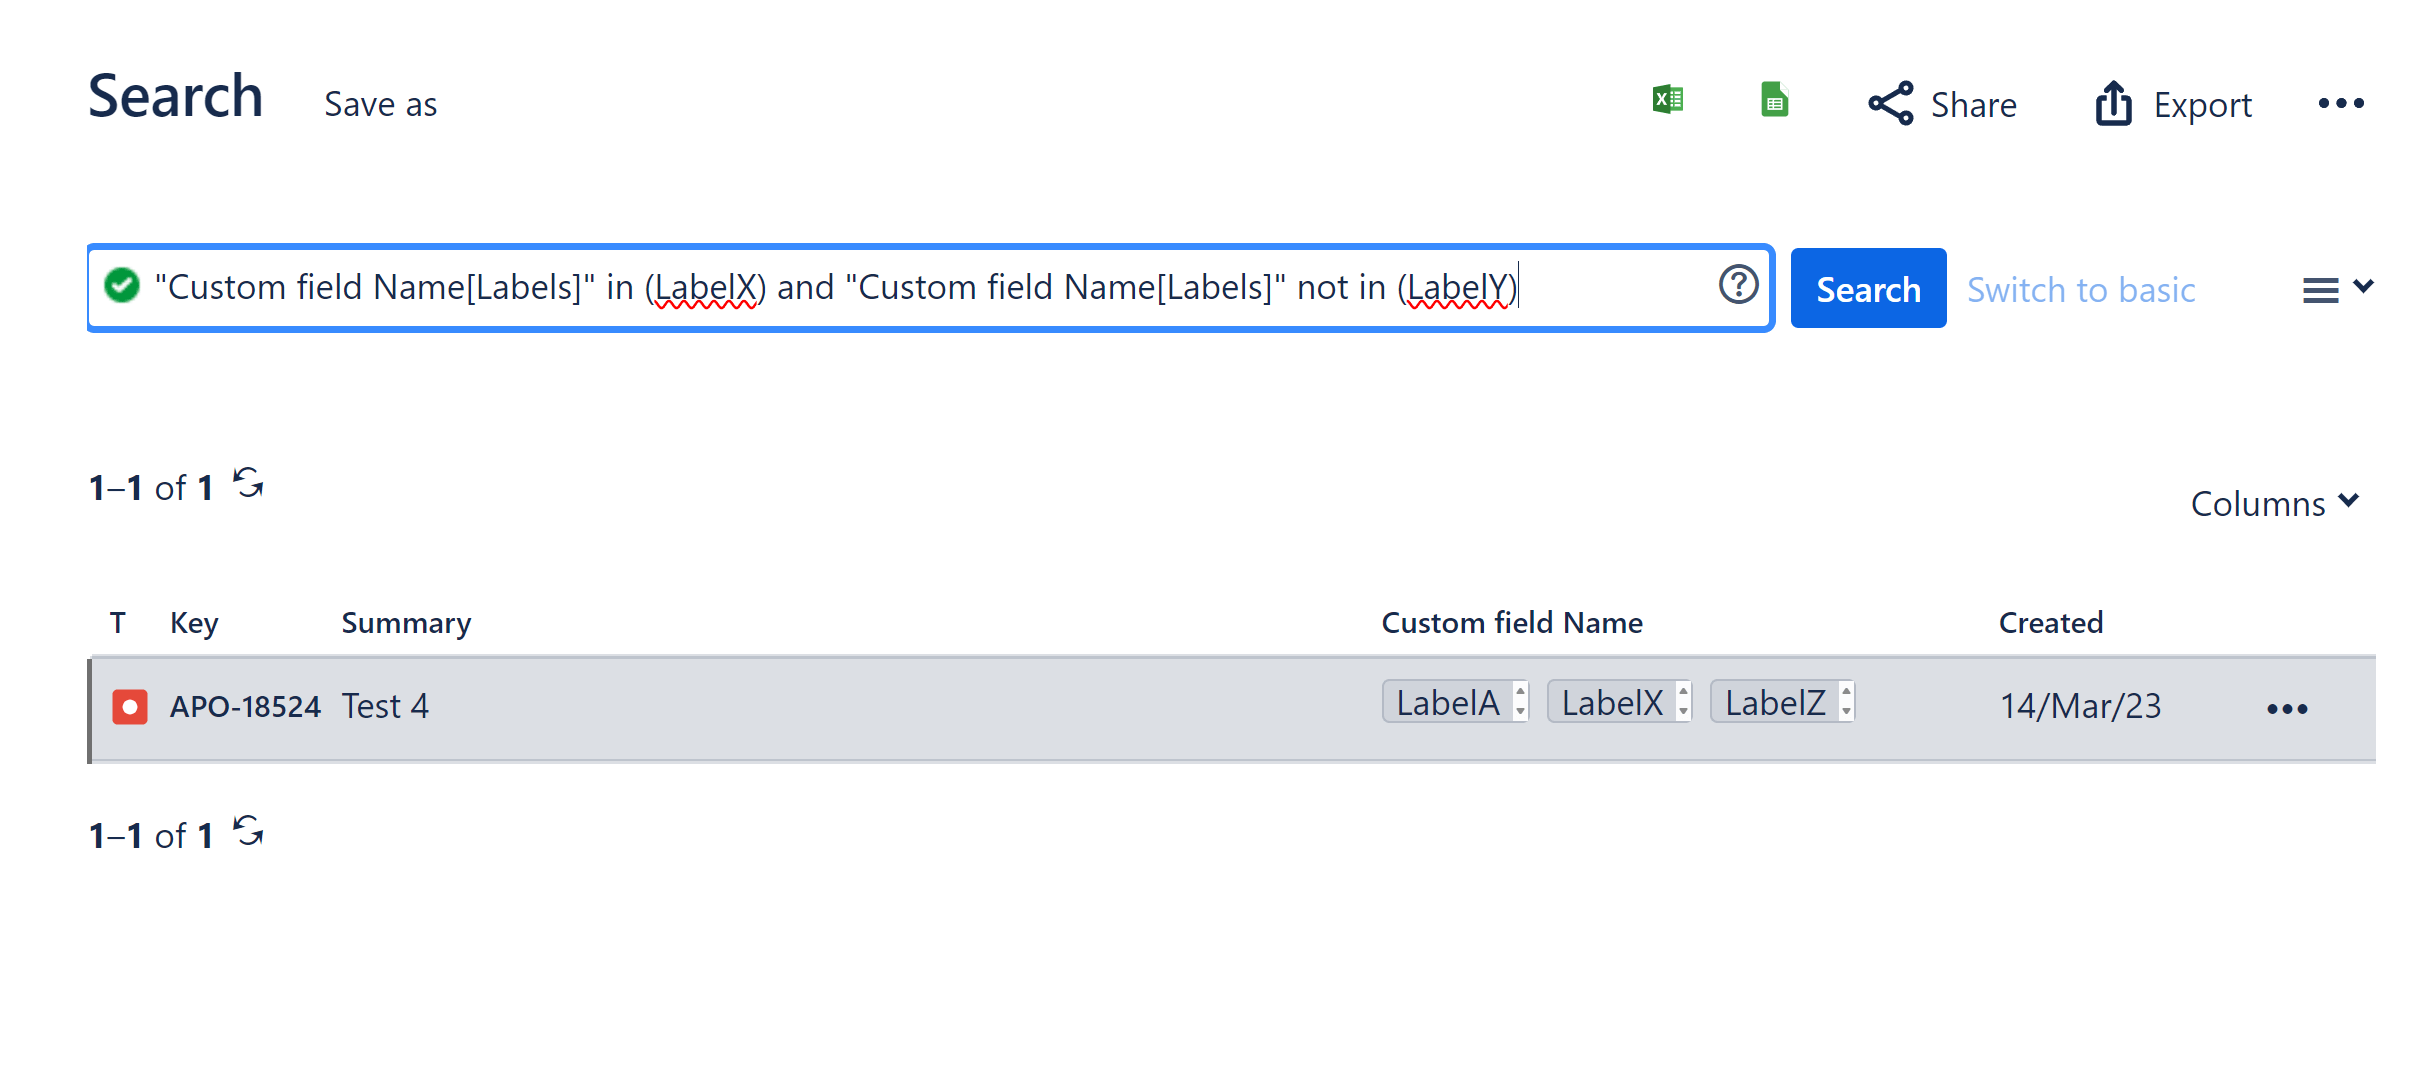
Scenario 3: Show issues that contain LabelX and do not contain LabelY:
JQL query: “Custom field Name” in ( “LabelX” ) and “Custom field Name” not in (“LabelY”)
The query will filter only the following issues from our test case:
Here are the basic steps to create your Custom Labels report. The example is set to display the above 3 scenarios as 3 separate data sources stacked by Issue Key.
Step 1: Segment the issues in the Data Source using the available standard options + your custom JQL. Create separate data sources for every scenario you want to visualize on the same chart. You can copy the first created data source and then edit it to fit your needs.
In our test case:
Data Source 1 for issues that contain both LabelX and LabelY
Data Source 2 for issues that contain any of the LabelX or LabelY
Data Source 3 to filter issues that contain LabelX and do not contain LabelY
Issues with more than one matching scenario are counted separately in each data segment.
Step 2: Choose metric from the metric field menu, in our case it is ‘Number of issues’.
Step 3: Display data ‘by Data Source’.
Step 4: (Optional) Use the ‘Stack By’ option to add more detail to your report, e.g., Stack By Issue Type, Priority, Project, or any other Jira field or metric.
Step 5: Save the configuration.
Video recording with the sample configuration:
This is a basic configuration to show the flexibility of data segmentation in the app using JQL query + multiple data sources. You can build more complex scenarios filtering the data in the data sources by filter, date range, particular issue types, statuses, users, priorities, etc.
Here you may find more ideas how to utilize JQL functionality in your reports with the Performance Objectives app:
Start your 30 days free trial of Performance Objectives: Charts for Jira from Atlassian Marketplace.