One of the features that set the Performance Objectives app for Jira apart from other charting and reporting tools on the marketplace is its distinctive Formula Metric feature.
This feature allows you to create custom KPIs by combining multiple metrics from different data segments in a user-defined mathematical equation. Tailor your reports by assigning specific metric weights or work costs based on the segment, providing unparalleled flexibility and customization to extract valuable insights from your Jira data.
On your gadget configuration screen, choose ‘Formula’ as a measure option. This enables you to combine different metrics from various data segments defined in the data sources, creating custom formula metric calculations that suit your Jira reporting needs.

Create Tailored Formula Metric Calculations in Jira
We will guide you through the configuration steps for generating a Defects Severity Report in Jira. This report enables you to monitor the overall impact of the defects identified by applying weights to different severity levels, reflecting the increasing impact of defects as their severity level rises. In our demonstration, we utilize the Jira system field “Priority.” Nonetheless, you have the flexibility to create a similar report using your custom fields for severity and/or priority levels.

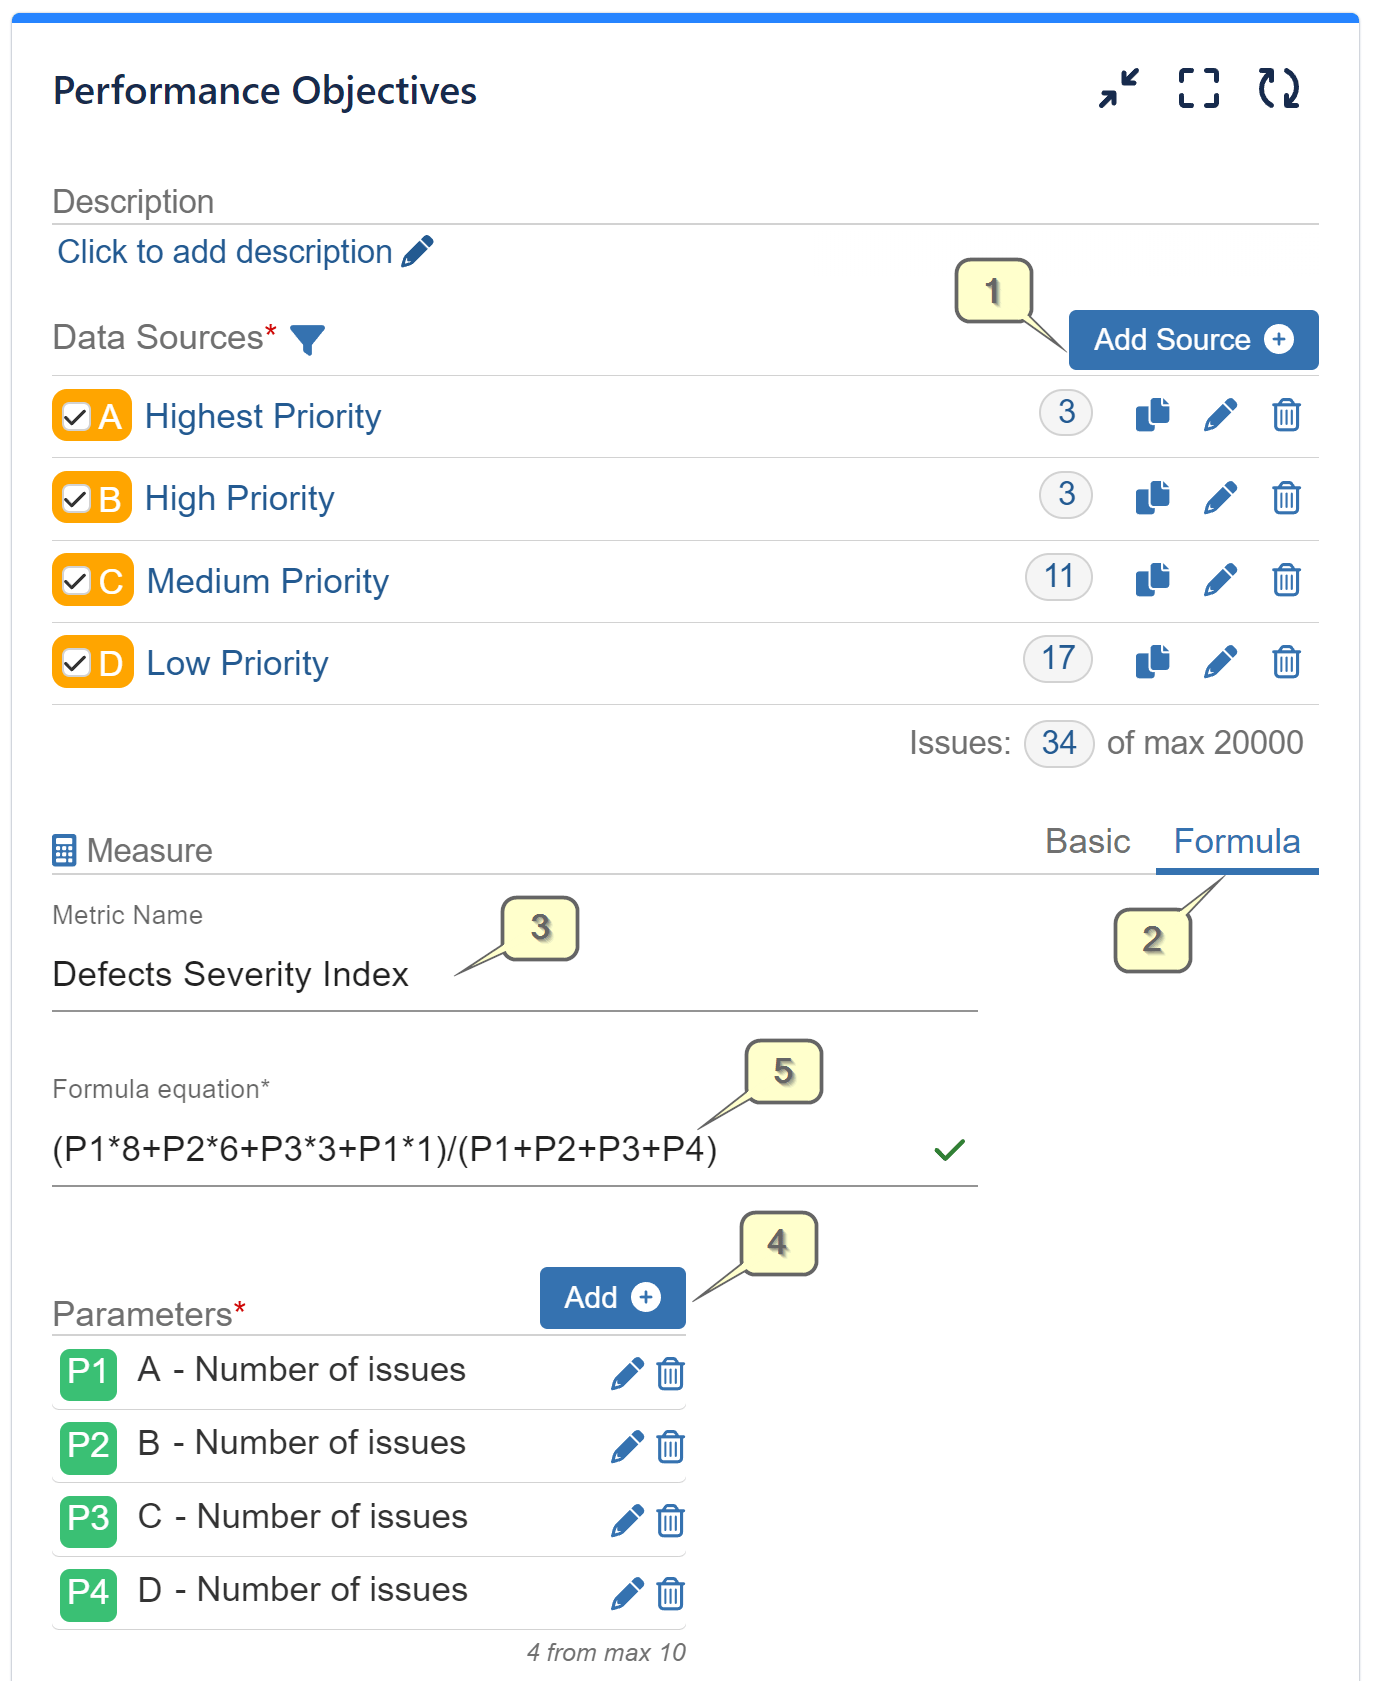
Step 1: Generate multiple data sources displaying bugs with distinct levels of priority created within the same time period.
Step 2: Select Formula Metric calculation.
Step 3: Give your custom formula metric a name.
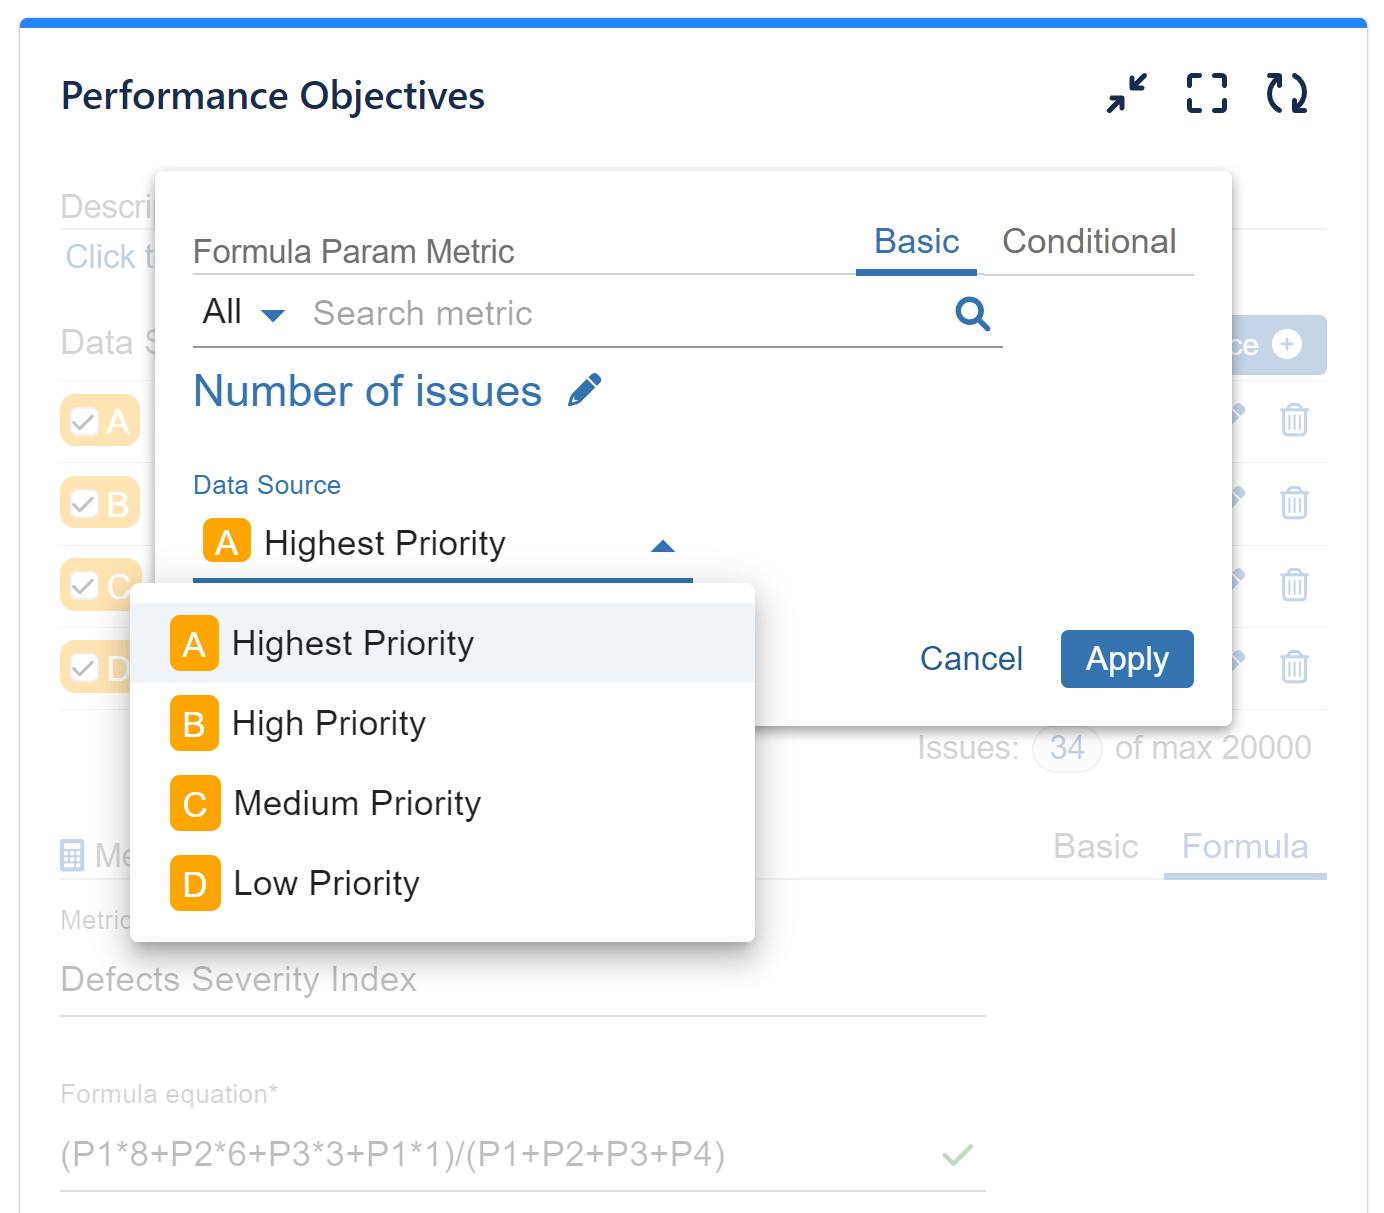
Step 4: Include parameters in your equation and specify the data source for each.
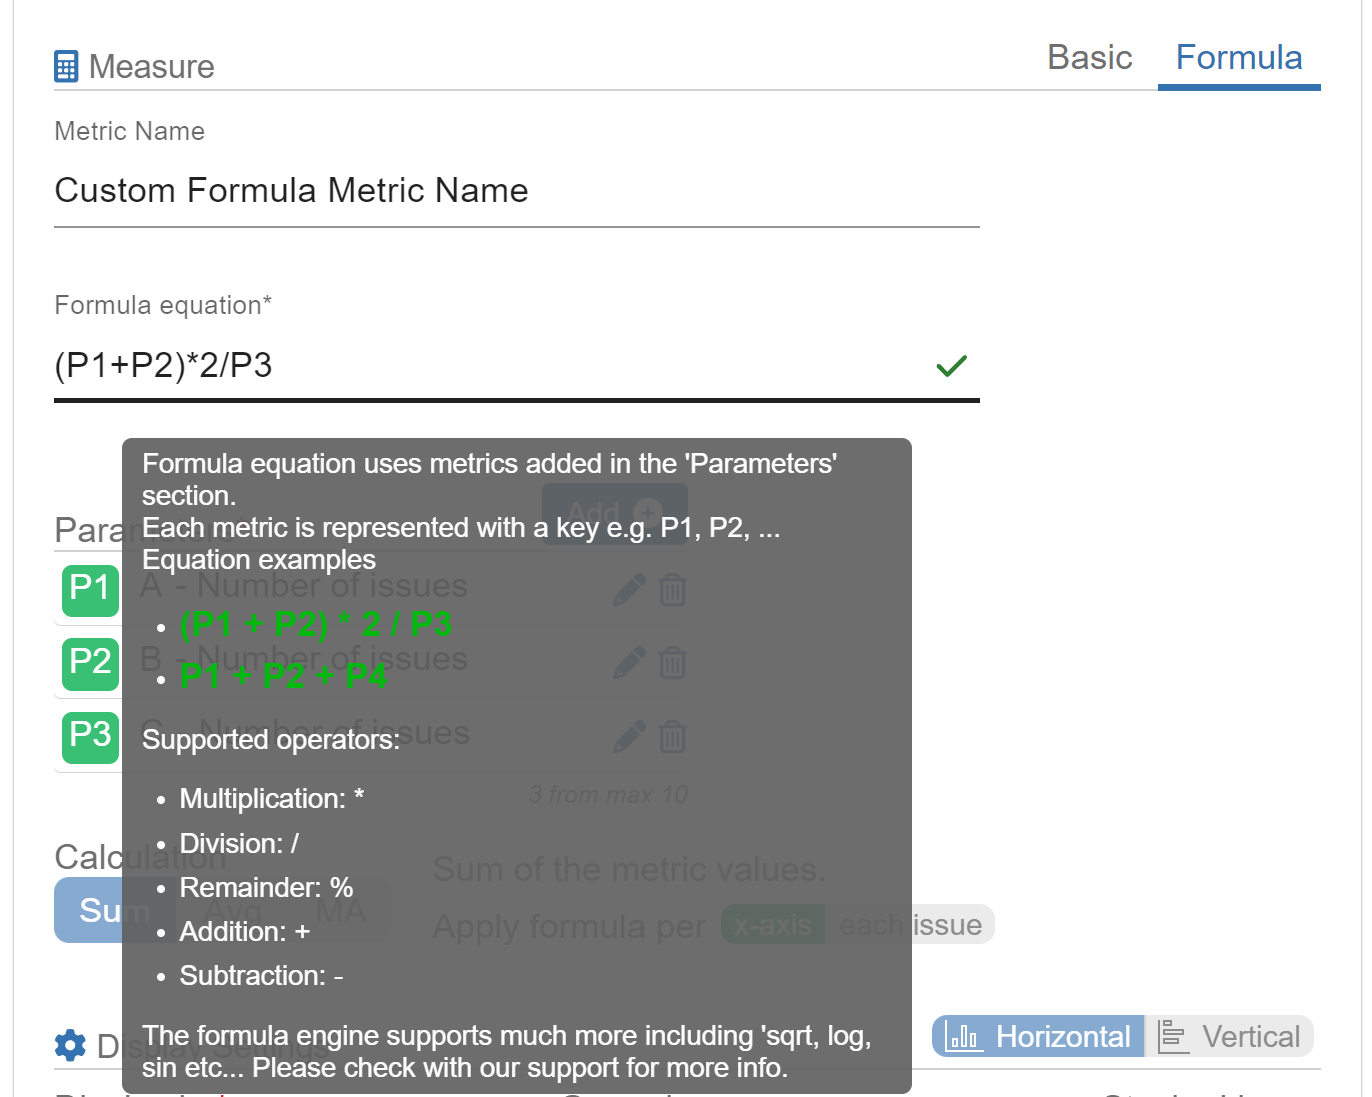
Step 5: Input your formula equation.

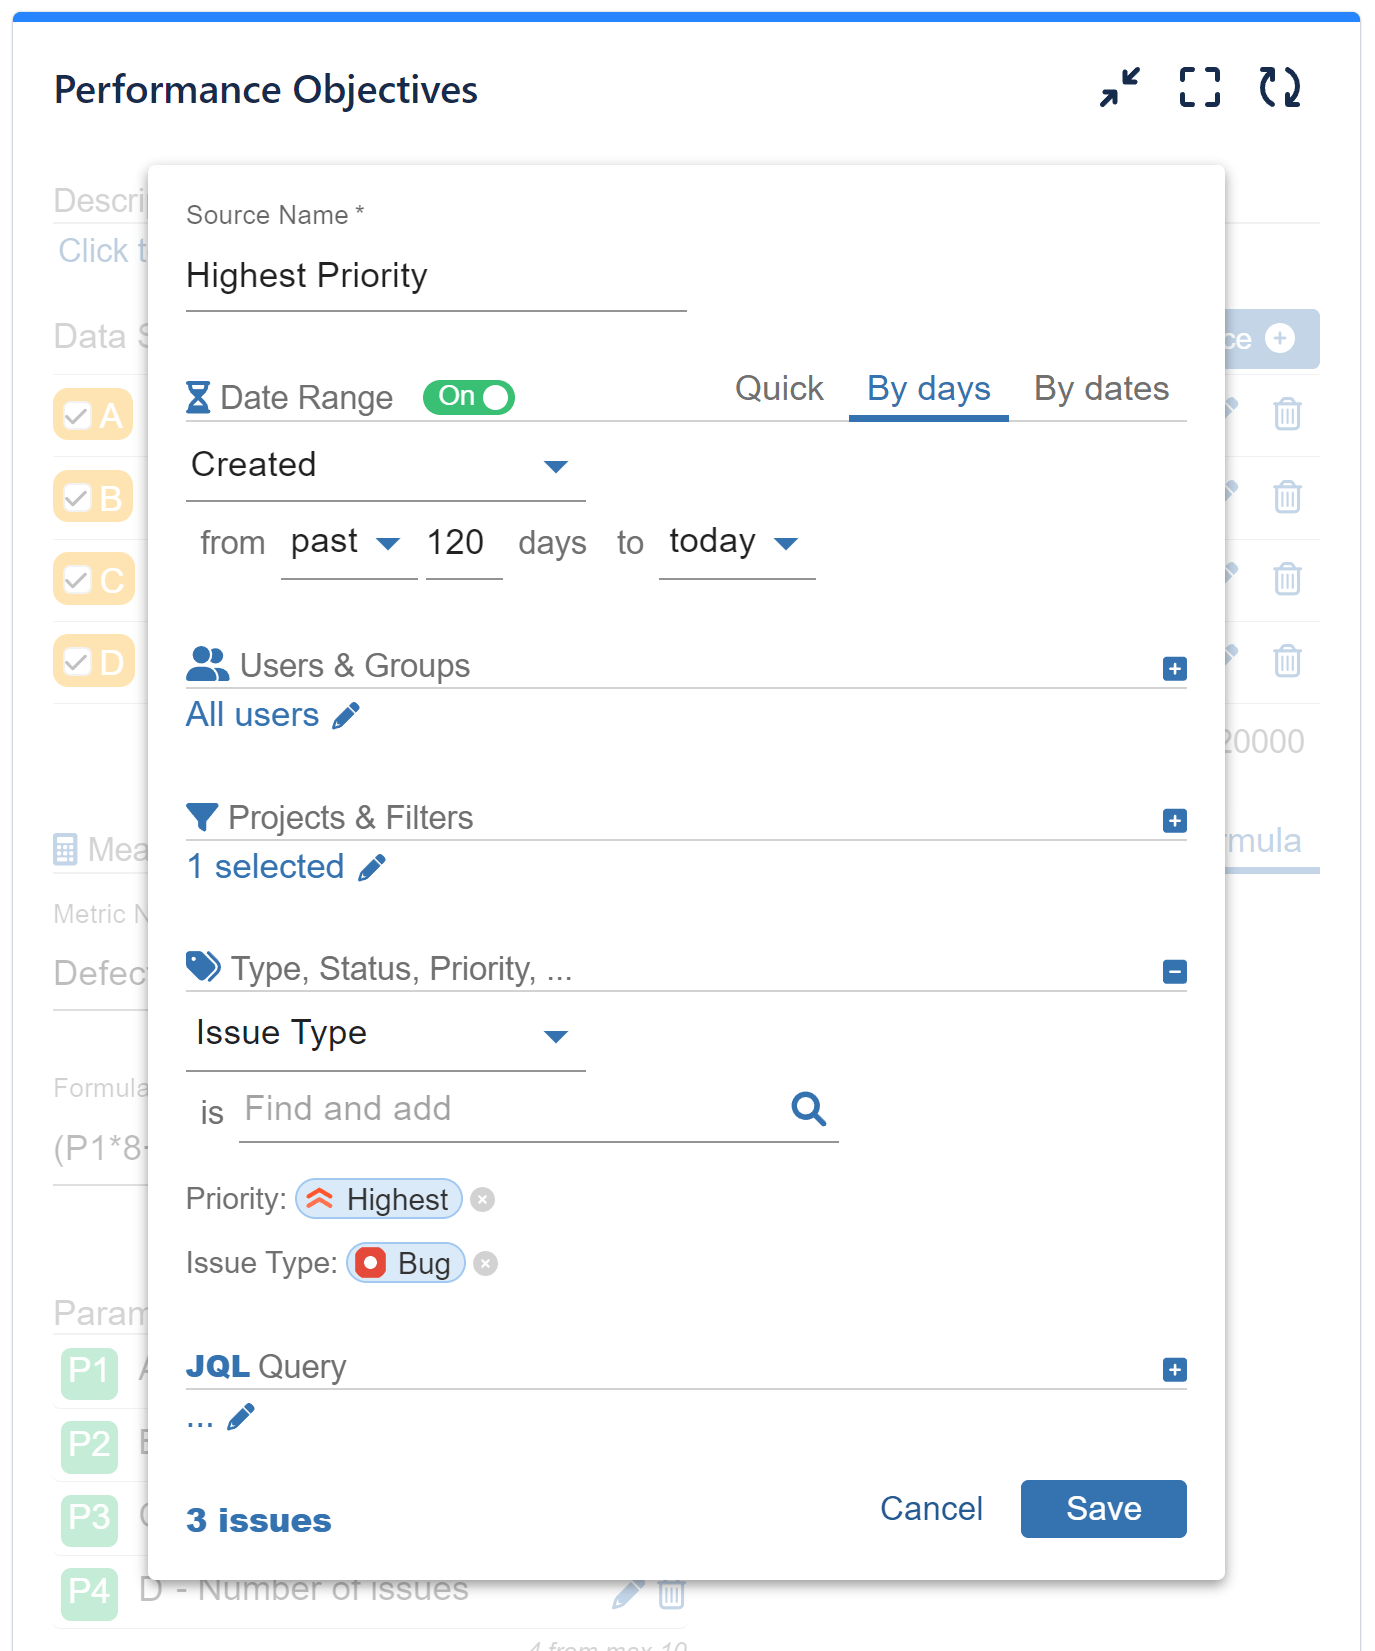
Step 1 in detail: Utilize the Data Segmentation feature of our app to filter only “Bug” Issue Type with distinct levels of priority for each data source.

Step 4 in detail: For every metric employed as a parameter in the equation, you retain the flexibility to select the data source. In our sample scenario, we have identified four distinct data sources: Bugs with varying levels of priority created within the last 120 days.
Please review the comprehensive configuration steps for our sample report using the Formula feature in the following recording:
In our example, we have used formula metric and equation which represents a weighted calculation for bug severity during a specific time period. Each parameter of the equation (P1, P2, P3, P4) is assigned a different weight (8, 6, 3, 1, respectively), reflecting their relative importance. Thus, the “(P1*8+P2*6+P3*3+P1*1)/(P1+P2+P3+P4)” equation calculates the weighted sum of bugs across priority levels, divided by the total number of bugs.
Explore KPI cases crafted with formula metrics or browse through additional report examples in our KPI examples section.
Refer to our User Guide to learn about Conditional Metrics or explore more about the powerful features of the Performance Objectives app.
Start your 30 days free trial of Performance Objectives: Charts for Jira from Atlassian Marketplace.