Table of Contents
Utilizing Metric Distribution in Performance Objectives
Metric Distribution offers a valuable solution when Jira standard charting and tracking tools fail to provide the necessary depth of segmentation for effective performance monitoring. This feature allows users to delve deeper into their data and analyze it at a granular level, enabling the identification of intricate patterns, outliers, and subtle nuances that might otherwise go unnoticed.
The Performance Objectives: Charts for Jira app supports a powerful metric distribution feature that allows users to use Time, Number, Dynamic and SLA metrics as fields and segment them into custom distribution slots using the ‘Slot Splitters‘ functionality. This feature is available for any of the ‘Display by’, ‘Group by’, or ‘Stacked by’ dimensions in the Performance Objectives gadget, and can also be used in the Tree Map gadget, Circular chart gadget, Heat Map, and Venn Diagram. Metric distribution can be particularly useful for service projects and teams, as it helps them track their SLA performance and compliance more effectively.
Leveraging Slot Splitters for Granular Data Segmentation
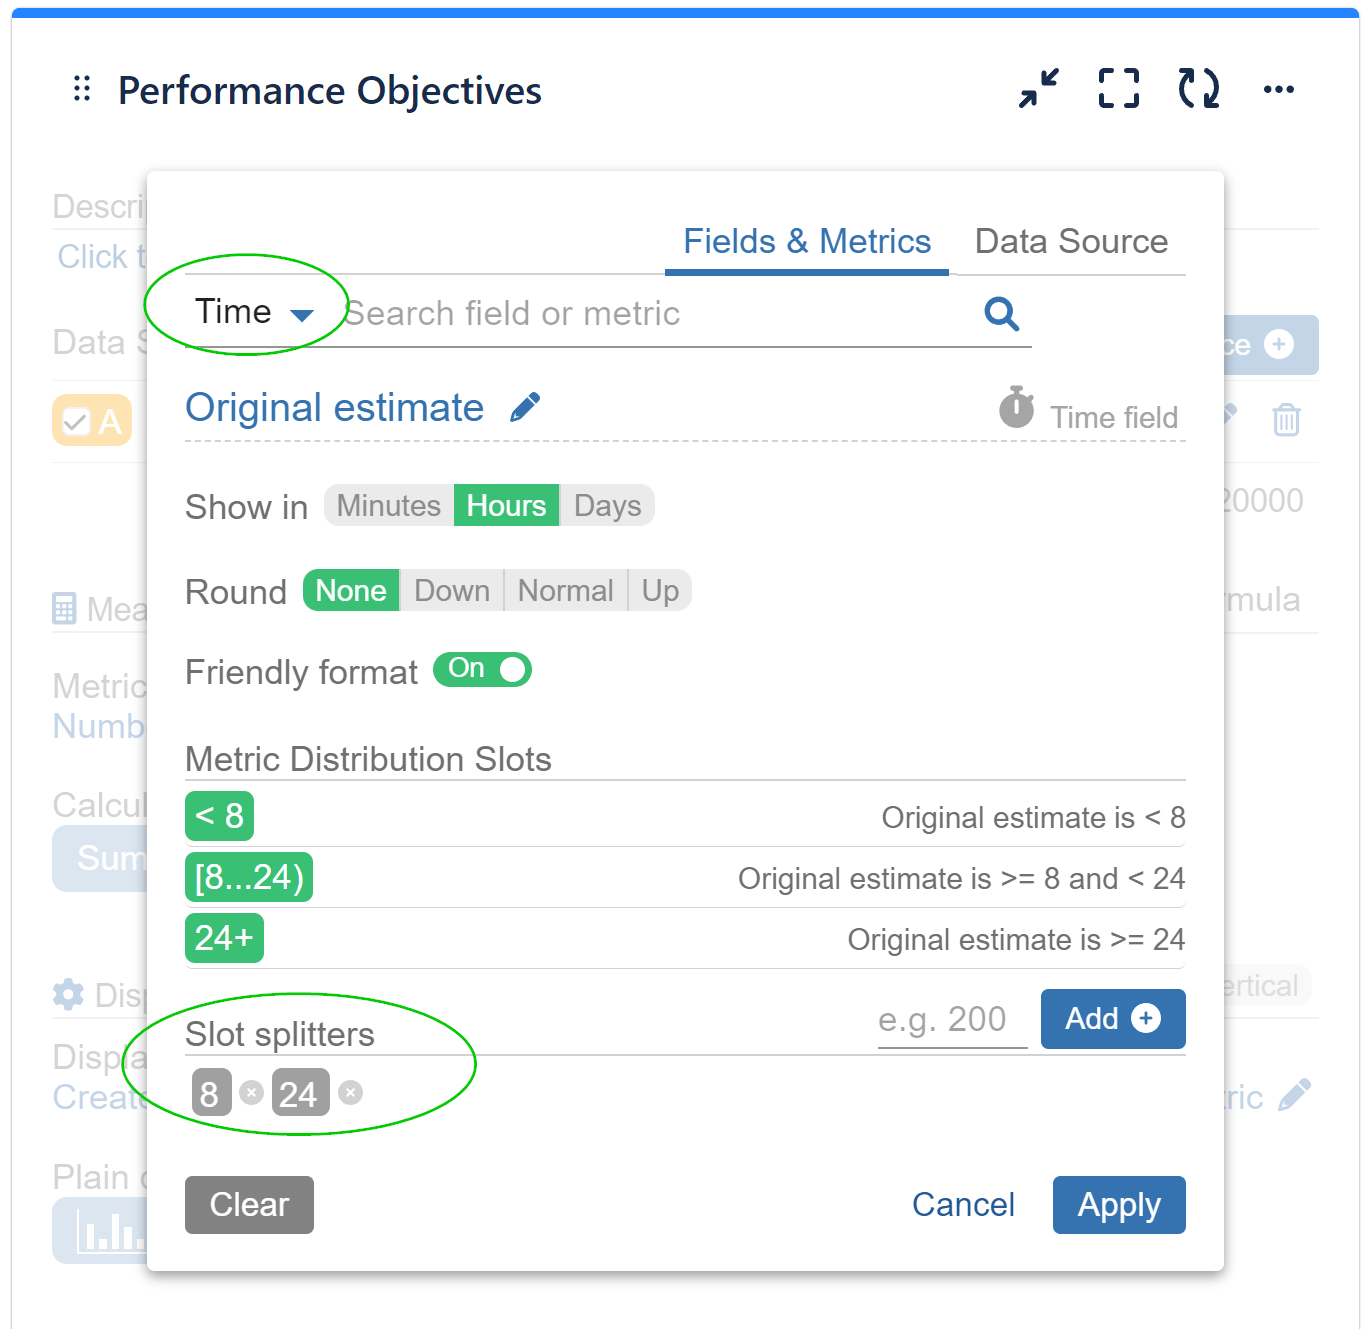
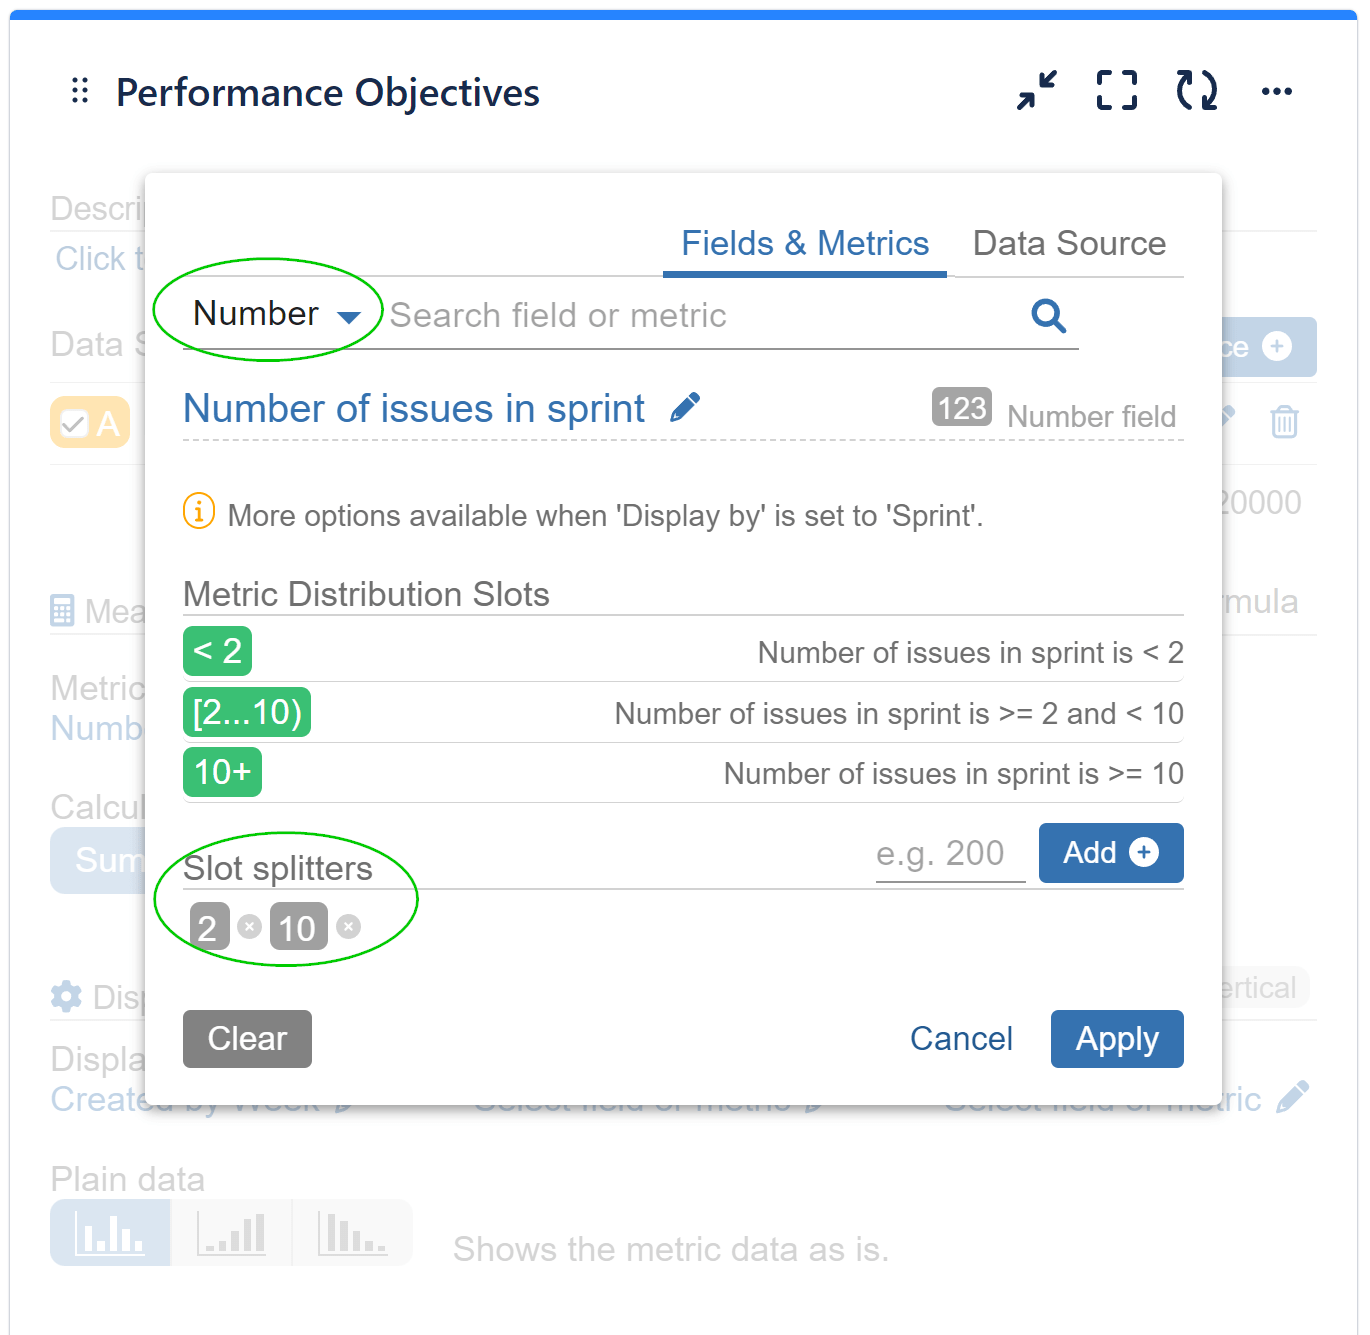
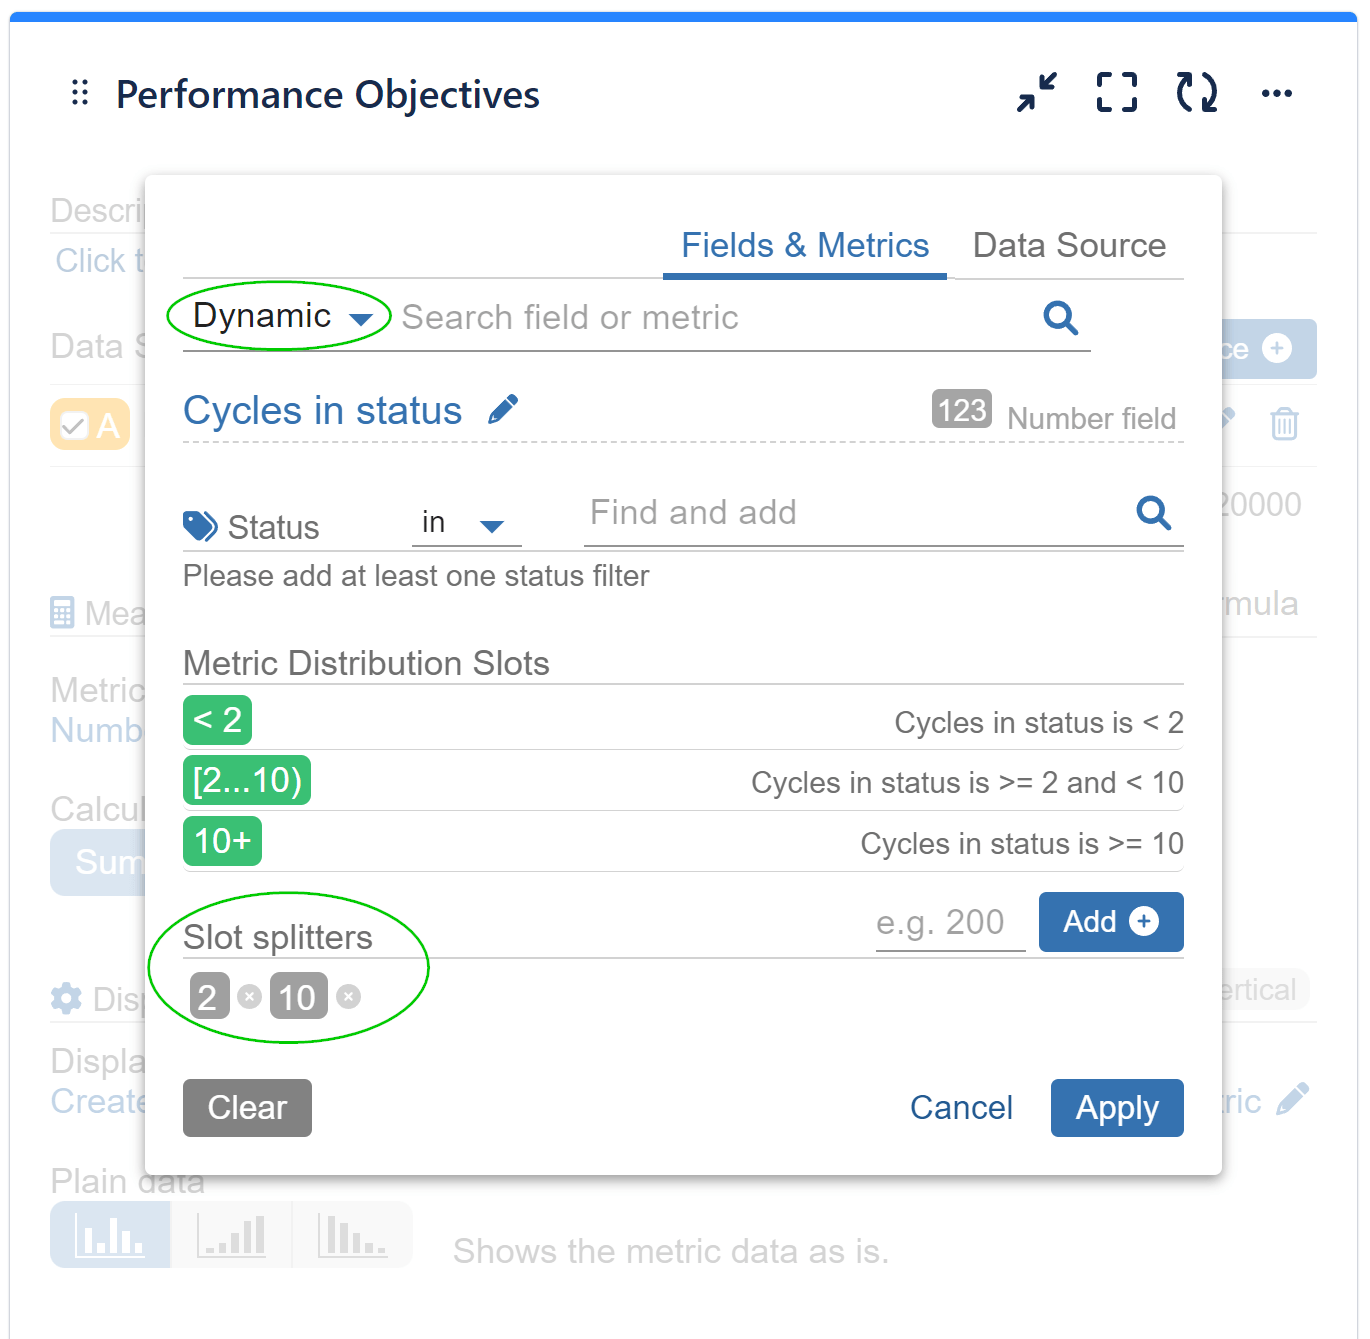
The ability to set custom Slot Splitters tailored to your specific service is a great advantage, enabling granular data segmentation and empowering you with deeper insights. With this feature, users have the flexibility to define their own segmentation criteria, aligning with their unique needs. By slicing and dicing the data into custom slots, users gain a deeper understanding of performance trends, identify areas of improvement, and uncover hidden opportunities. You can easily create multiple time distribution slots by using the “Add” button or remove unnecessary slots under “slot splitters.”
Sample slot splitter configurations for time, number, and dynamic metrics are displayed in the images below. These examples highlight the versatility of slot splitters in effectively segmenting data based on various criteria, allowing for a comprehensive analysis and a better understanding of performance metrics.
For a comprehensive list of all supported field types and metrics ready for immediate use, please consult our Configuration Overview.
Enhancing SLA Compliance Tracking in Jira Service Management
Metric distribution offers a compelling use case in the context of SLA metrics. Service Level Agreements (SLAs) are vital for measuring and ensuring the quality of service delivery. By leveraging metric distribution, teams can obtain valuable insights into SLA compliance and performance directly on their Jira dashboards.
When it comes to monitoring SLA metrics, custom time slots play a crucial role. These time slots enable teams to swiftly identify instances where response or resolution times exceed the agreed-upon thresholds. We are well aware that failing to meet SLA requirements can lead to significant consequences, such as a decline in service quality, reduced customer satisfaction, and even financial penalties. By observing SLA metrics within time slots aligned with their service contractual agreements, teams can gain visibility into the specific time ranges where breaches occur most frequently. This visibility enables them to identify areas for improvement and implement corrective actions to ensure compliance.
Step-by-Step Configuration for a “Number of issues with Time to Resolution SLA – Breached” Report:
If you are not familiar with the conditional metrics feature, don't miss our Conditional metrics article.
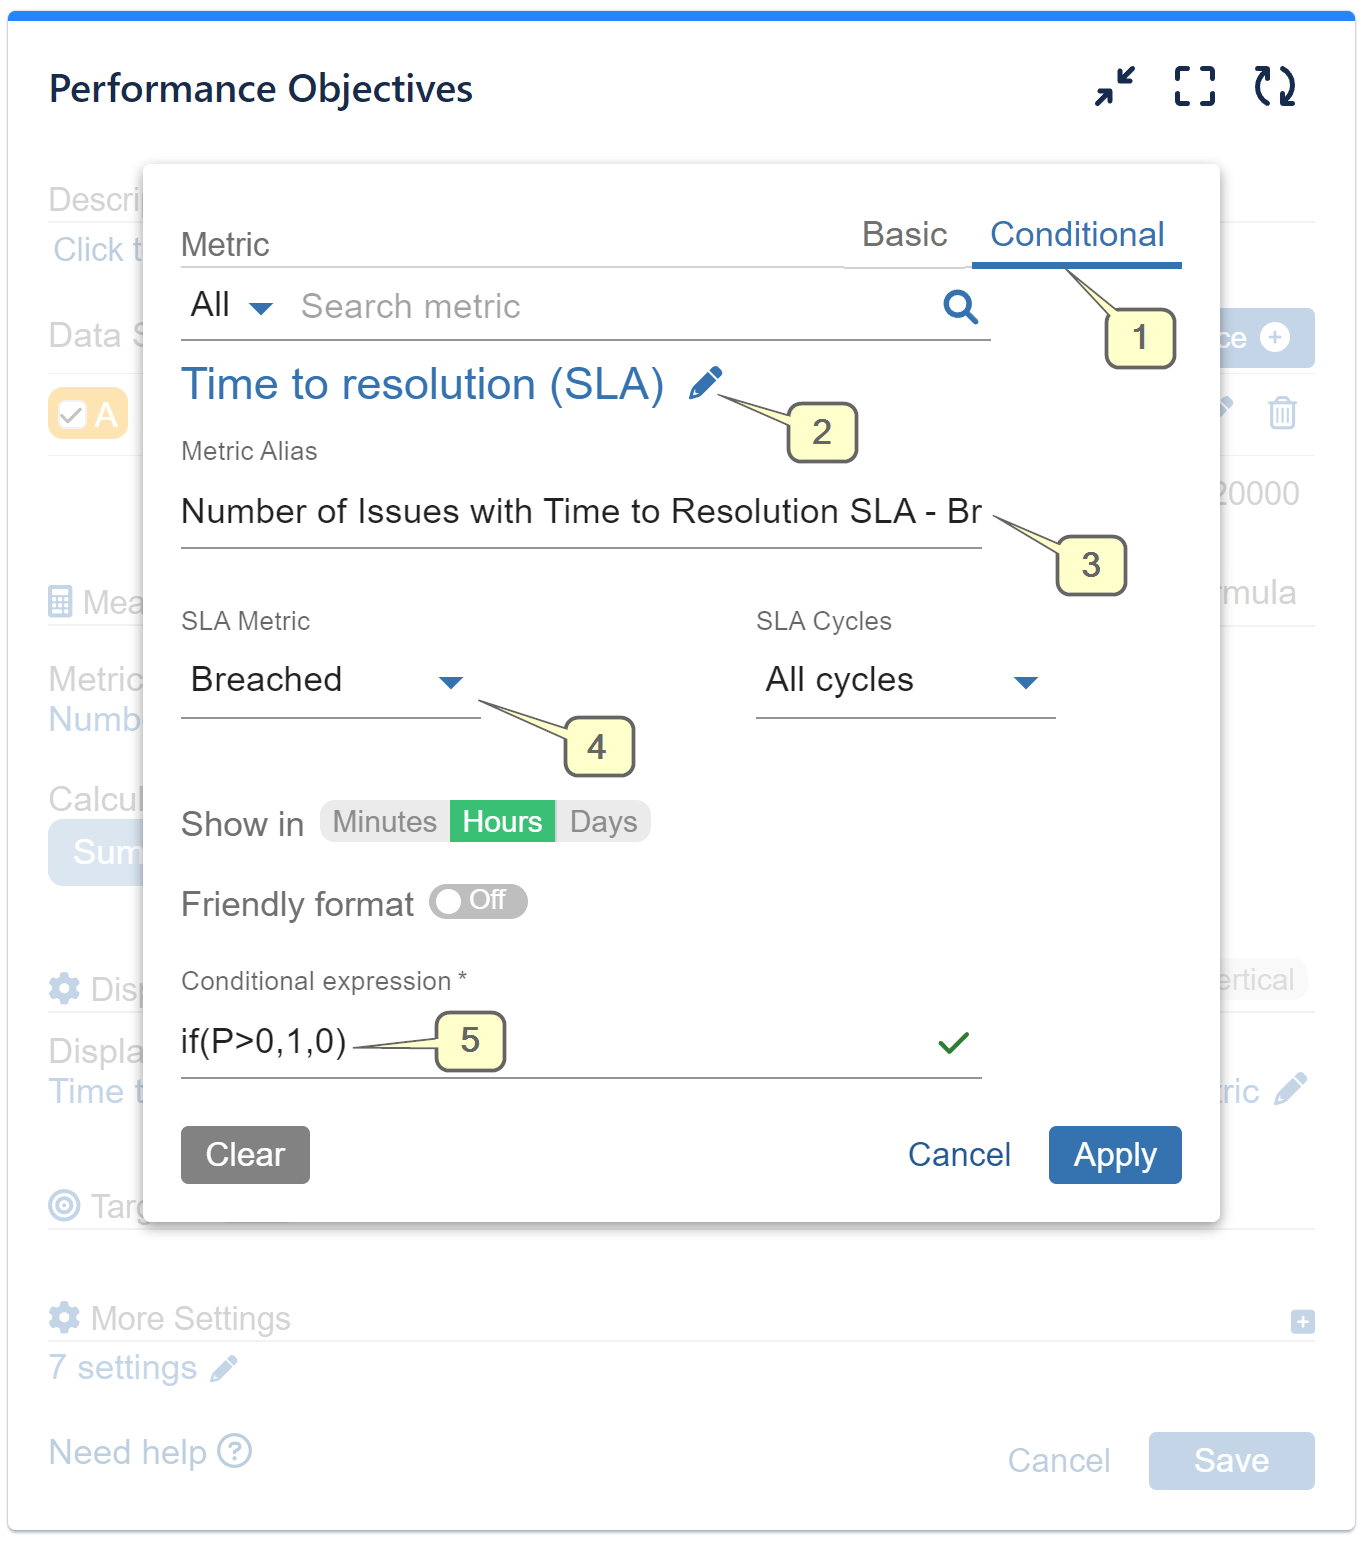
Step 1: Begin by selecting ‘Conditional’ metric option for the y-axis.
Step 2: Click on the drop-down menu, choose the SLA category, and then, select ‘Time to resolution SLA’. Alternatively, you can simply type ‘SLA’ in the search field and choose from the suggested metrics that contain the keyword.
Step 3: Add a custom name for the ‘Metric Alias’.
Step 4: Ensure that the metric is set to ‘Breached’ for ‘All cycles’.
Step 5: In the Condition expression field, enter: if(P>0,1,0). By setting this condition, you can filter, count, and display on the chart only those issues that meet the ‘Breached’ condition for the selected ‘Time to resolution (SLA)’ metric.
As an alternative to steps 1 to 5, you can use the following JQL: 'Time to resolution' = breached() in the Data Source settings to filter out only issues that breached that SLA. After that, choose the 'Number of issues' metric instead of the conditional metric. To dive deeper into data filtering with JQL, don't miss our article on JQL Data segmentation.
Step 6: Choose the ‘Display by’ view option and select ‘Time to resolution (SLA)’ metric.
Step 7: Remove the default Slot splitters and add your custom time segments.
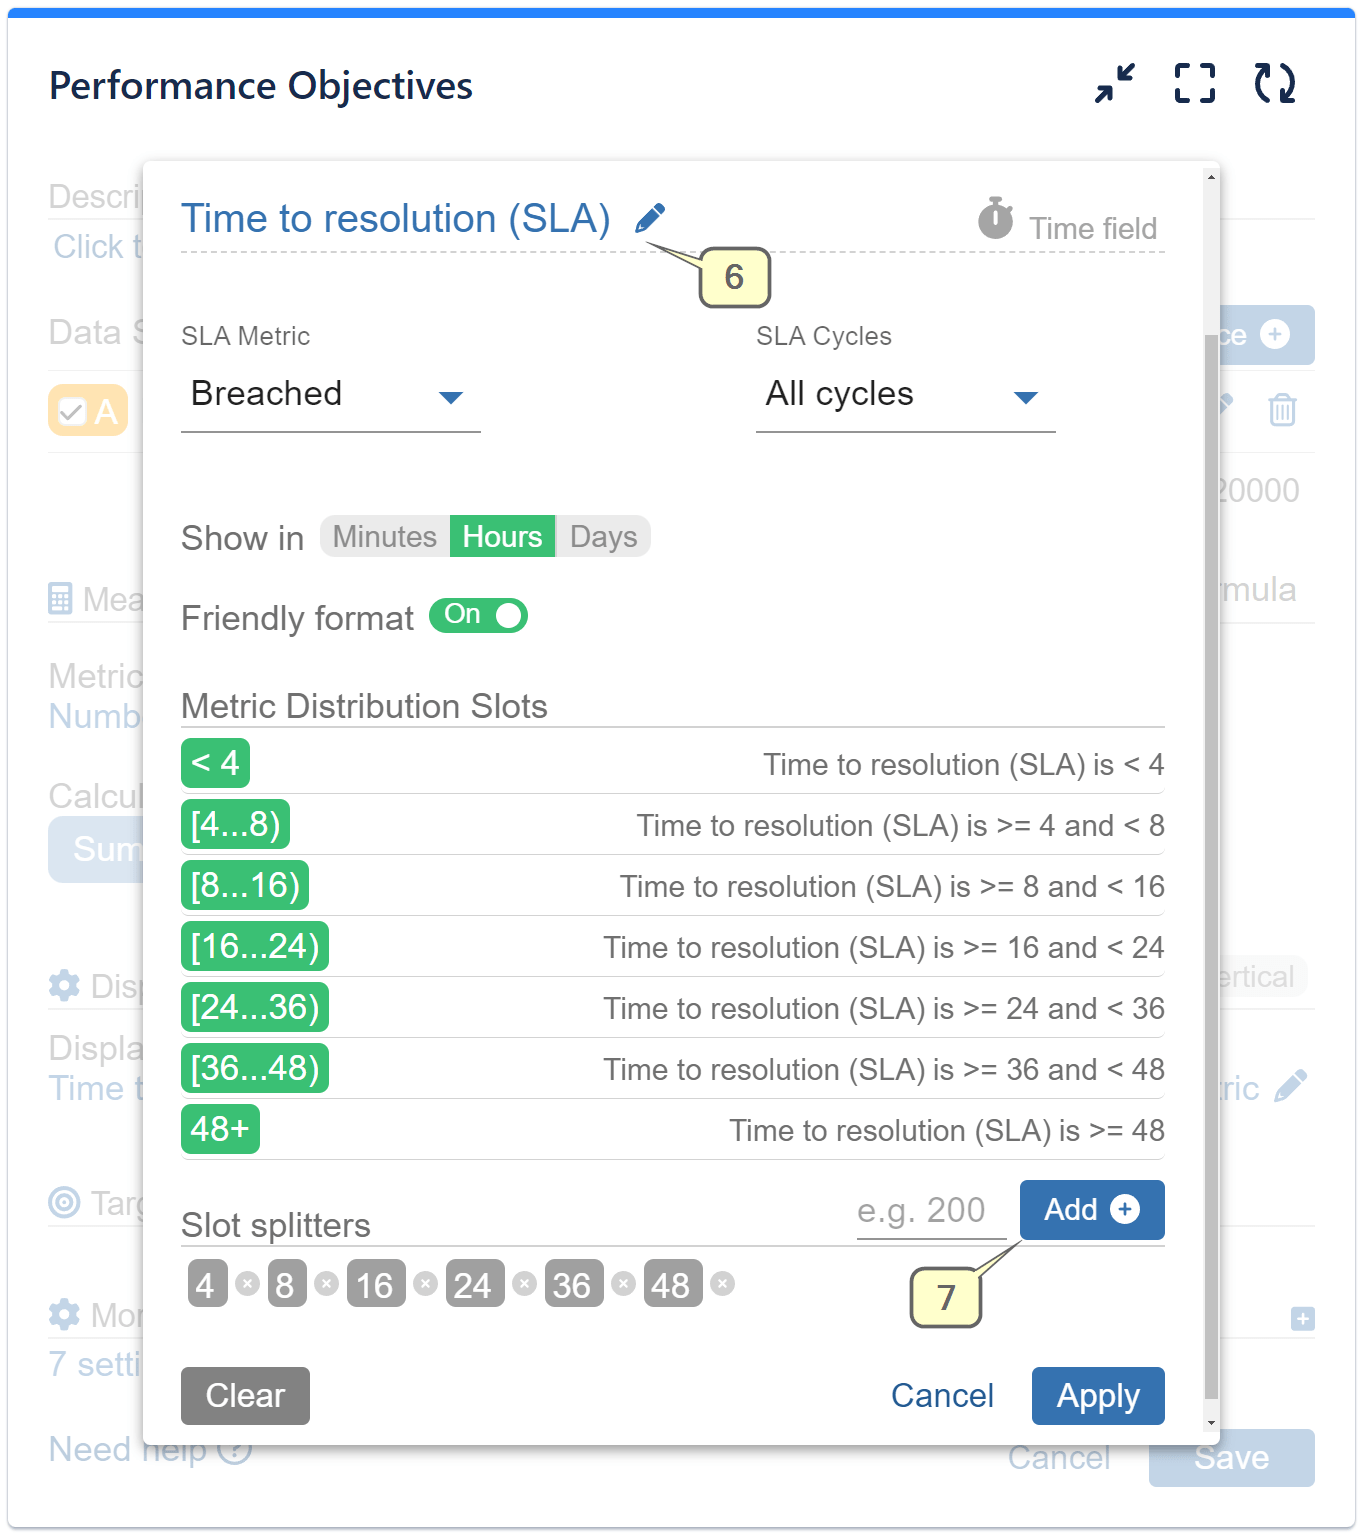
Examine the visualization for this configuration:
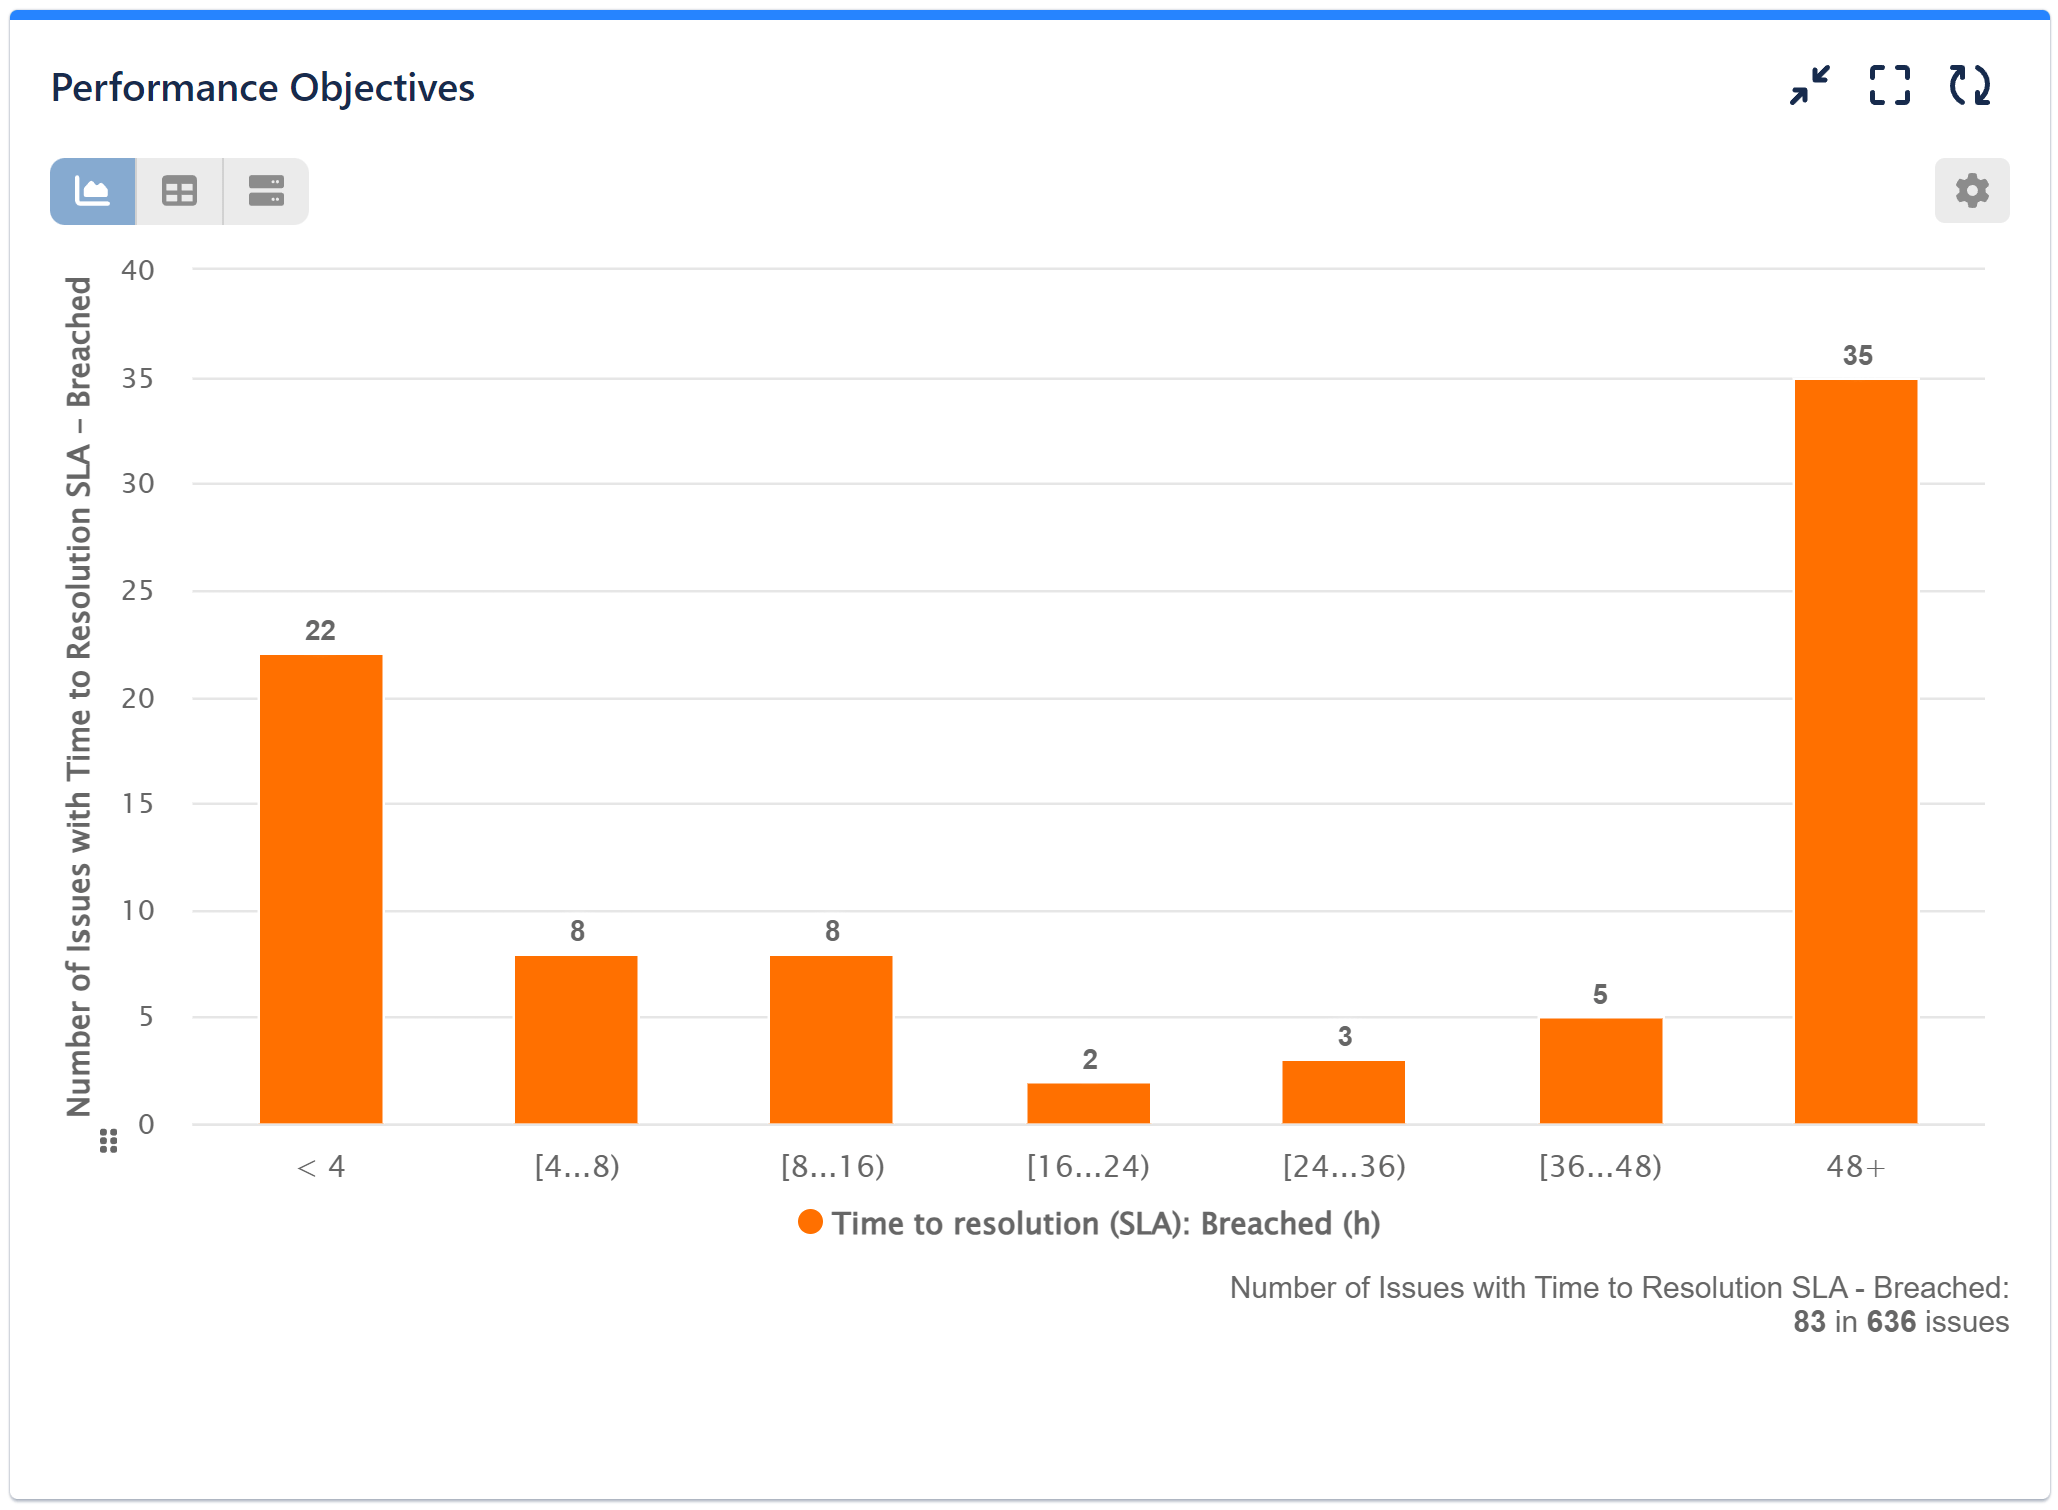
In this report, we see that out of the 636 filtered issues from the defined Data Source, 83 have breached the Time to Resolution SLA. Utilizing the power of Metric distribution and slot splitters, we can precisely determine the number of issues that breached the SLA within specific intervals: less than 4 hours, between 8 to 16 hours, more than 48 hours, etc.
Review the recording below for the sample configuration steps:
In this video, we have showcased the alternative approach to filter breached issues using JQL:
To access comprehensive information about the diverse features offered by the Performance Objectives: Charts for Jira app, please refer to our User Guide.
Start your 30 days free trial of Performance Objectives: Charts for Jira from Atlassian Marketplace.