Use Moving Average as a metric calculation with Performance Objectives app and present any selected Jira metric as Moving average.
The feature is available in Performance Objectives and Performance Trend dashboard gadgets. It will smooth data and give you good visibility of certain trends or patterns. Consider analyzing a longer time period to reduce the impact of random deviations in the data that can more significantly affect a short time period analysis.
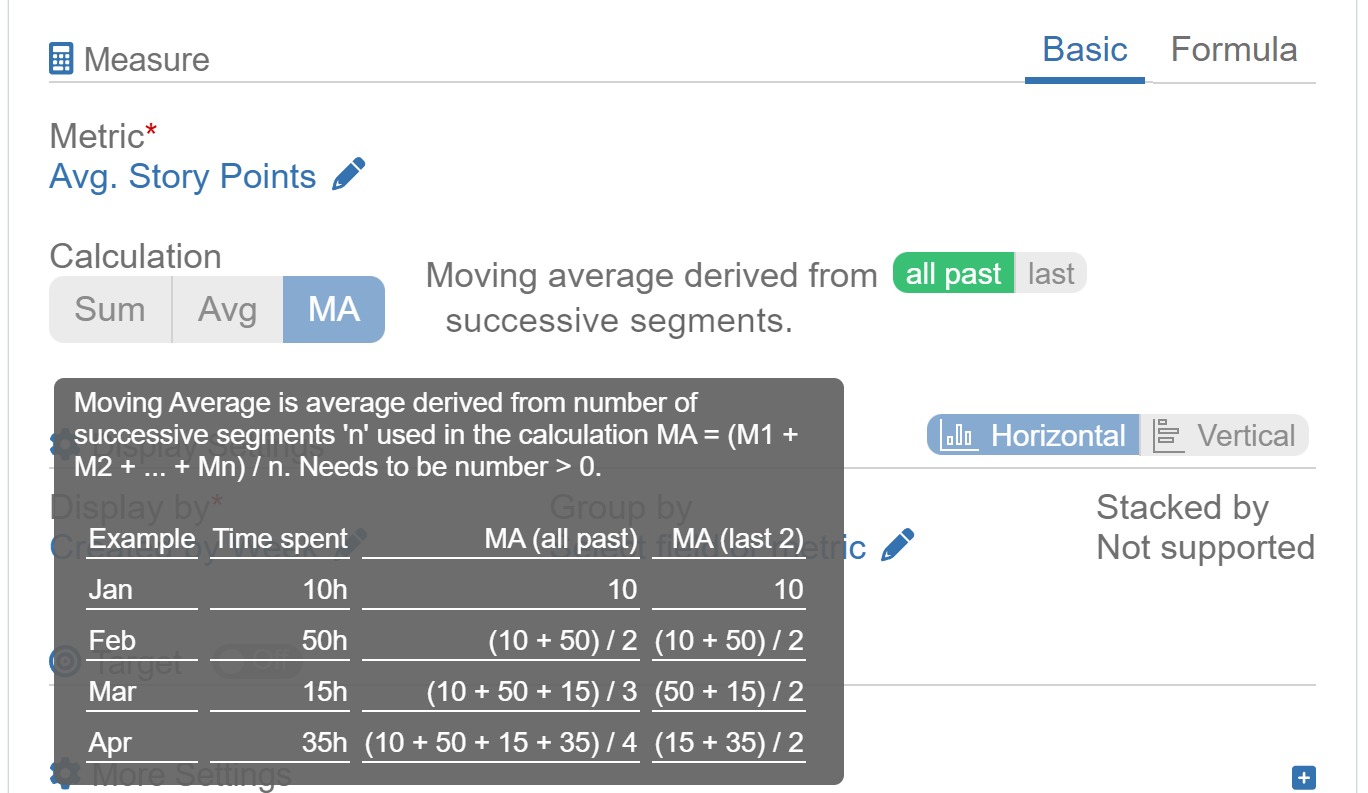
MA calculation can be specified by the user for every report to derive from all past successive segments or from last ‘n’ successive segments.
The Concept of Rolling Average
You will find many different interpretations of the terms moving and rolling average on the Internet, they are very often defined as identical or are used interchangeably. In the tooltip below we have given an example of how we calculate MA in the app. We use Simple Moving Average formula. If you need to calculate another type of MA, consider using the Formula Metrics feature in the app.
If you observe that recent changes in a long-term data set better reflect the trend in your performance, consider using use the last ‘n’ successive segments option.
Sample Use Case: Calculating Weekly Moving Average for Resolved Issues
In the dynamic landscape of issue resolution, understanding long-term performance trends can be challenging due to weekly fluctuations. By leveraging the Moving Average (MA) calculation, we can effectively smooth out these variations and reveal the underlying trends. This use case presents a comparative analysis using three distinct visualizations:
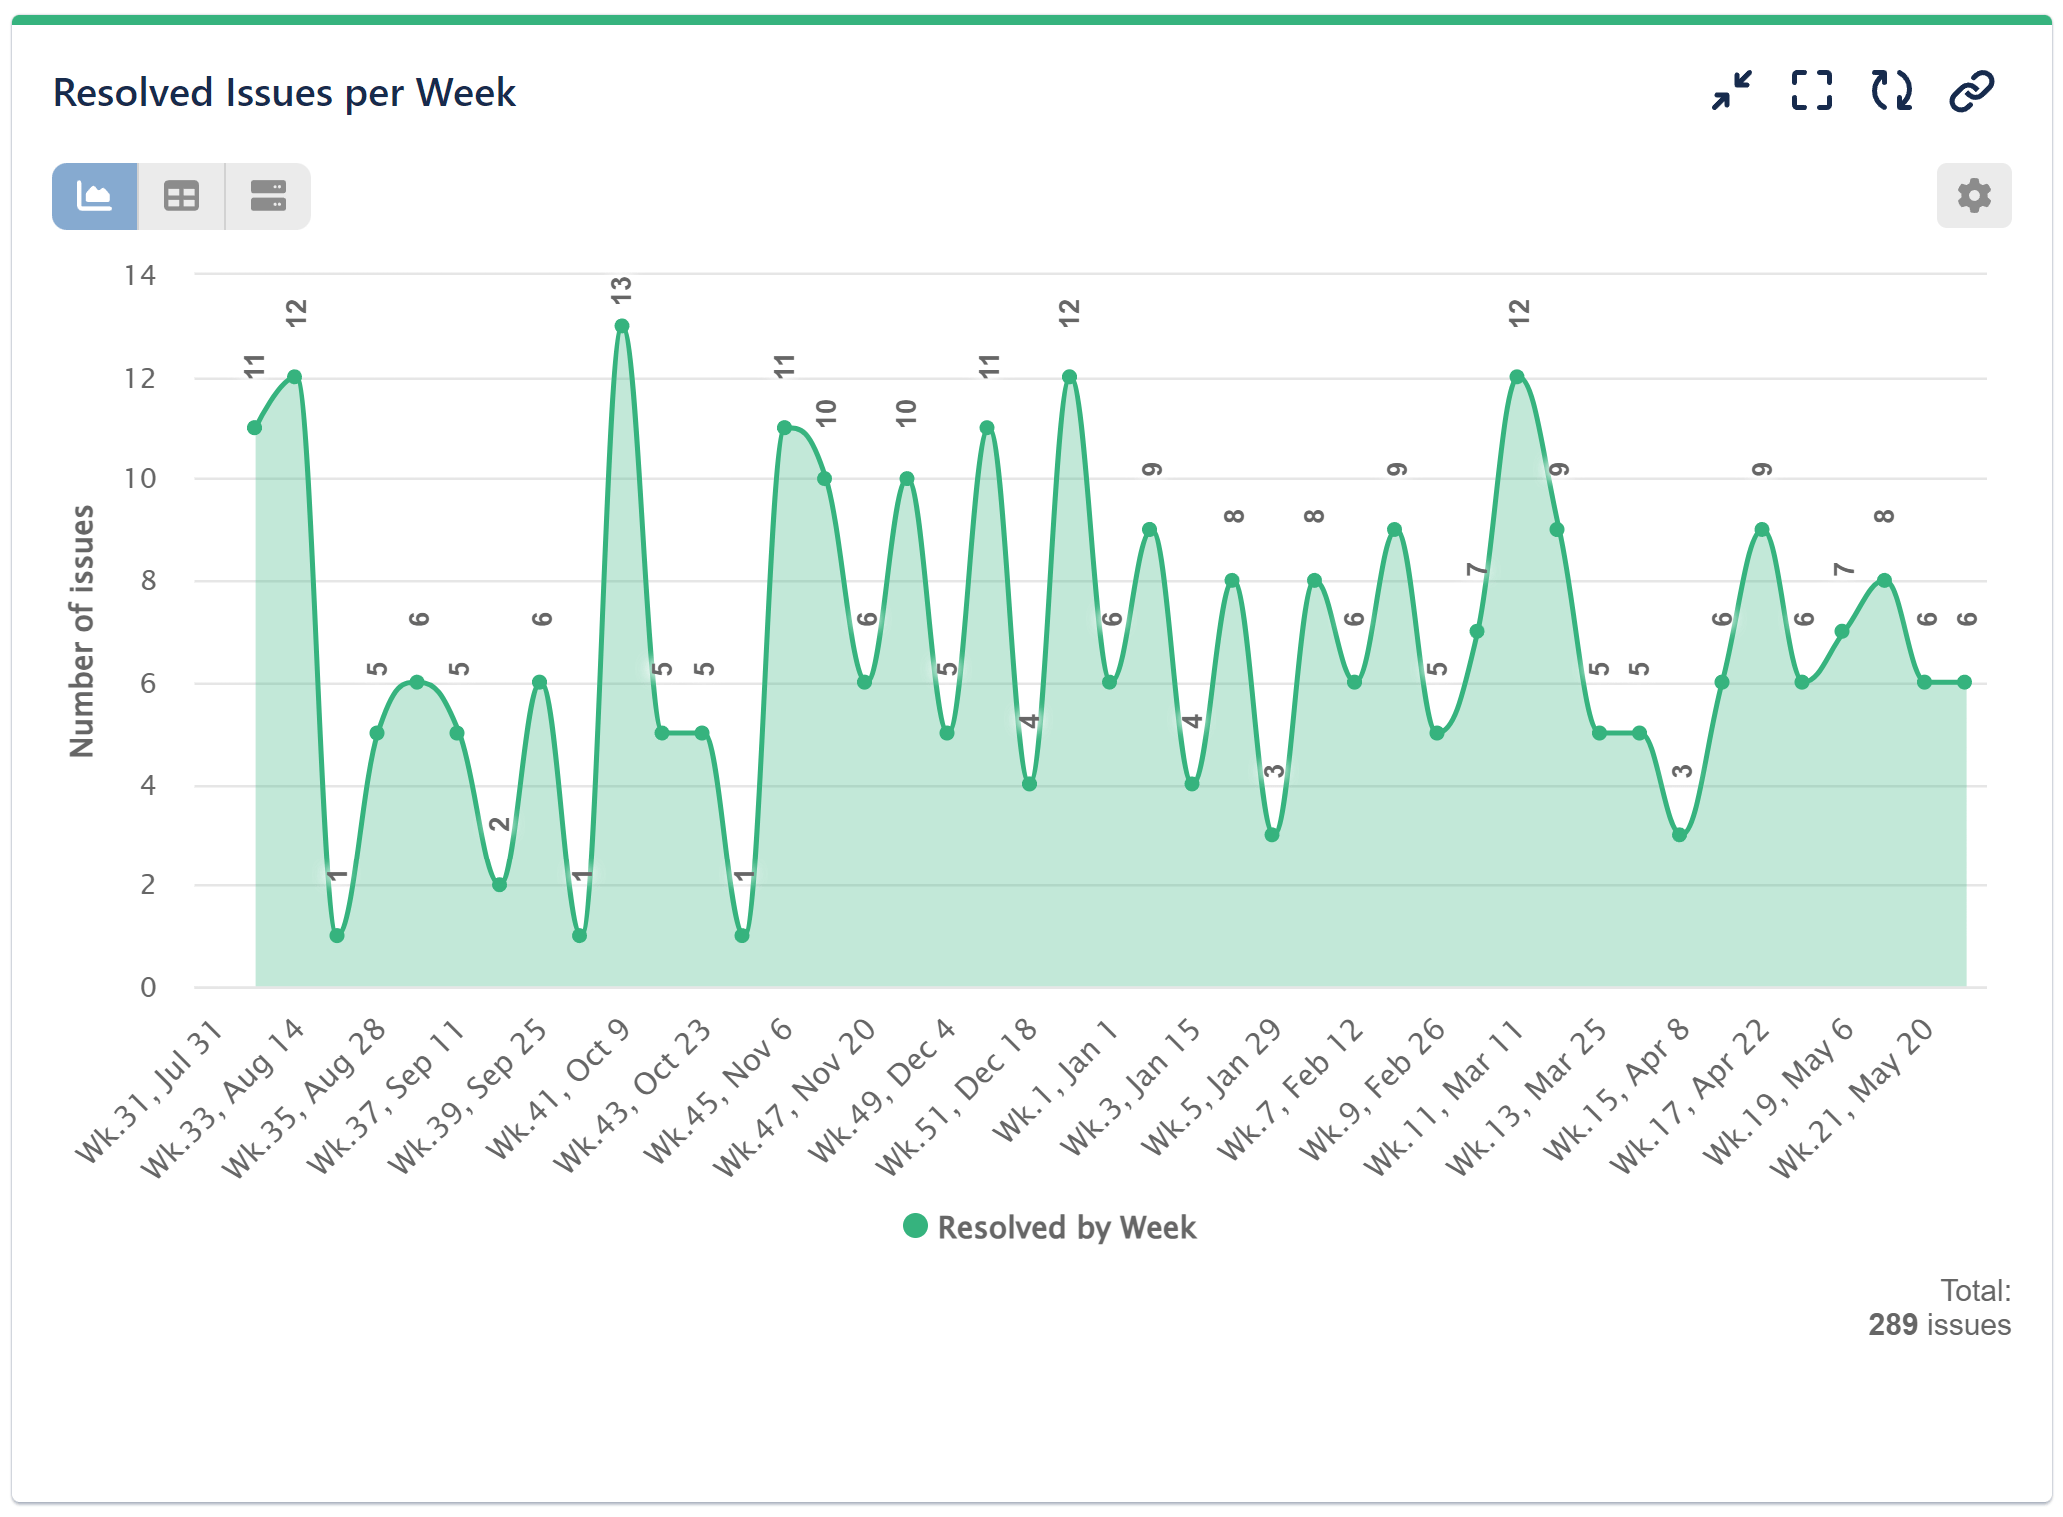
the raw weekly sum of resolved issues
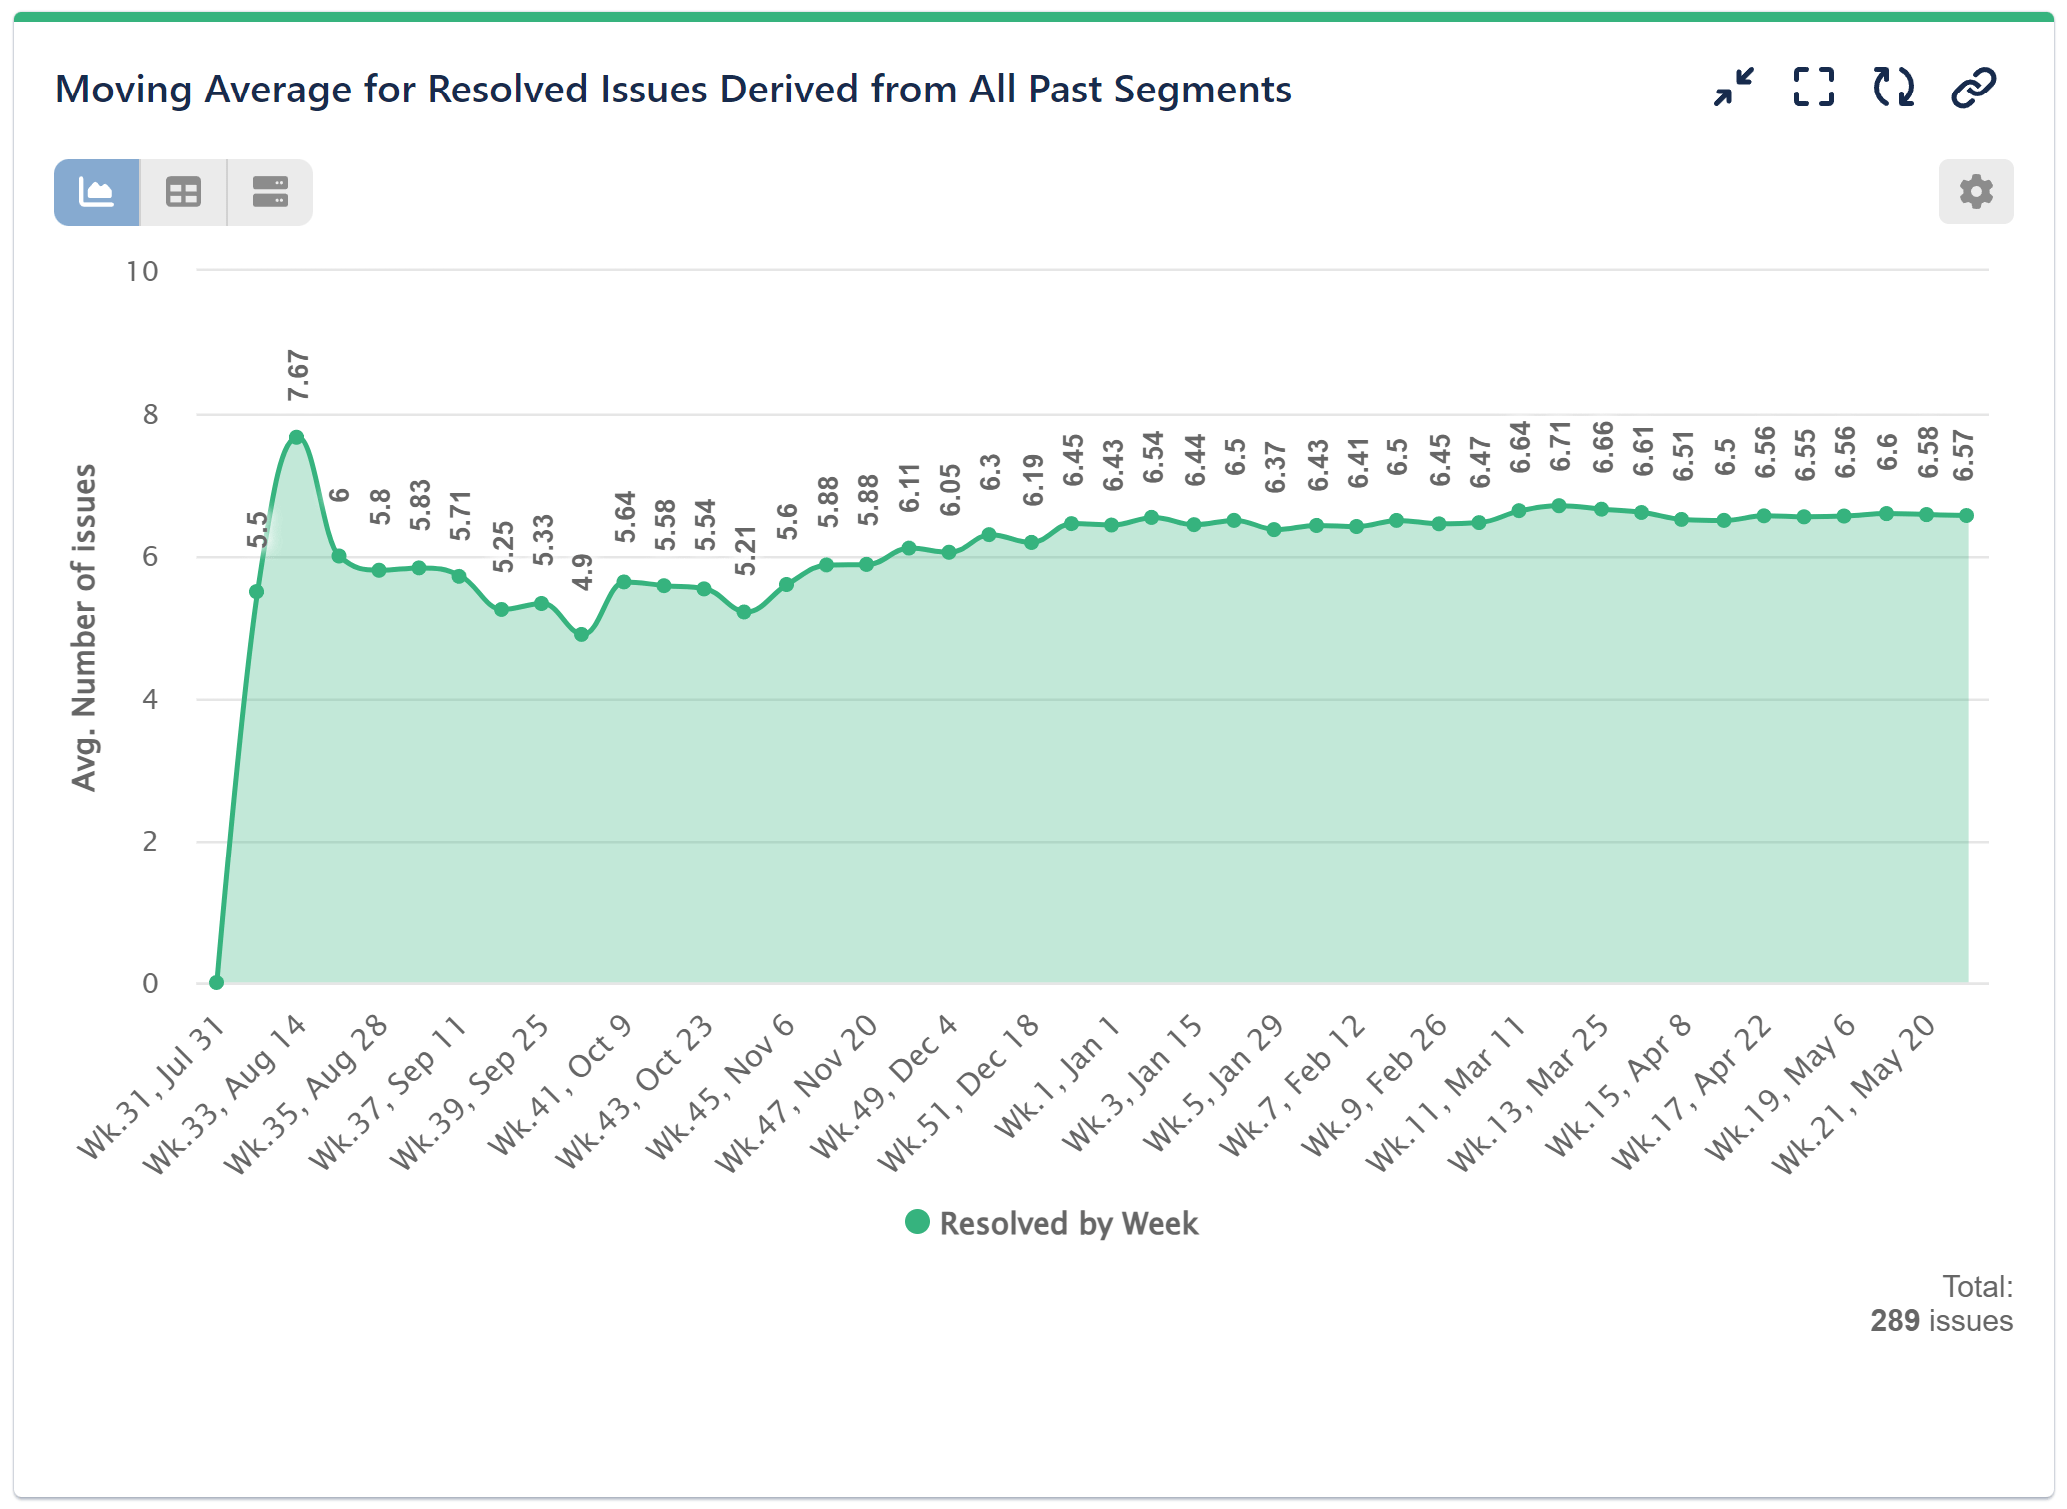
the rolling average calculated from all preceding data segments
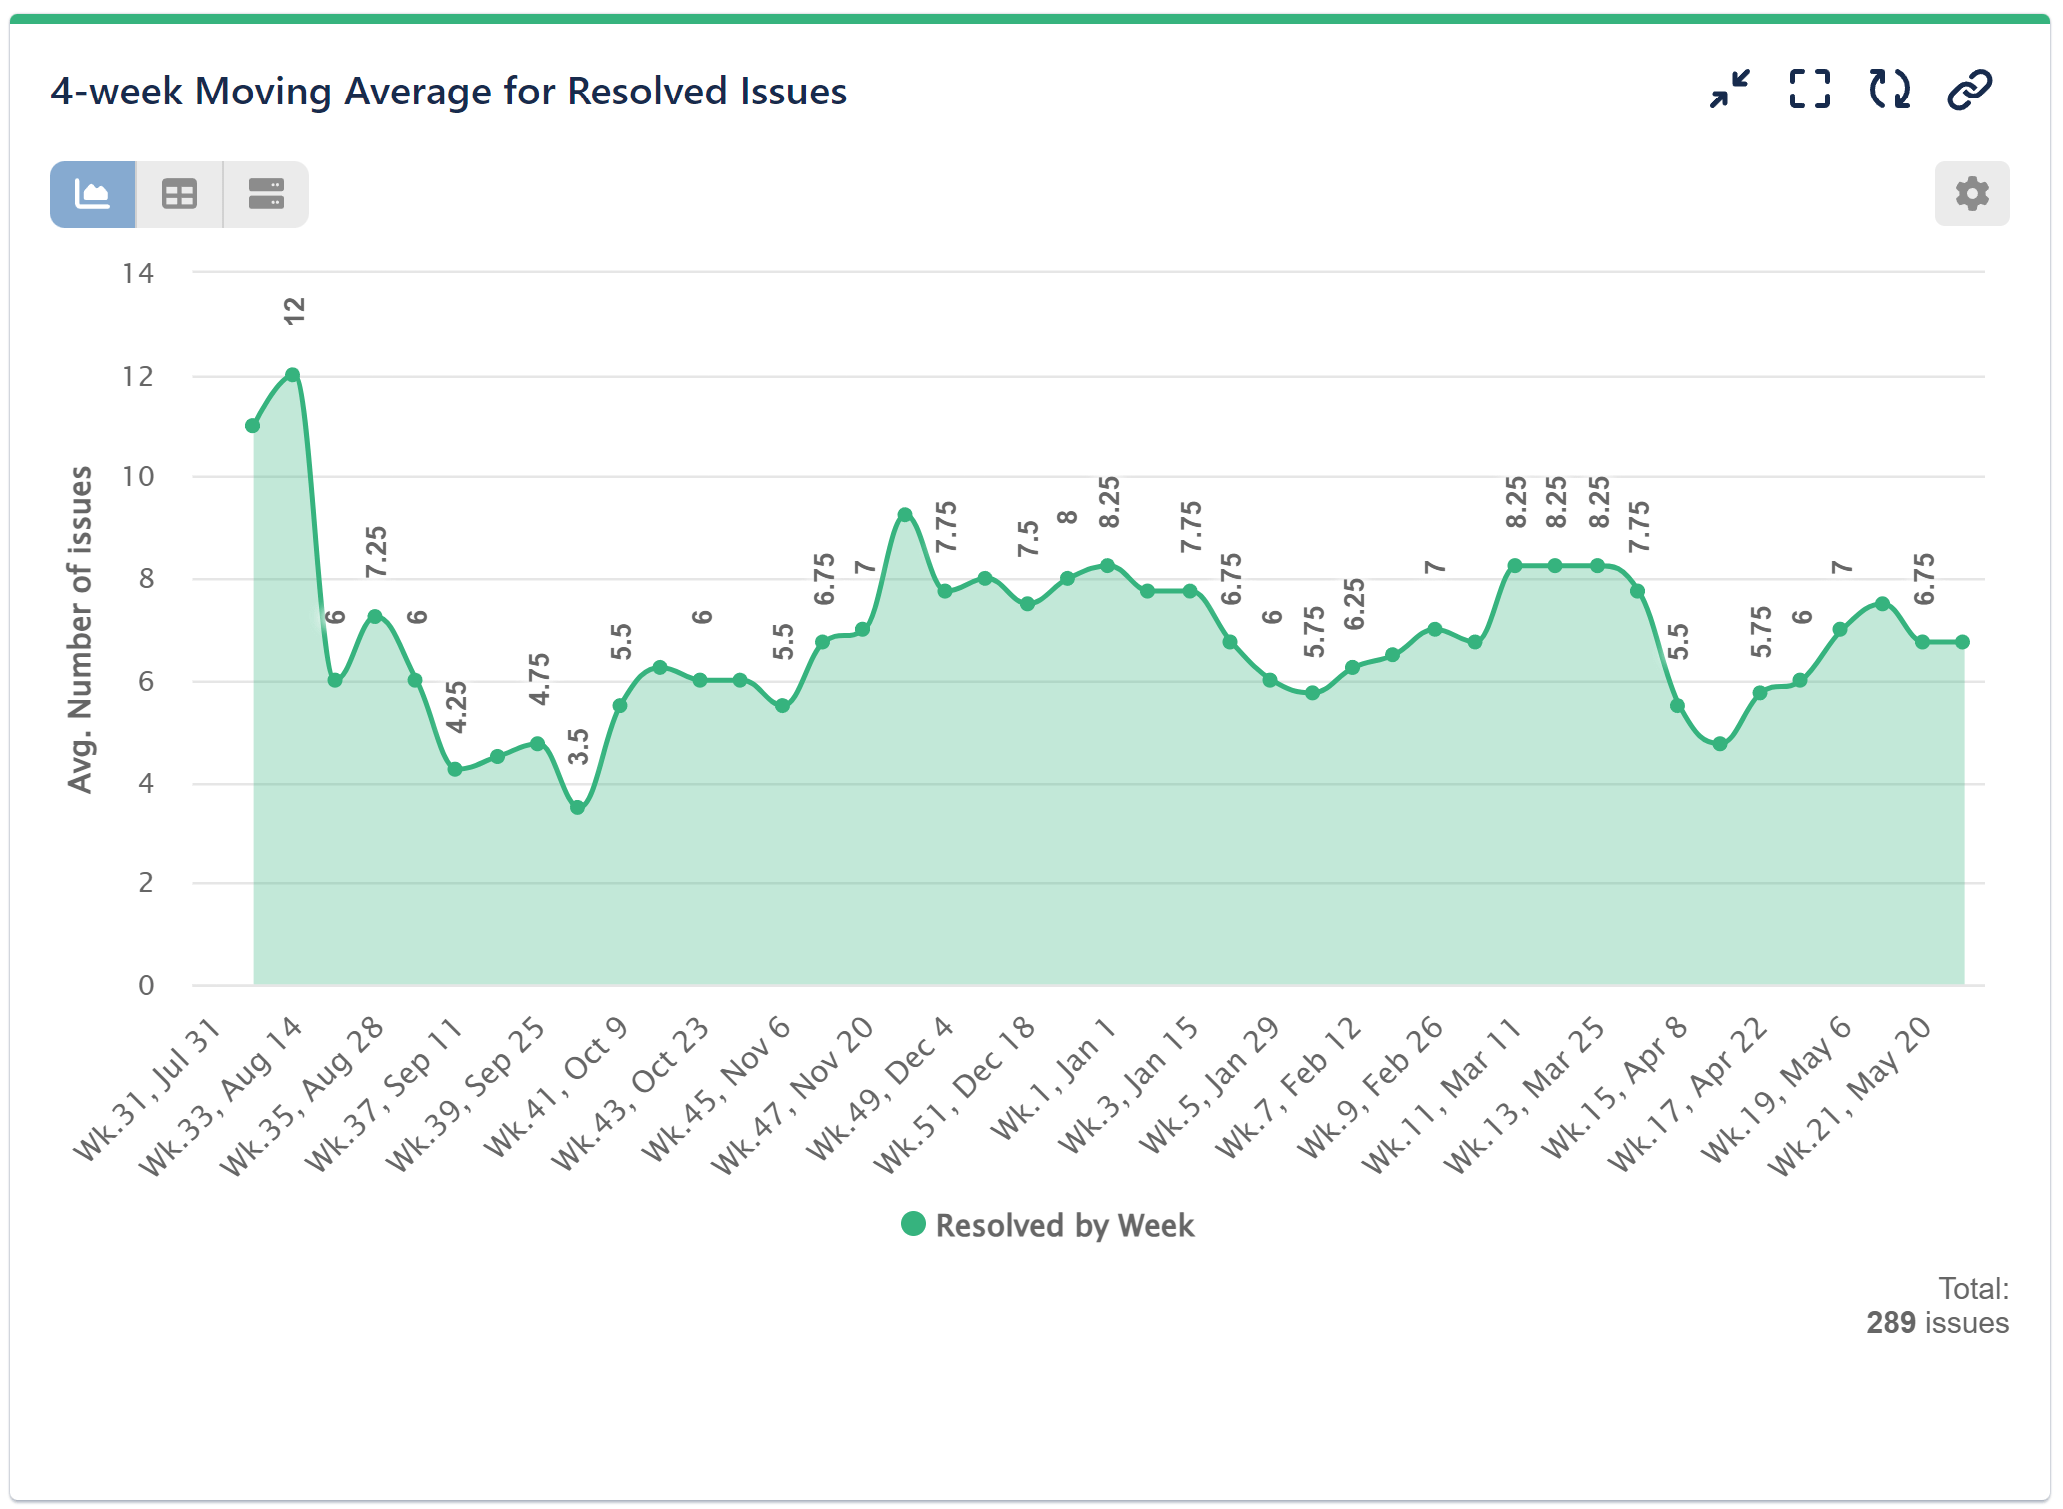
a more focused MA based on the last four data segments
These charts illustrate how MAs provide a clearer and more consistent view of performance over time, highlighting patterns that might otherwise be obscured by short-term volatility. Through this approach, we gain valuable insights into our resolution processes, enabling better decision-making and strategic planning.
Video recording with step by step configuration using Performance Objectives Dashboard gadget:
Other similar reports to build utilizing MA feature are:
- 5 Sprint Moving average velocity per sprint
- 6 week MA Resolved issues per week, etc.
MA calculation is also available as a target calculation with Performance Objectives app.
Read more under: Moving Average as Target
If you need further help with configuring your reports and KPIs, contact our Support team.
Start your 30 days free trial of Performance Objectives: Charts for Jira from Atlassian Marketplace.