Performance Objectives: Charts for Jira offers a wide range of dynamic metrics and fields, taking your Jira reporting to the next level. Among the numerous supported metrics is ‘Remaining Time to Due Date‘. This powerful metric is compatible with almost all app gadgets, enabling you to track and visualize the time remaining to any Jira date field. You can use this estimation for accuracy assessment or as data to support project planning.
Track remaining time between Now and Due Date
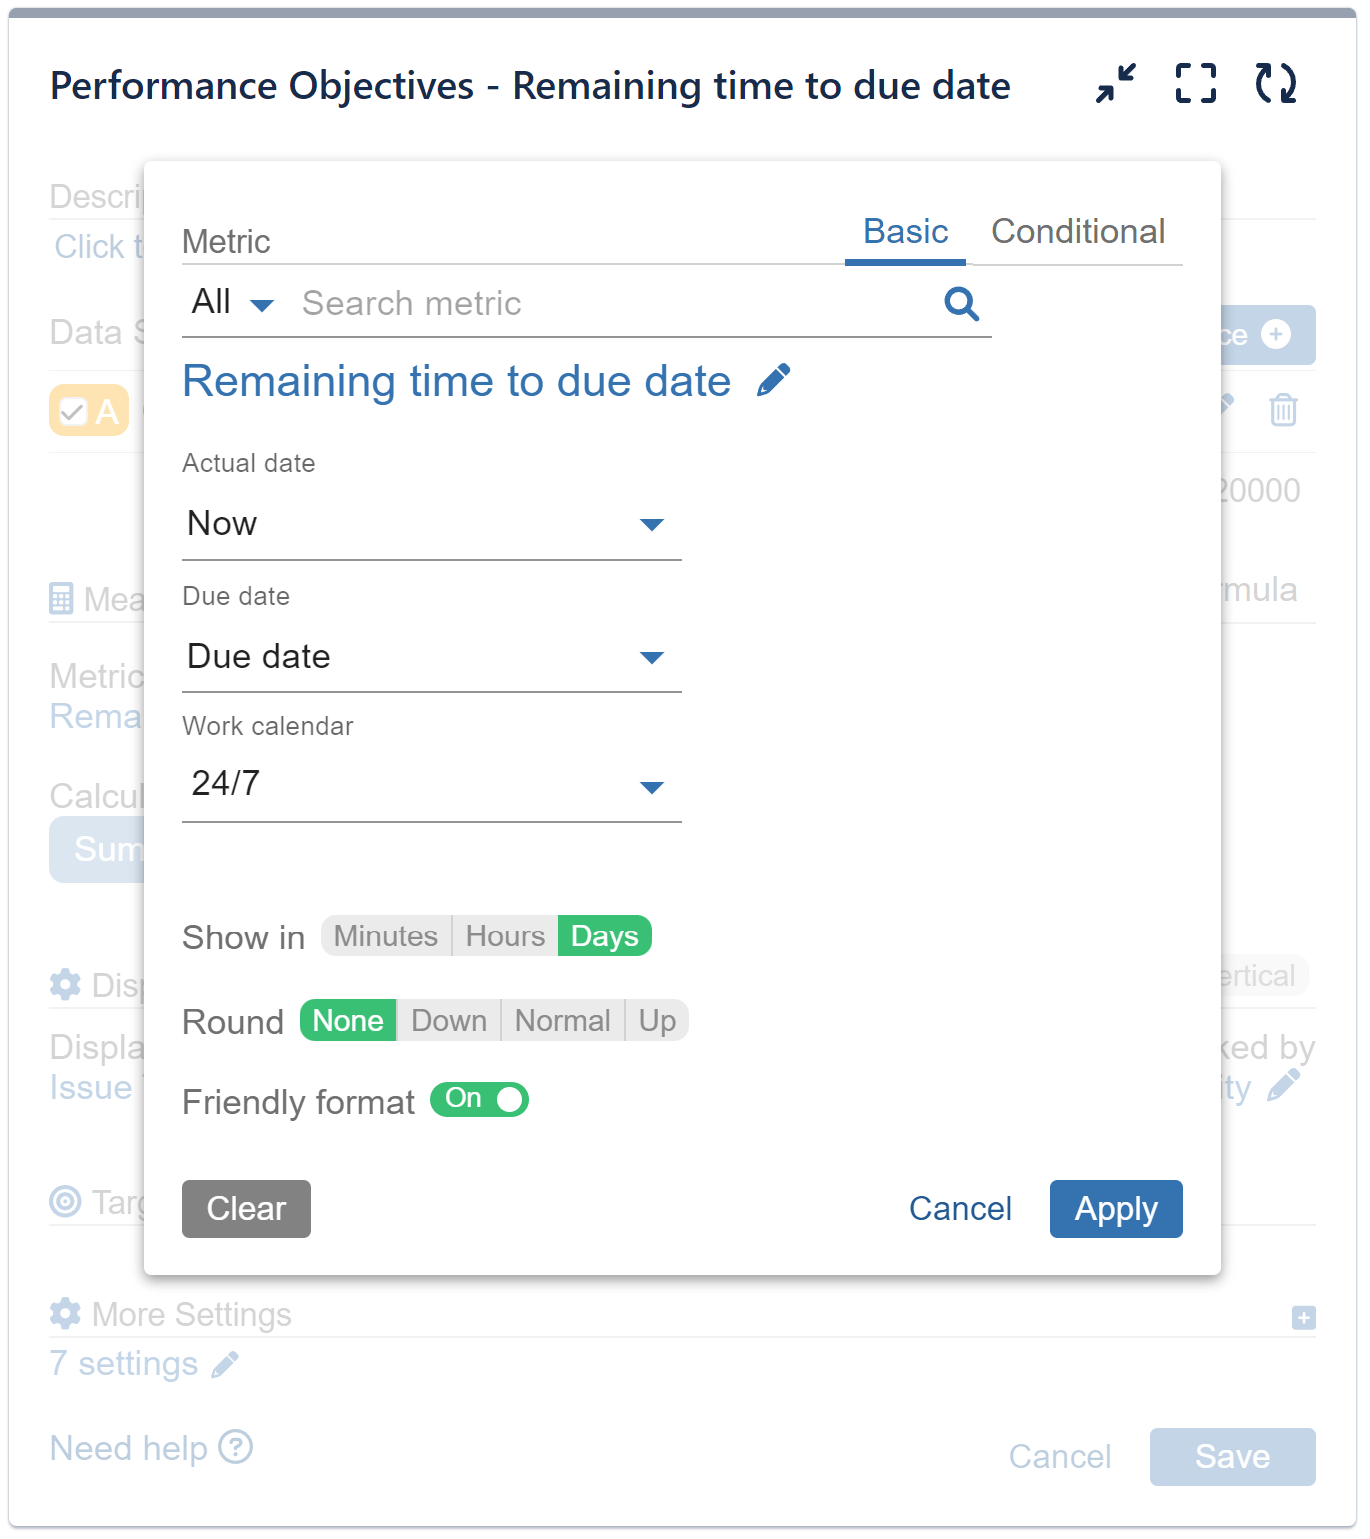
Once selected, ‘Remaining Time to Due Date‘ metric allows you to select any Jira date field as actual and due date, including “Now” as shown on the screen below:
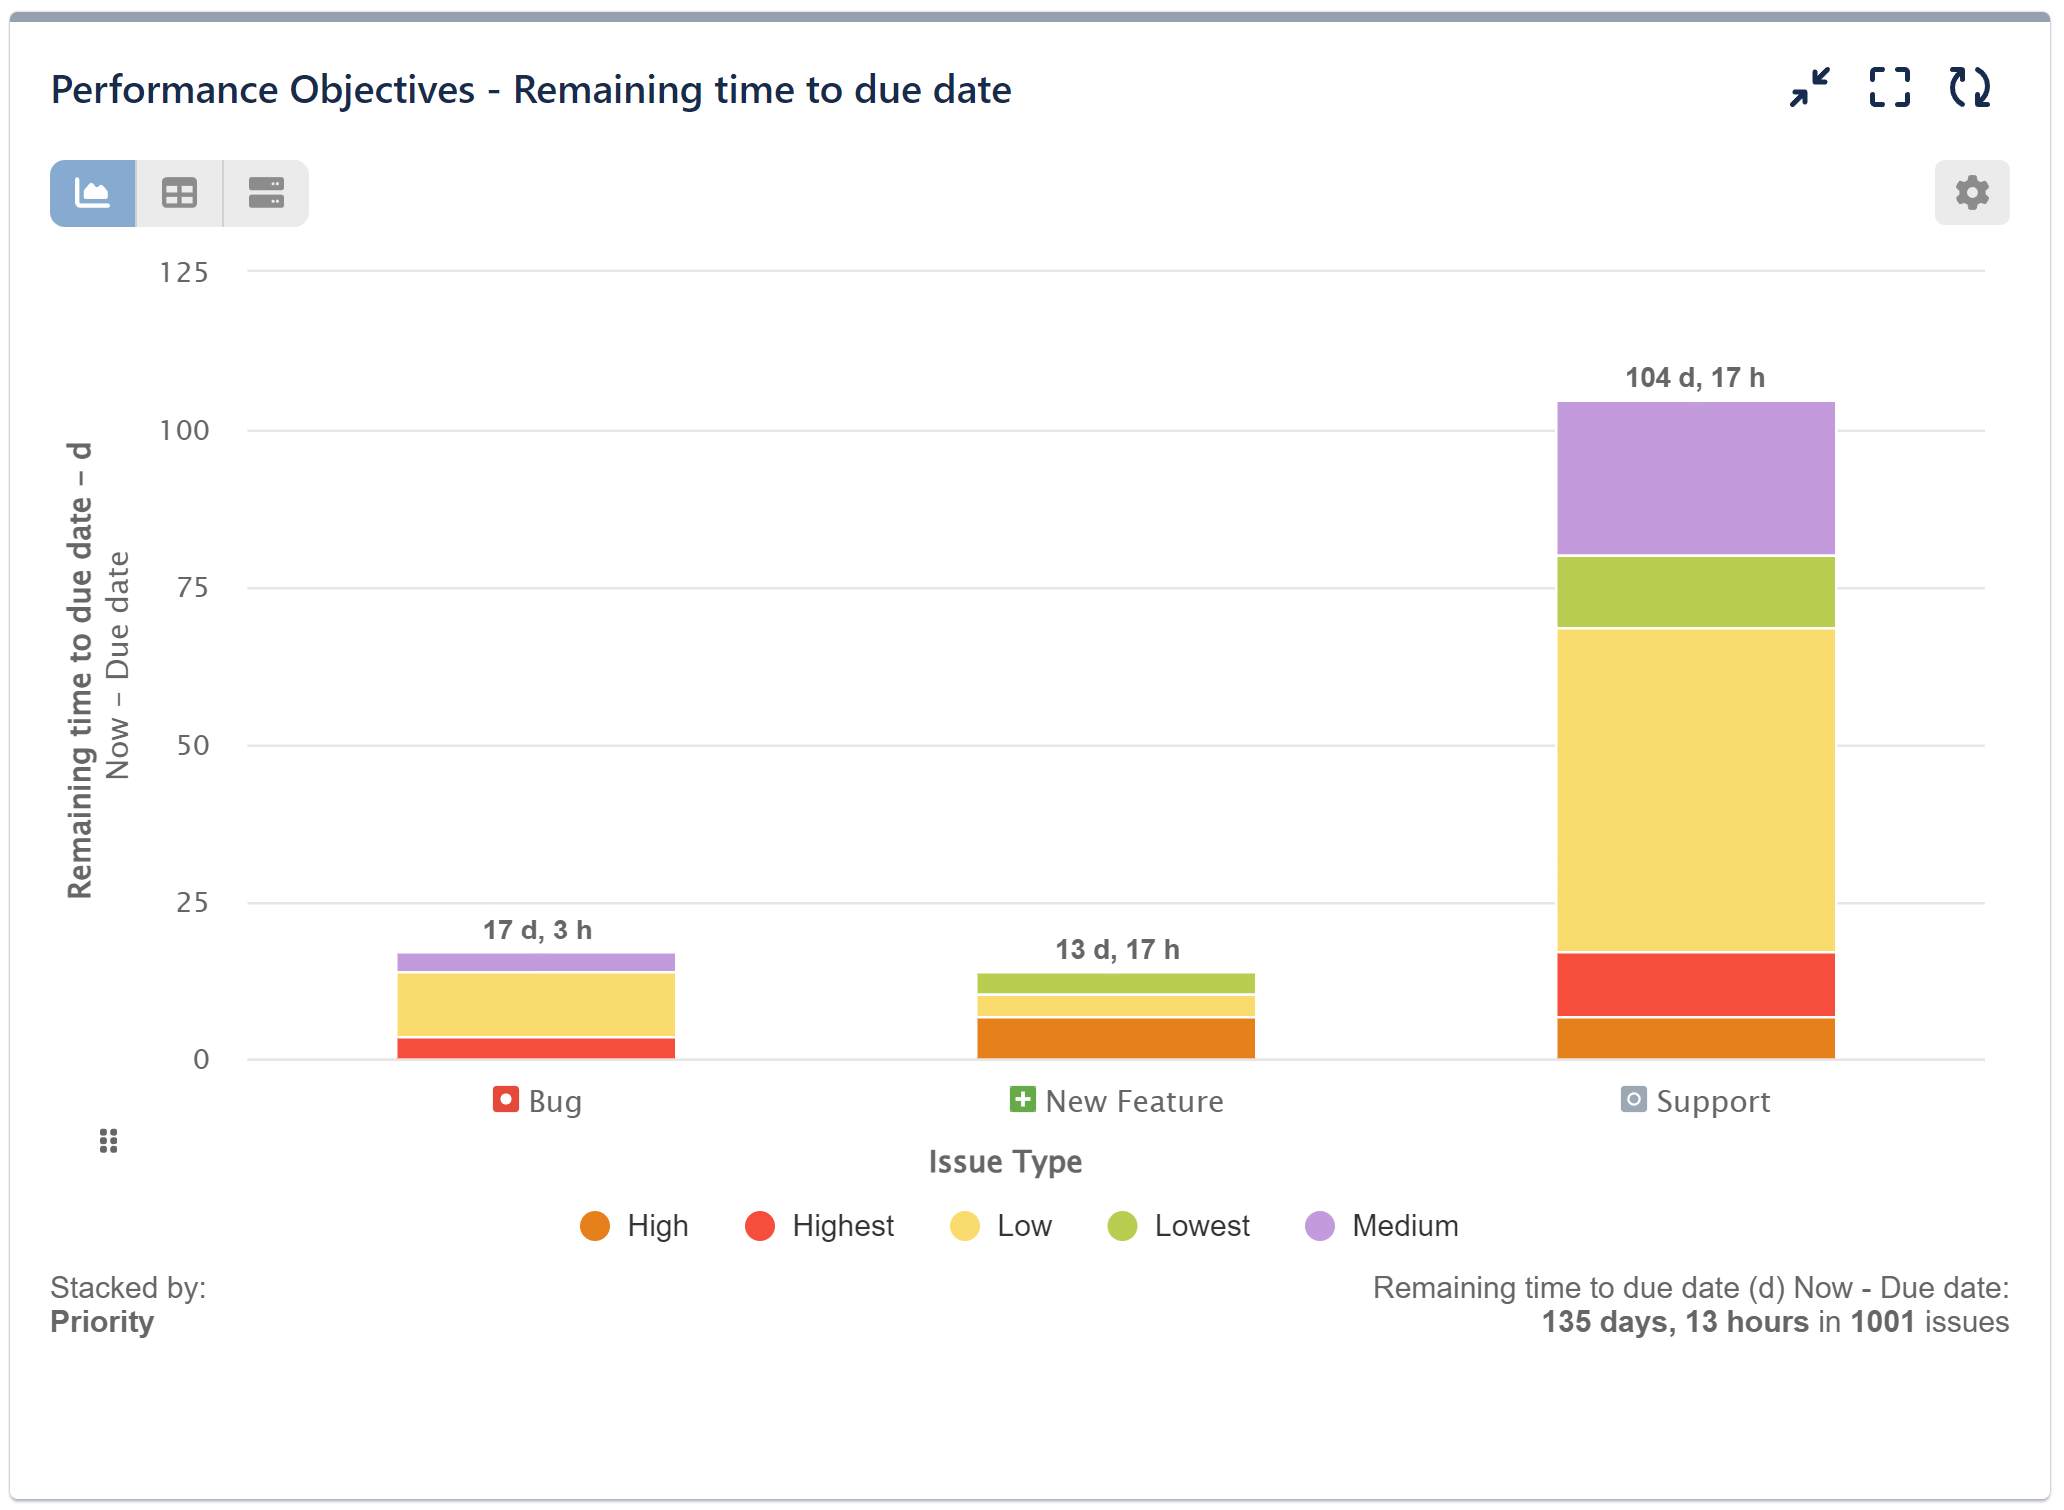
This chart shows the remaining time between the current date and the due date (in days, but may be in hours or minutes) of different issue types, stacked by priority, provides a comprehensive view of issue status and helps optimize workflow efficiency for timely and effective issue resolution. Additionally, it is highly useful for capacity planning, as it enables better resource allocation by identifying the urgency of issues and their respective priorities, allowing teams to allocate resources effectively and ensure that the workload is balanced based on the time-sensitive nature of the issues.
Please note the specific metric’s behavior related to comparing two date fields: the “actual date” and the “due date.”
‘Remaining time to due date’ metric is designed to evaluate cases where the “actual date” (in our use case above, it is Now) occurs before the “due date.” In such instances, the metric will calculate a value based on the time difference between the two dates. However, if the “actual date” happens to be after the “due date” (resulting in a negative time difference), the chart will display a value of 0.
Please review the configuration screen for the chart displayed above:
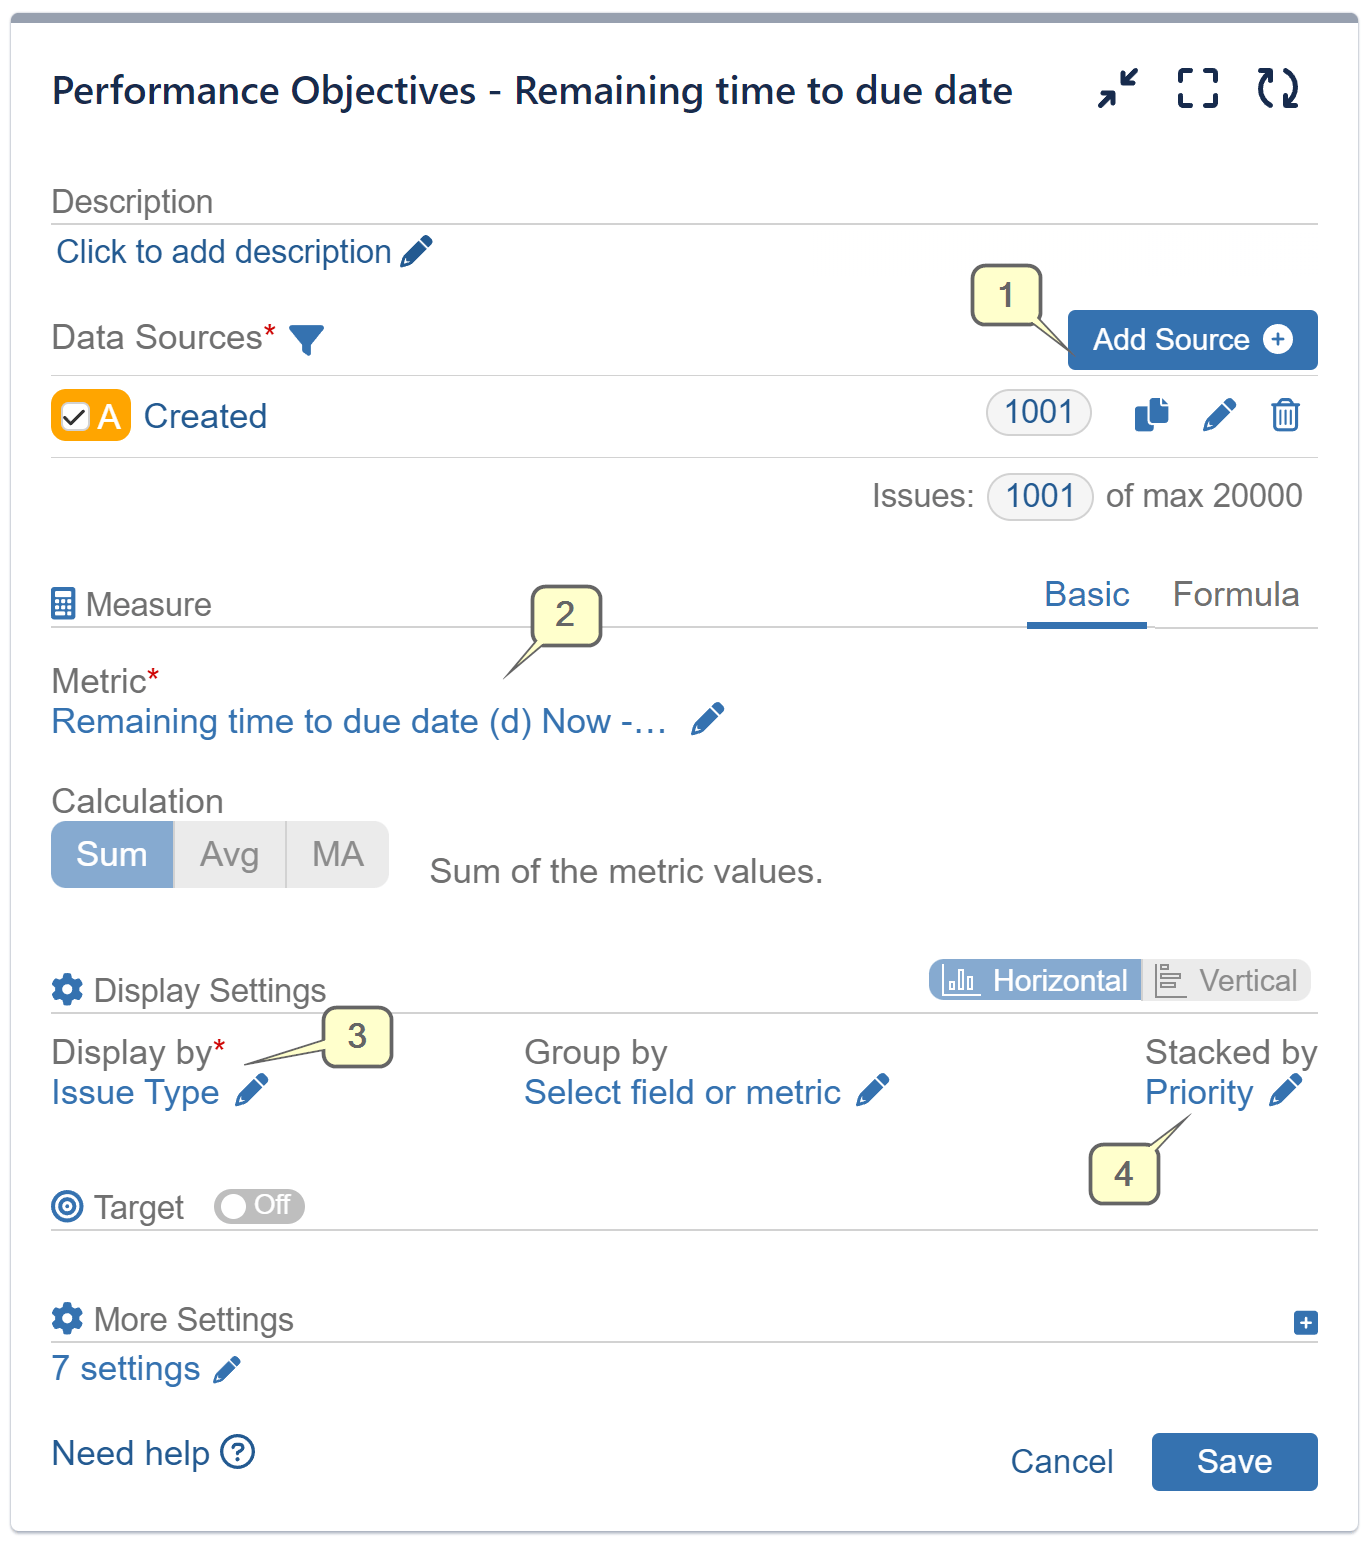
Step 1: Choose the data source/s you wish to analyze.
Step 2: Select the ‘Remaining time to due date’ metric and choose Now for “actual date” and Due date for “due date”
Step 3: Configure ‘Display by’ with the ‘Issue type’ field.
Step 4: Configure ‘Stacked by’ with the ‘Priority’ field.
You can further customize your chart by displaying the result in Minutes, Hours, or Days. Additionally, you have the option to Round the result or toggle the Friendly format to view an easy to read and grasp form of dates and numbers. These flexible settings allow you to present the data in a way that best suits your reporting and analysis needs.
For a comprehensive list of metrics and fields supported by the app, please refer to Configuration Overview or check the related articles: Number of overdues, Overdue time from date, Time between, Time since, Conditional Metrics.
Start your 30 days free trial of Performance Objectives: Charts for Jira from Atlassian Marketplace.