Performance Objectives: Charts for Jira offers a diverse range of options for data segmentation and display. These features significantly enhance the built-in Atlassian charting and reporting capabilities, empowering you to generate more insightful reports based of Jira data.
You can easily segment and visualize your data using the ‘by Date Index‘ option, which is supported by both the Performance Objectives and Performance Trend gadgets. This option is available for selecting the ‘Display by’ criteria for any date type field. It proves useful for comparing data from different periods side by side or setting period-over-period improvement goals.
Effortless Period over Period Analysis with ‘by Date Index’
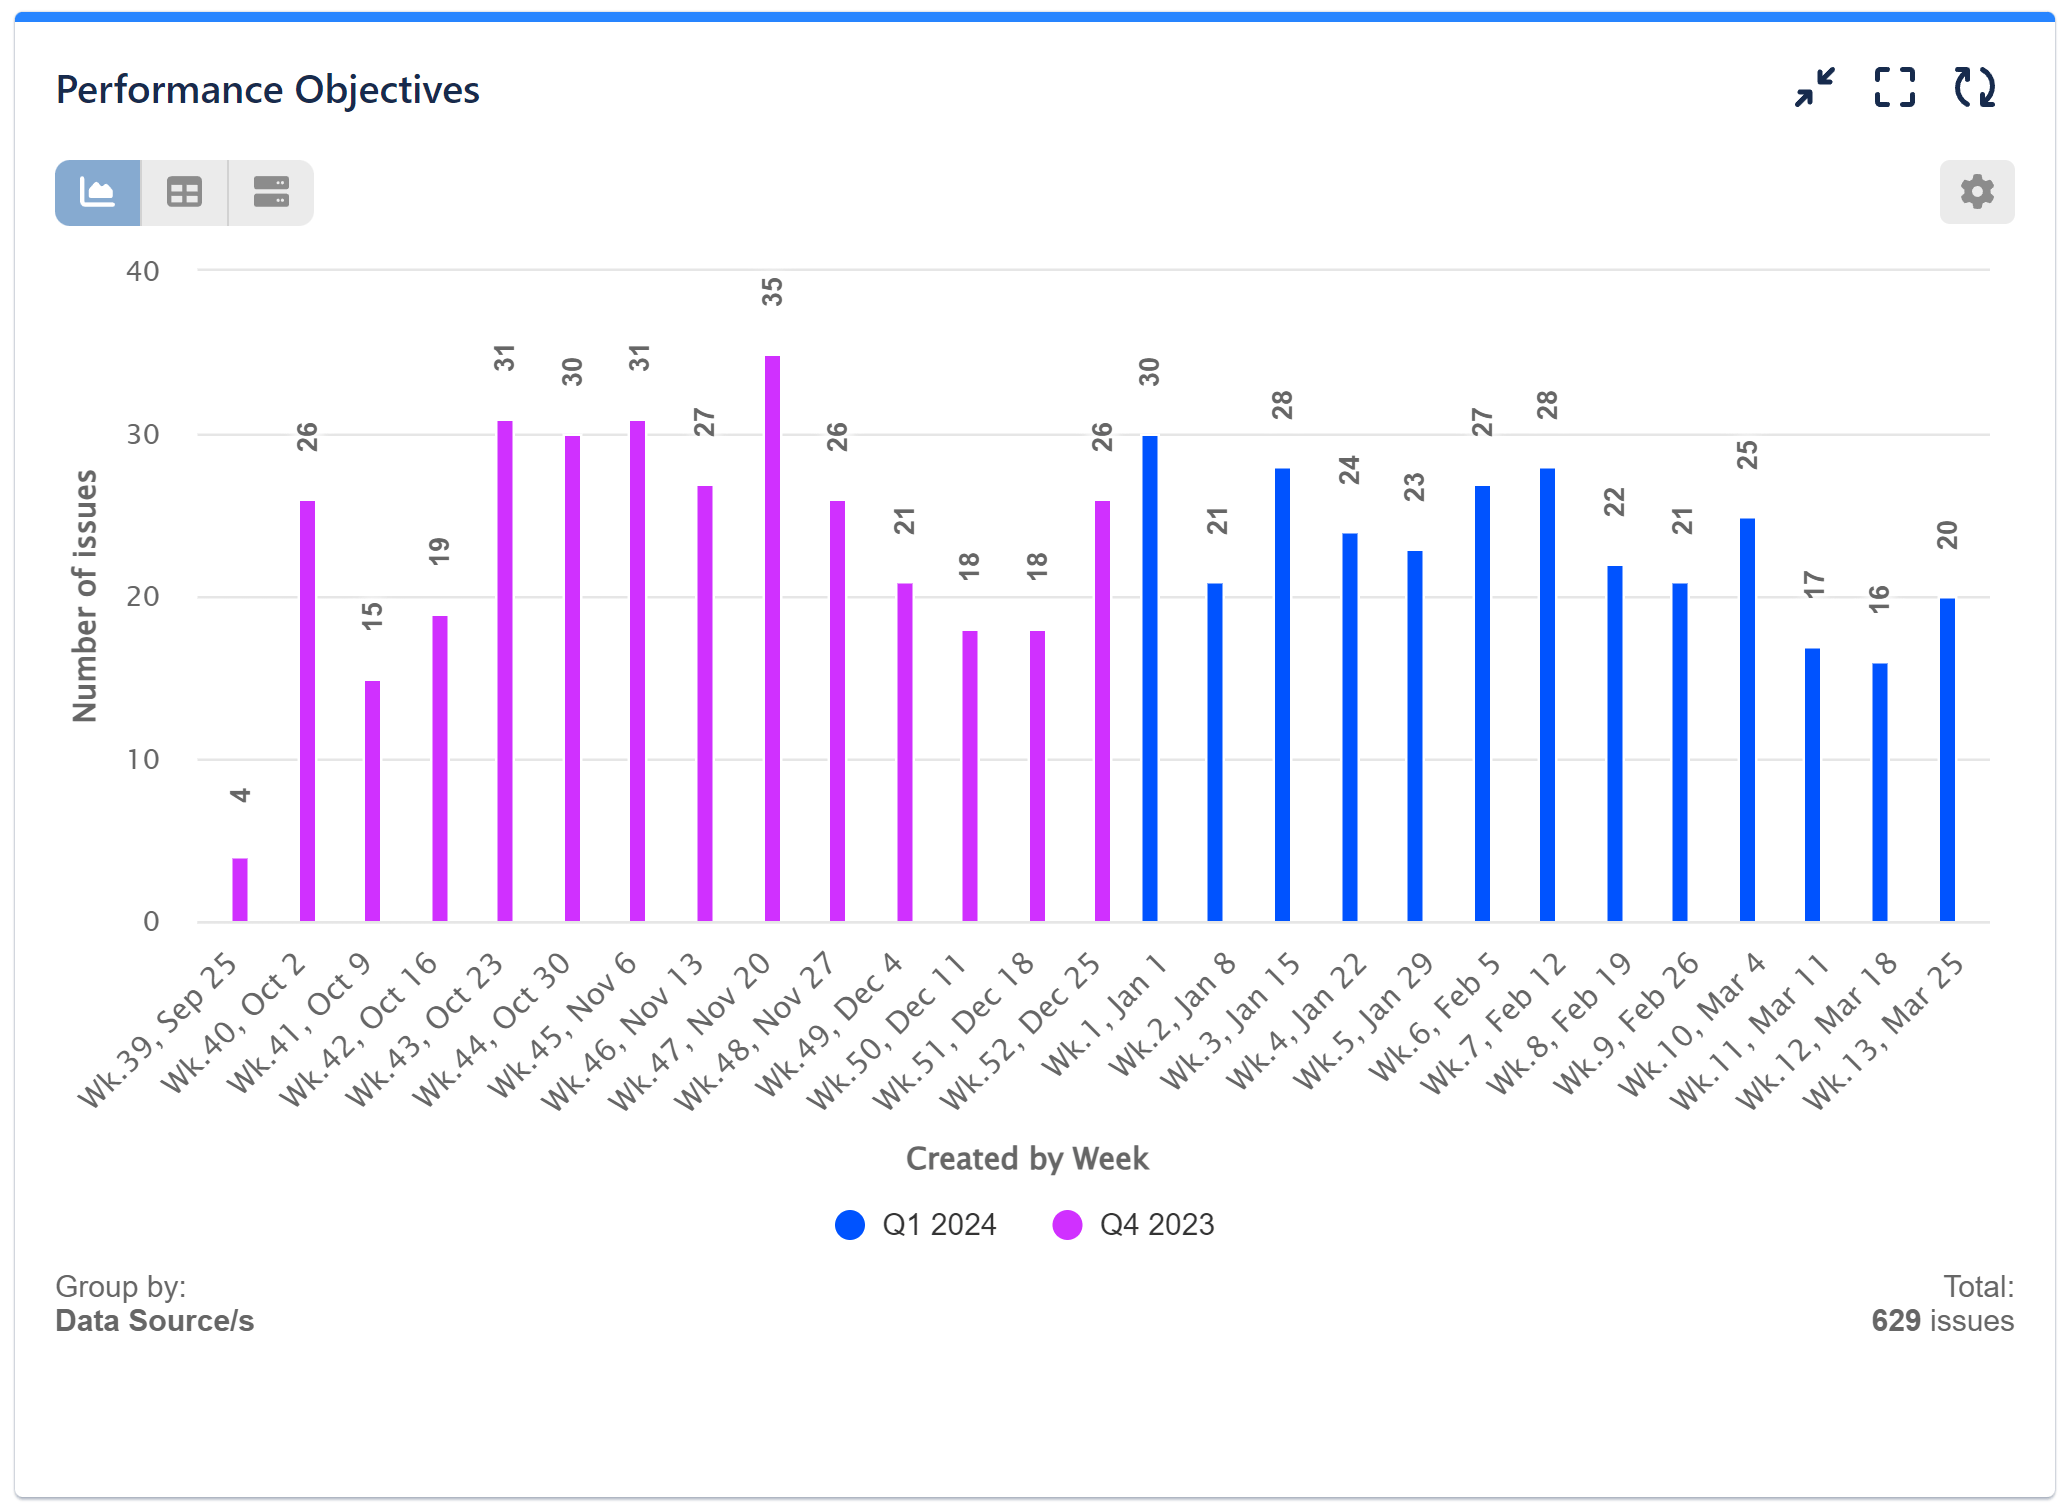
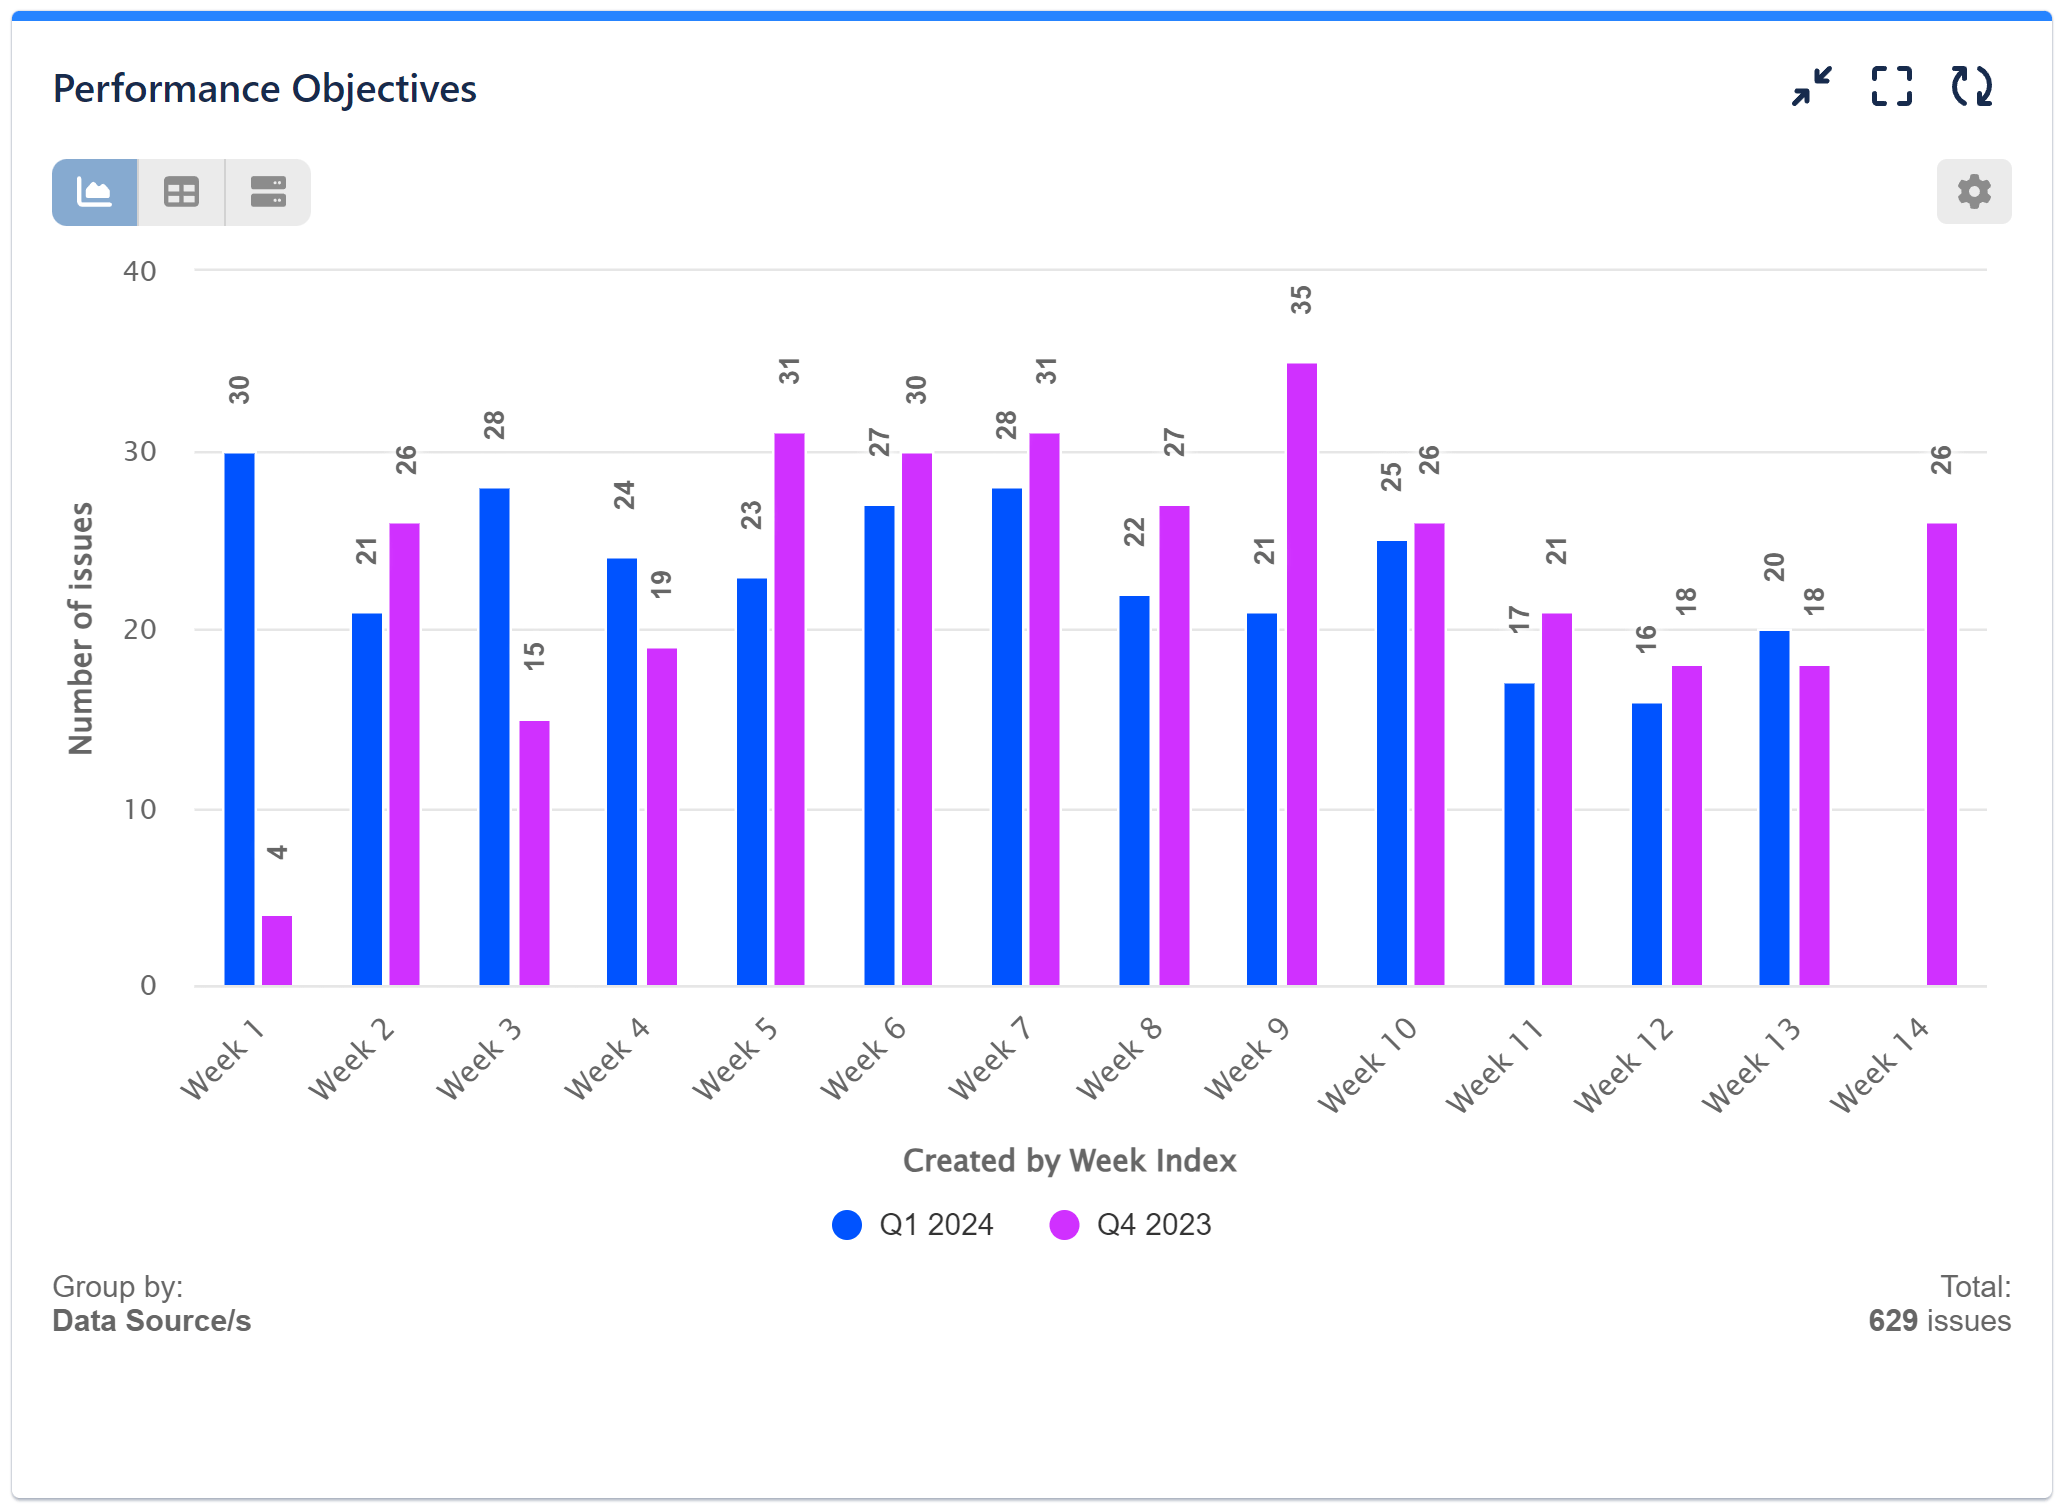
Let’s observe the difference in visualized data when the ‘by Date Index‘ feature is enabled. In this sample visualization, we compare the issues created in the previous quarter to those created in the current quarter. To enhance the chart’s clarity, we have chosen both data sources for the “group by” display option. Additionally, we utilize the “show weeks by index” feature in the “display by” section, simplifying the final appearance and ensuring easy distinction of week-by-week data within the defined period.
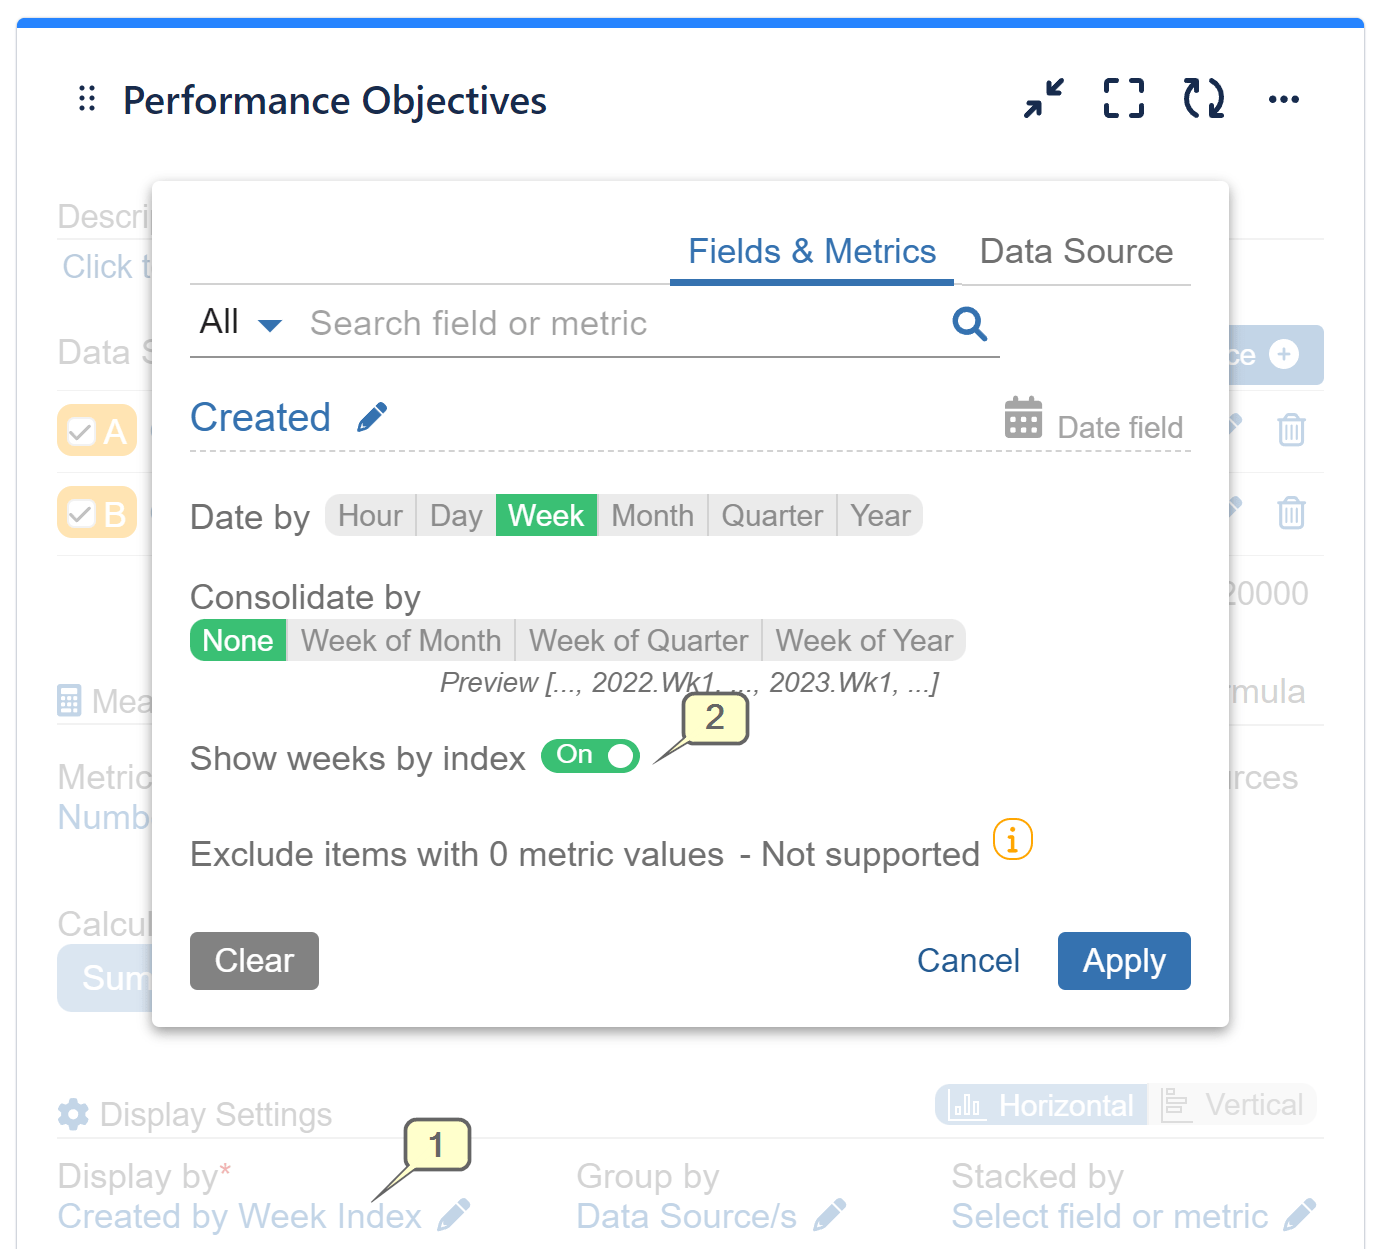
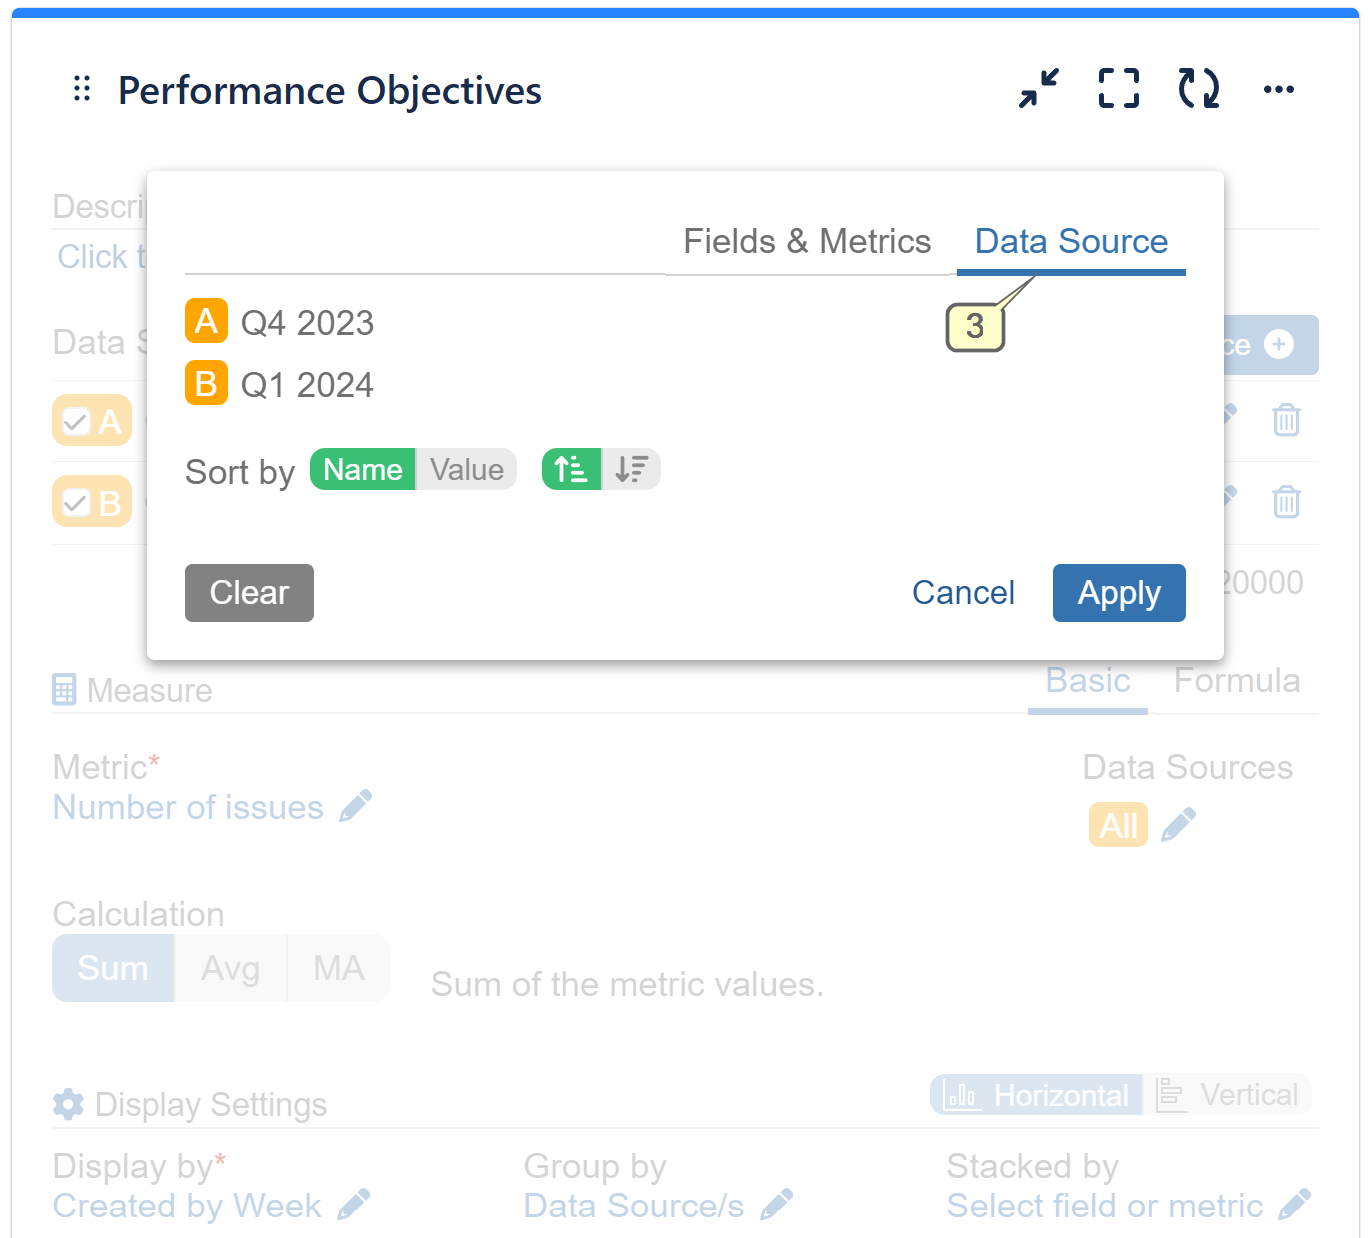
Here’s the settings screen, displaying the location of the feature:
For a comprehensive list of different field types supported by the app, please refer to our Configuration Overview.
For further information and deeper insights into the various configuration options available, we recommend exploring our User guide.
Start your 30 days free trial of Performance Objectives: Charts for Jira from Atlassian Marketplace.