Table of Contents
Teams worldwide rely on Jira Service Management (JSM) as their IT Service Management solution (ITSM) and encounter the need to closely monitor their Service Level Agreements (SLAs) for the most insightful perspective over the service they provide.
In this article, we will show you how to supercharge your Jira SLA reporting with the Performance Objectives: Charts for Jira app. Discover JSM SLA metrics within the app’s supported dashboard gadgets, including ‘Performance Objectives,’ ‘Performance Trend,’ ‘Multi Metric Trend,’ ‘Multi Metric Combined,’ and ‘Circular,’ among the ten available.
Standard and Custom Metrics and Fields Supported for JSM SLA Reporting
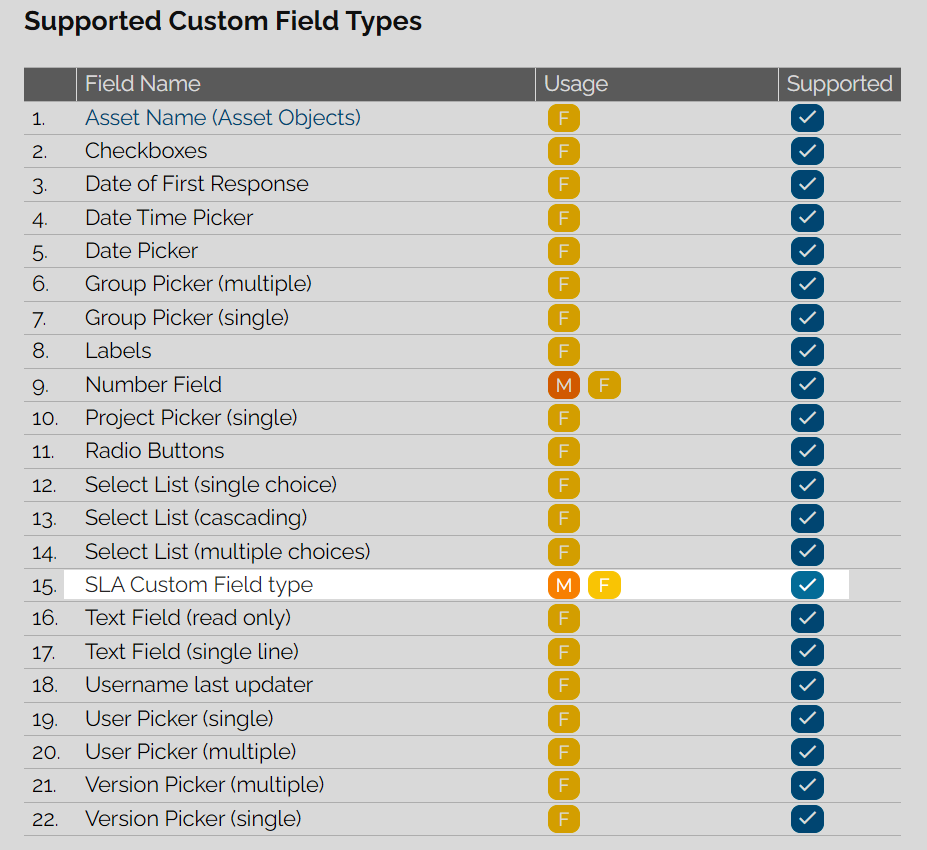
Our app also offers support for the ‘SLA Custom Field Type,’ enabling users to report on all their custom SLAs.
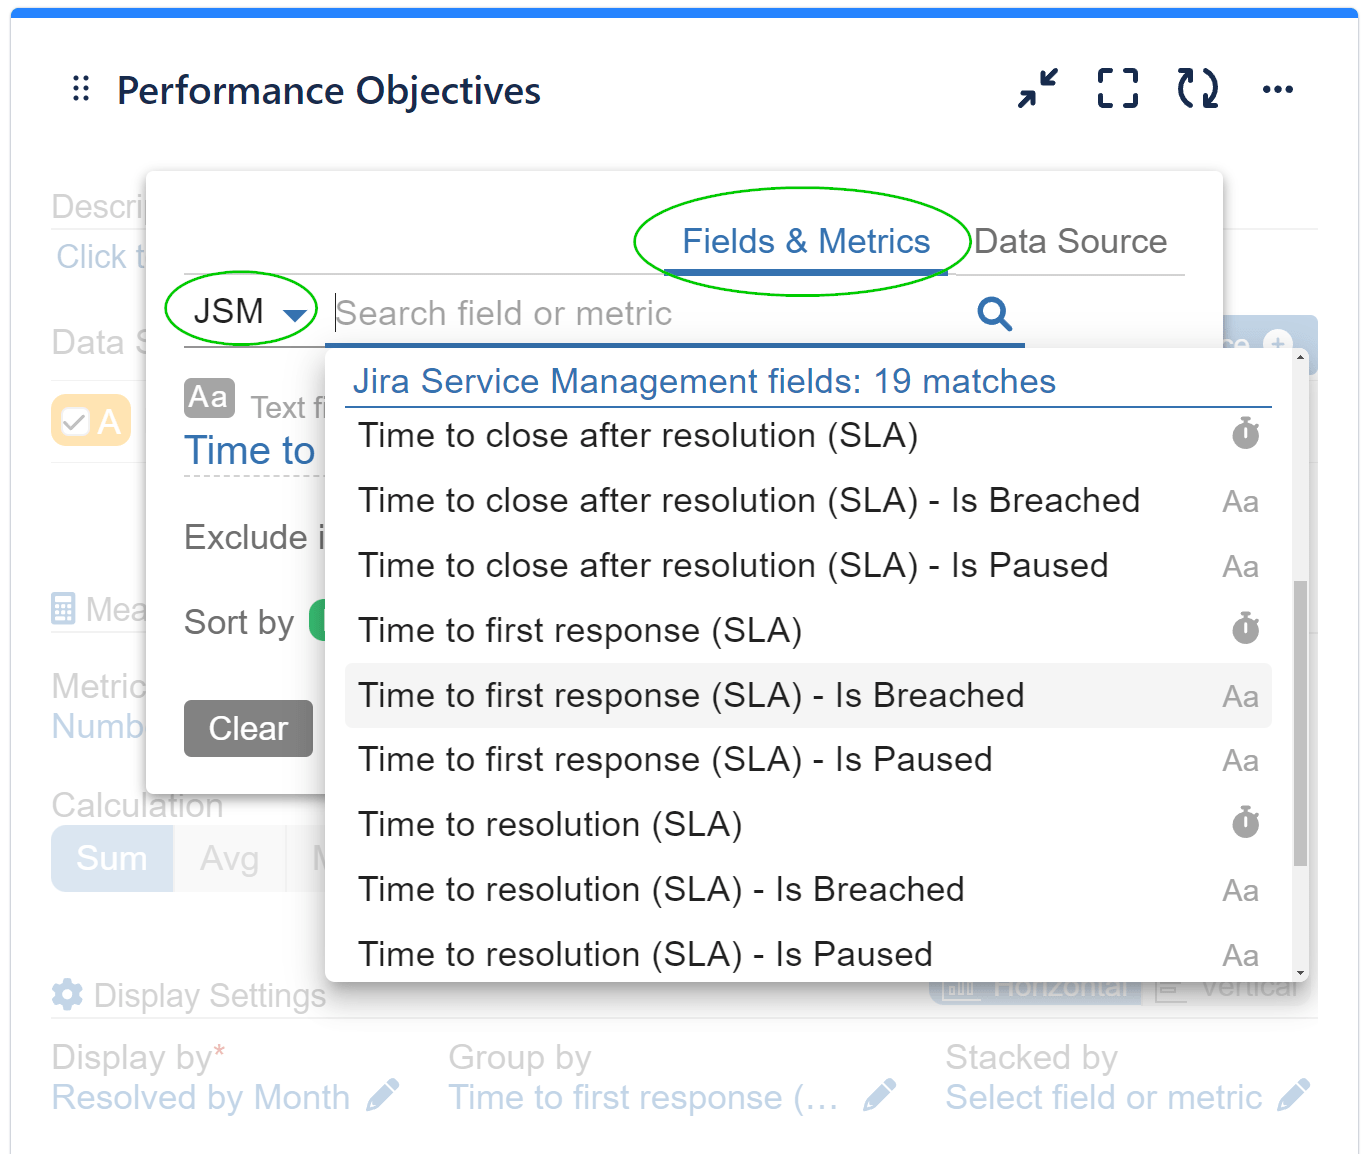
Here’s a list of available metrics and fields within the app to enhance your SLA reports in Jira Service Management:
F
F
F
F
M
F
M
F
M
F
M
F
M
F
M
F
M
F
M
F
F
F
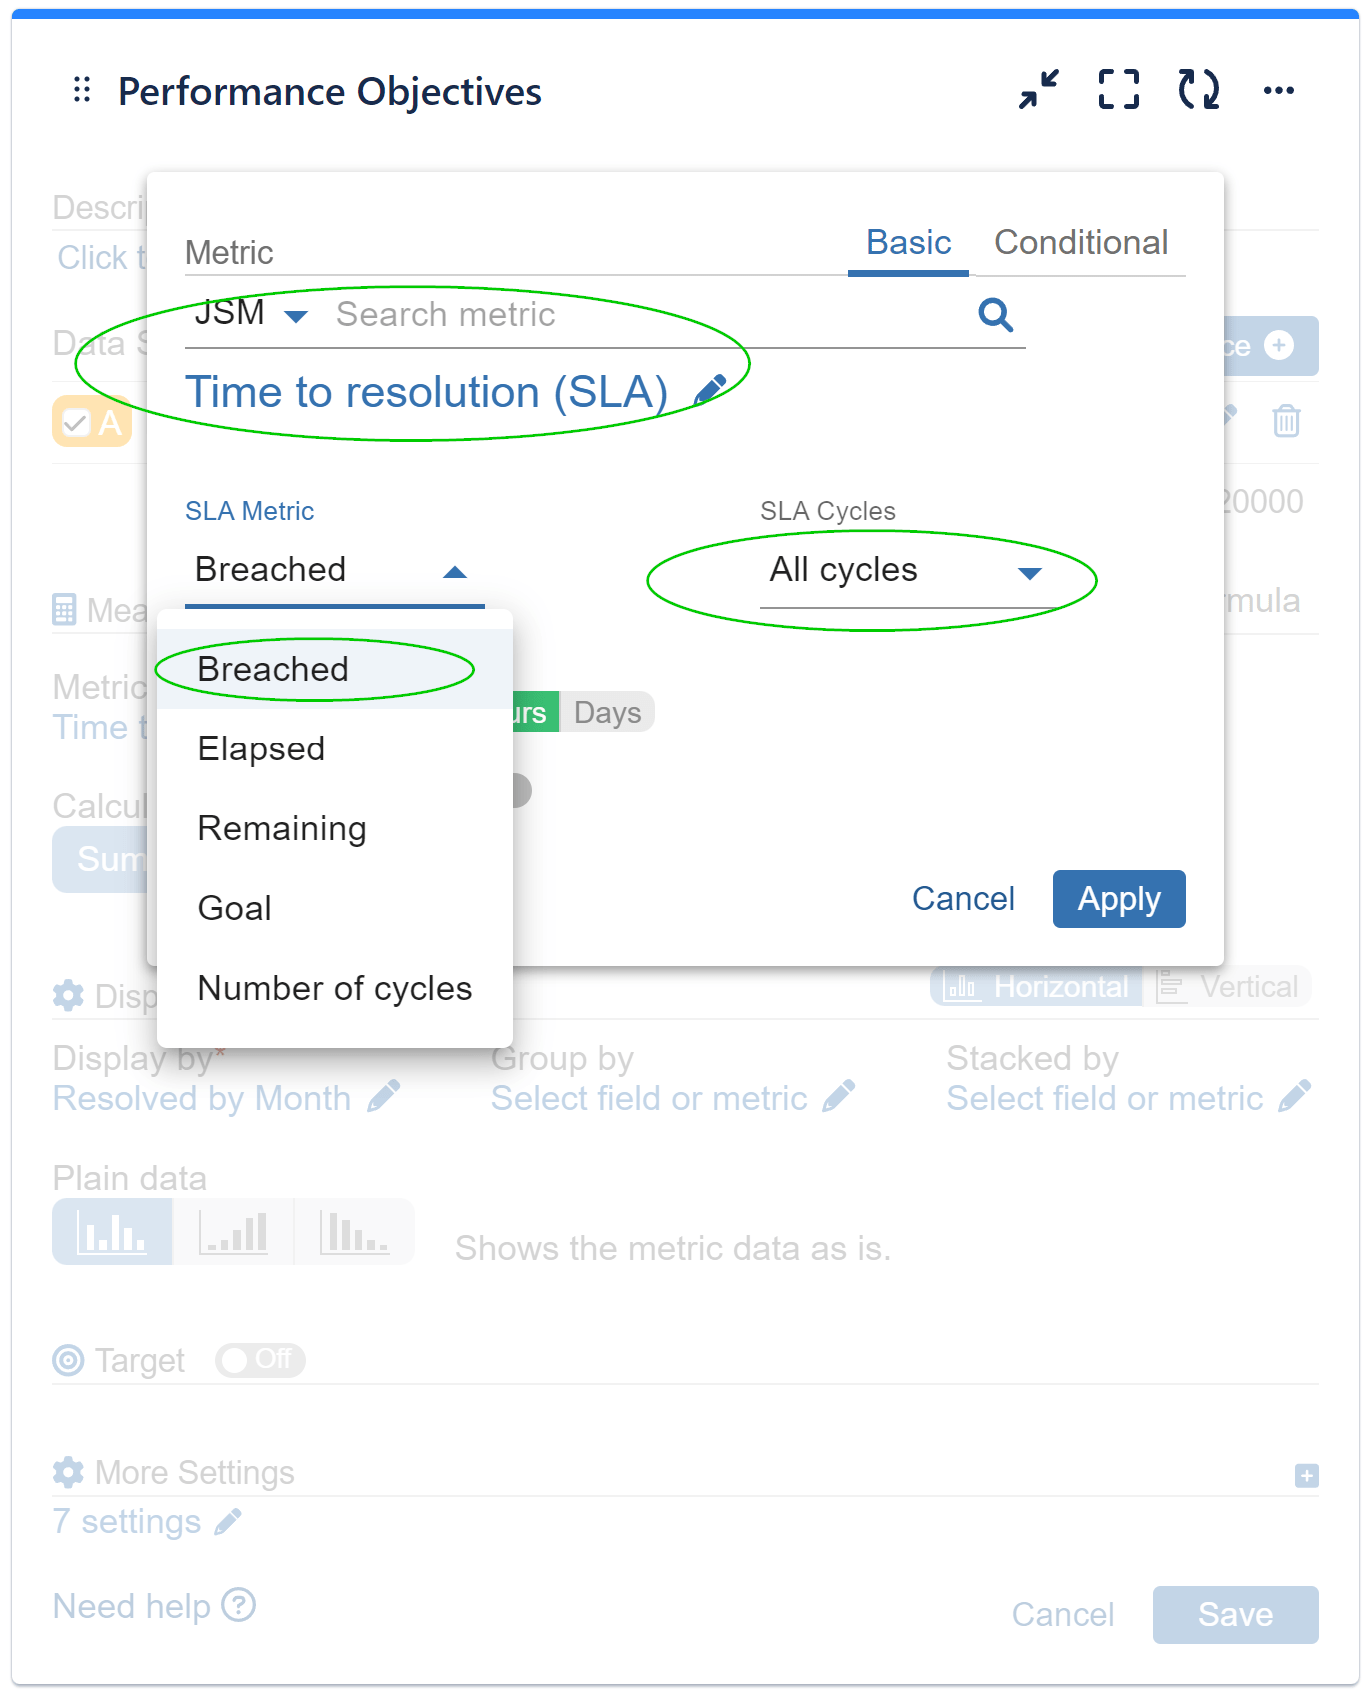
SLA Metrics: Time to Resolution Breached Report
The following configuration shows how you can utilize SLA metrics such as ‘Breached (h),’ ‘Elapsed (h),’ ‘Remaining (h),’ ‘Goal,’ and ‘Number of cycles’ for each SLA defined in Jira Service Management.
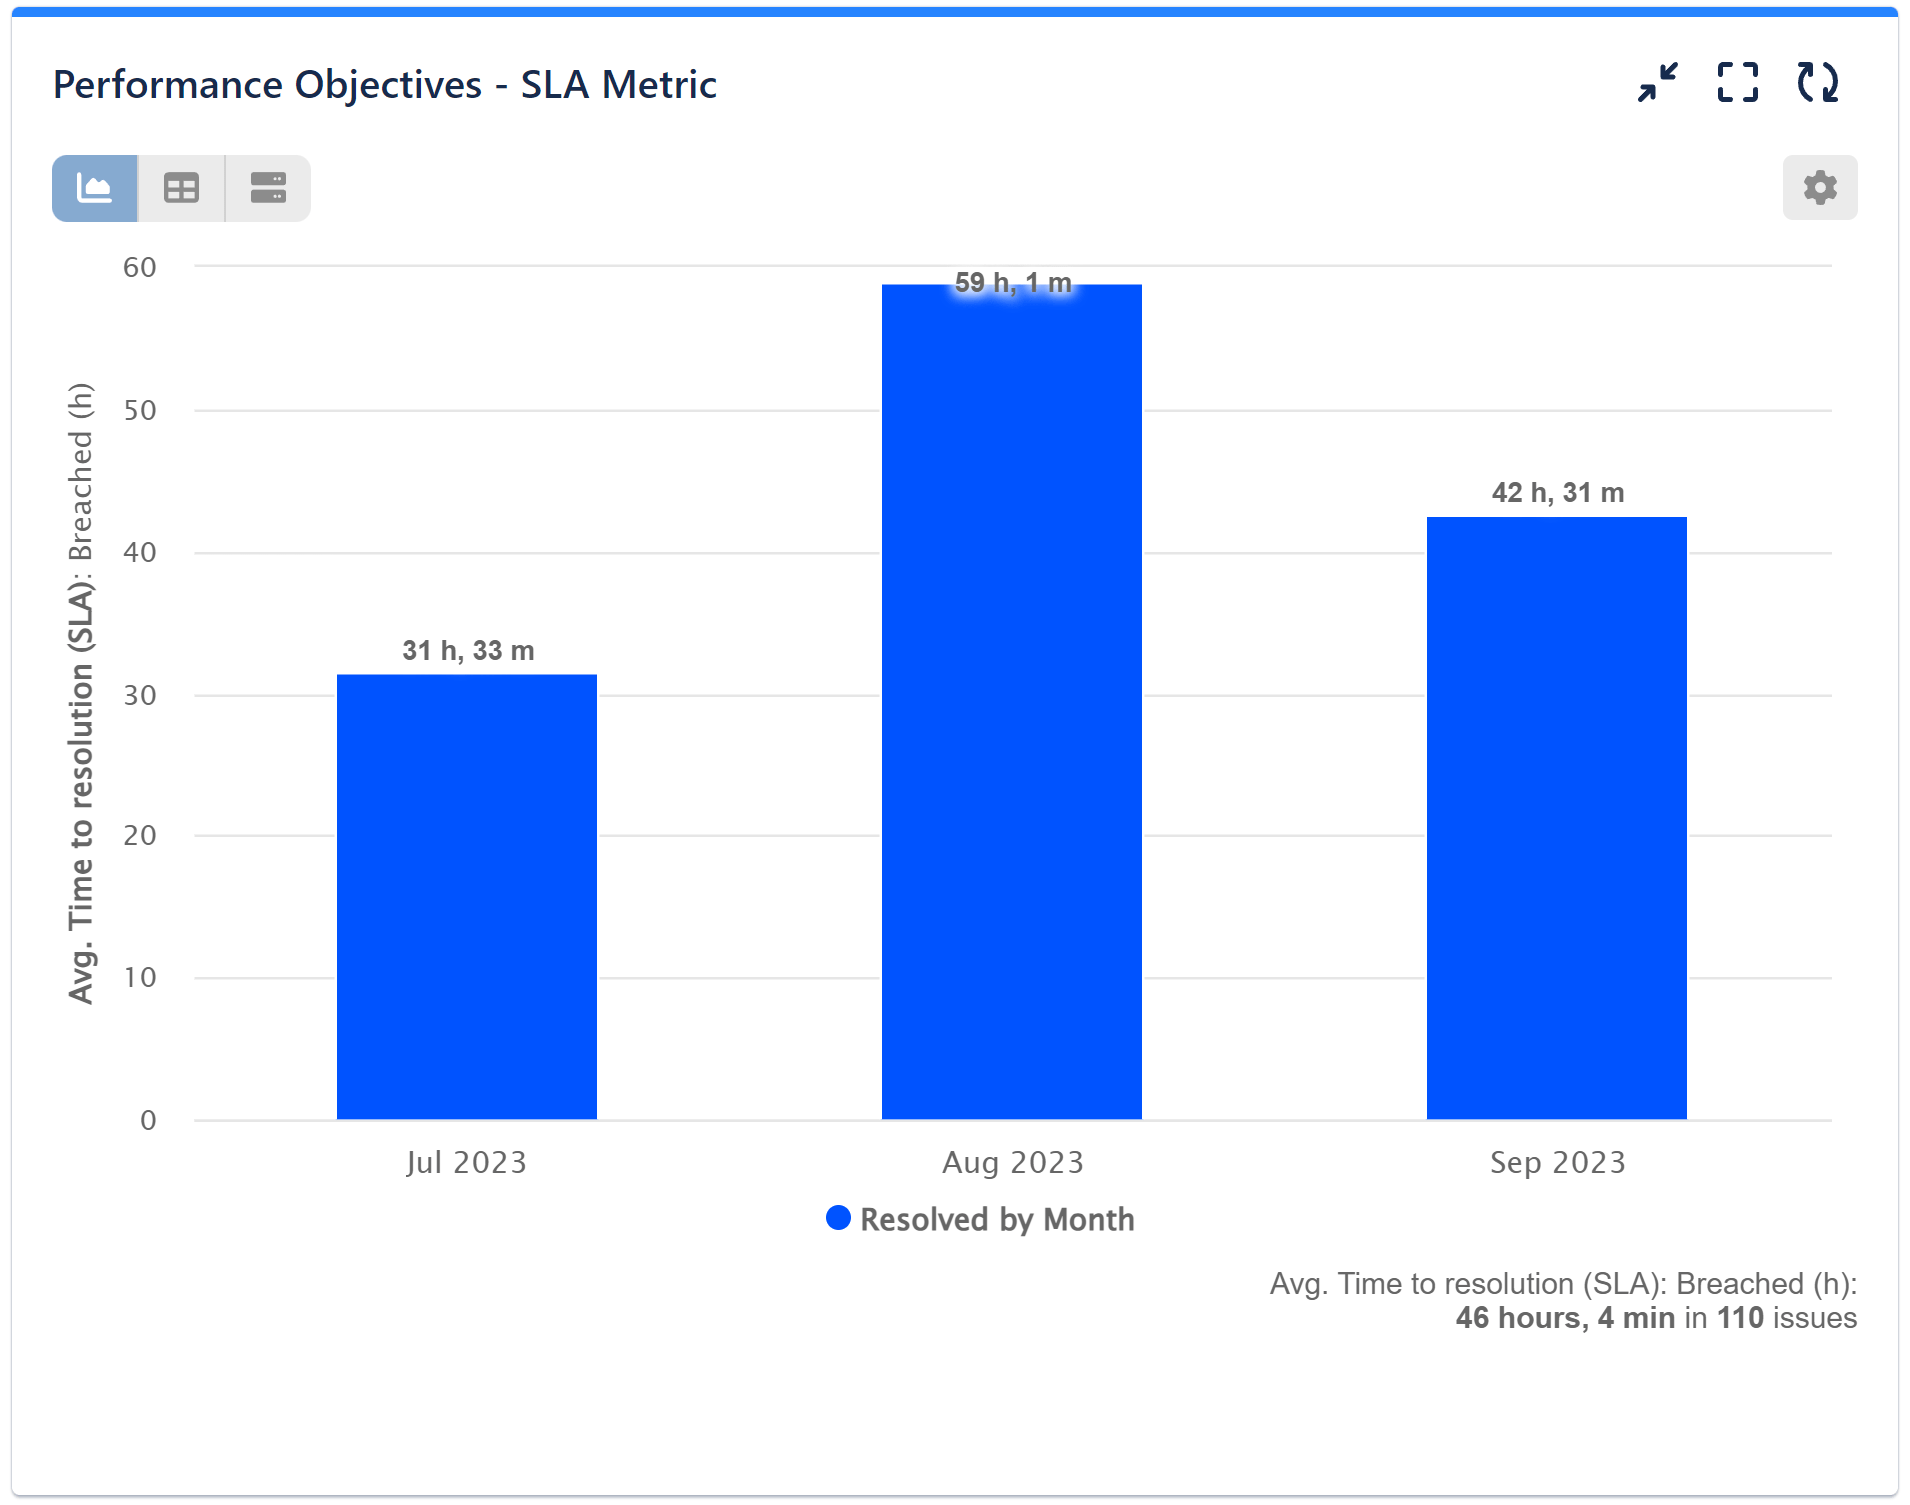
On the right is a settings image. Below, you can find a video with the configuration steps:
SLA Display Options: Time to First Response Breached
The following configuration utilizes SLA fields such as ‘Is Breached’ and ‘Is Paused,’ which are accessible for each SLA defined in Jira Service Management and uses those for the ‘Group by’ Display option.
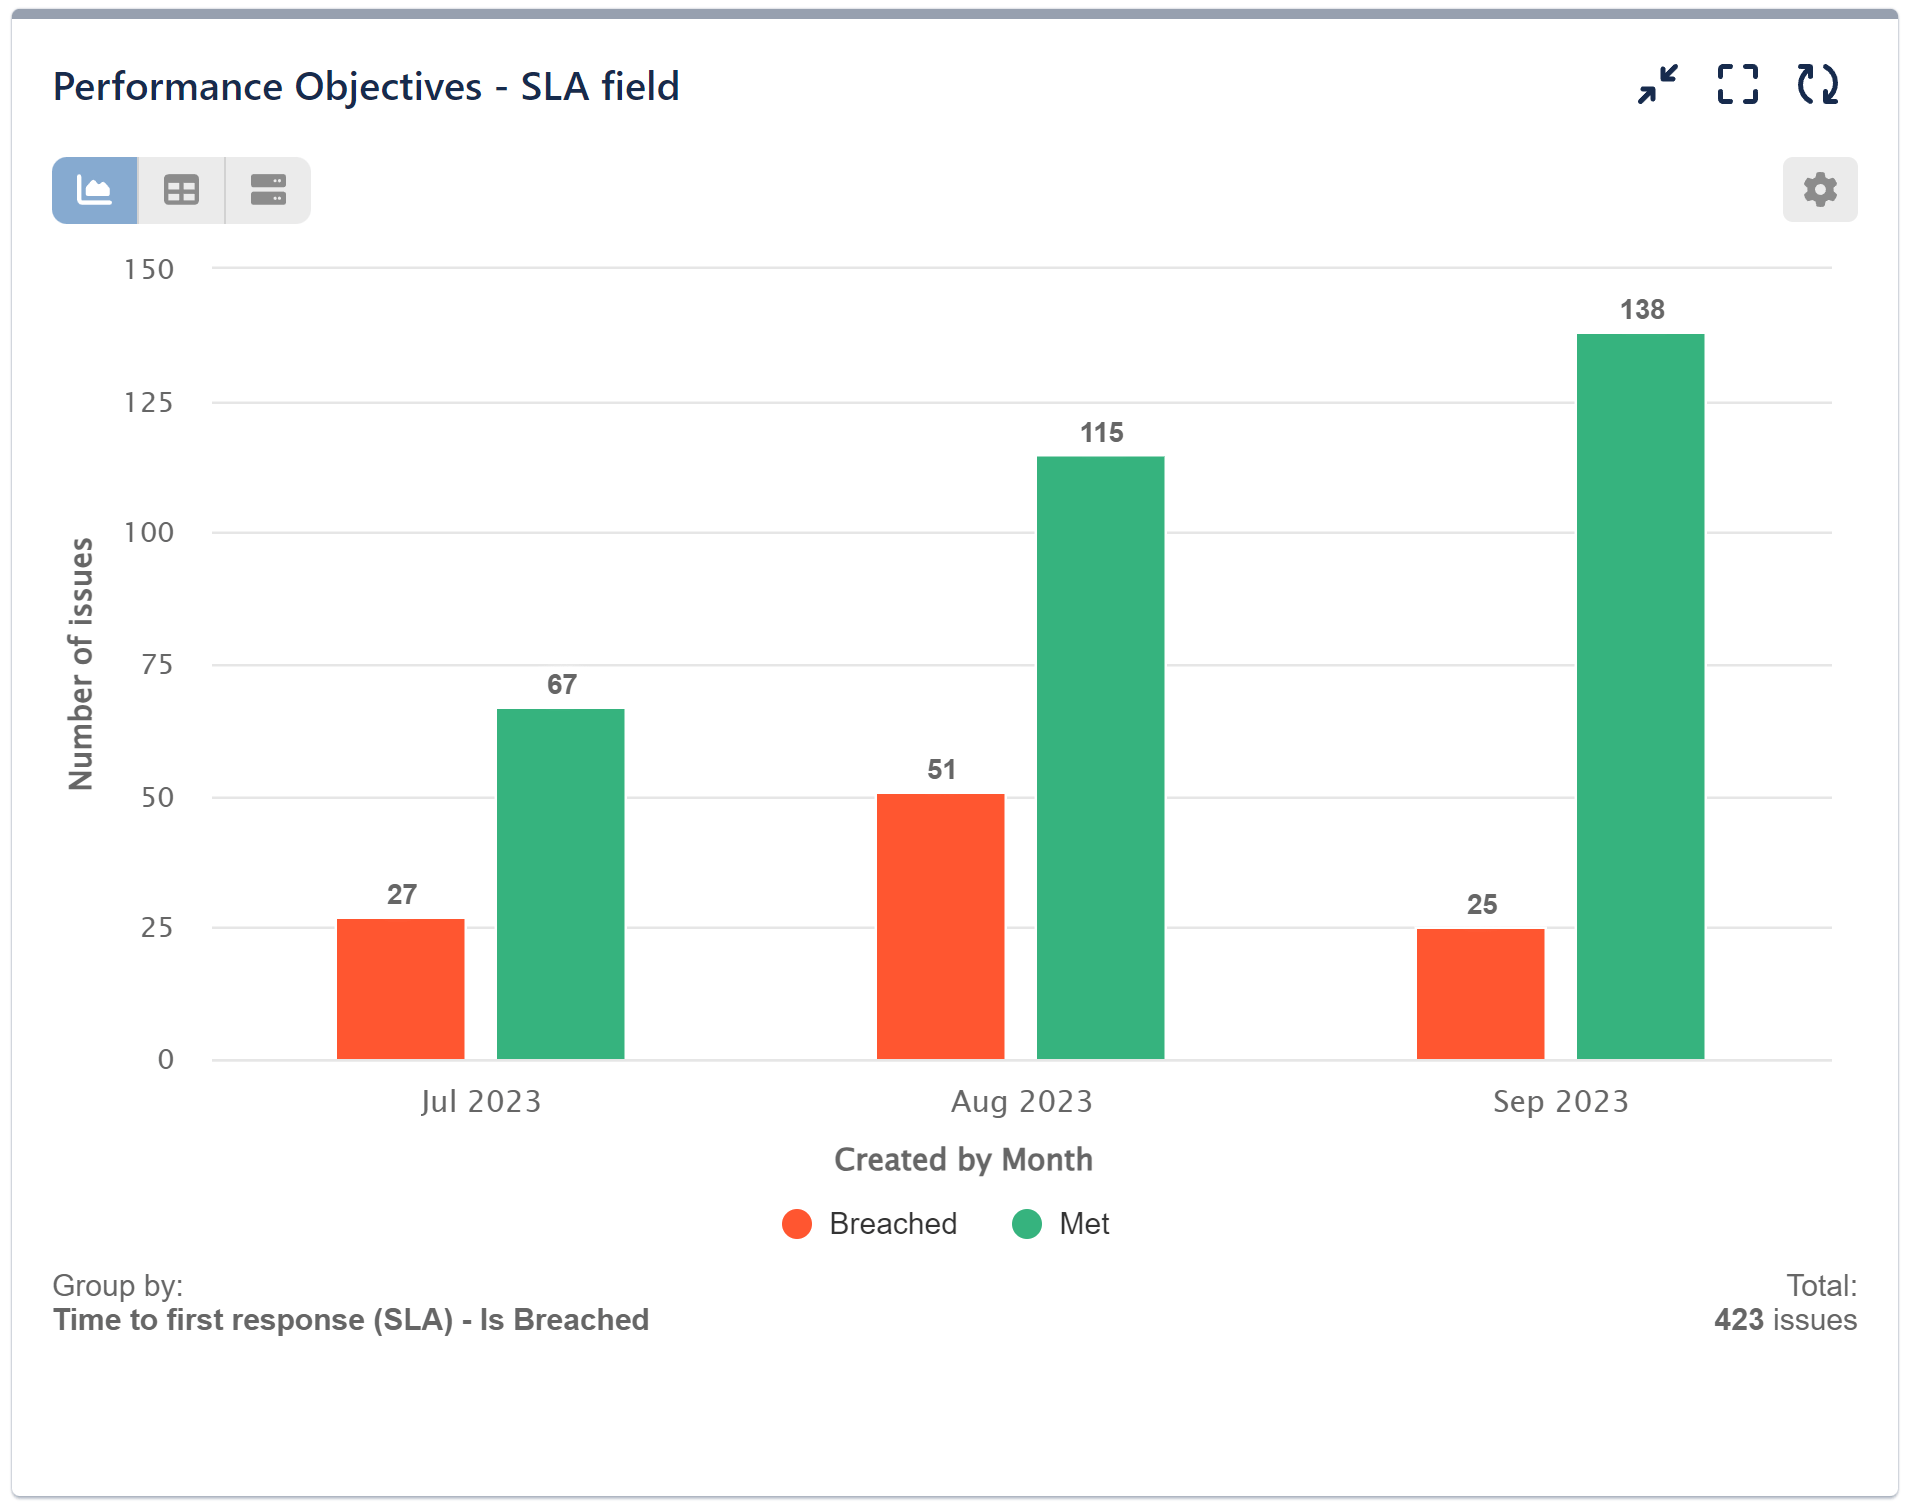
On the right is a settings image. Below, you can find a video with the configuration steps:
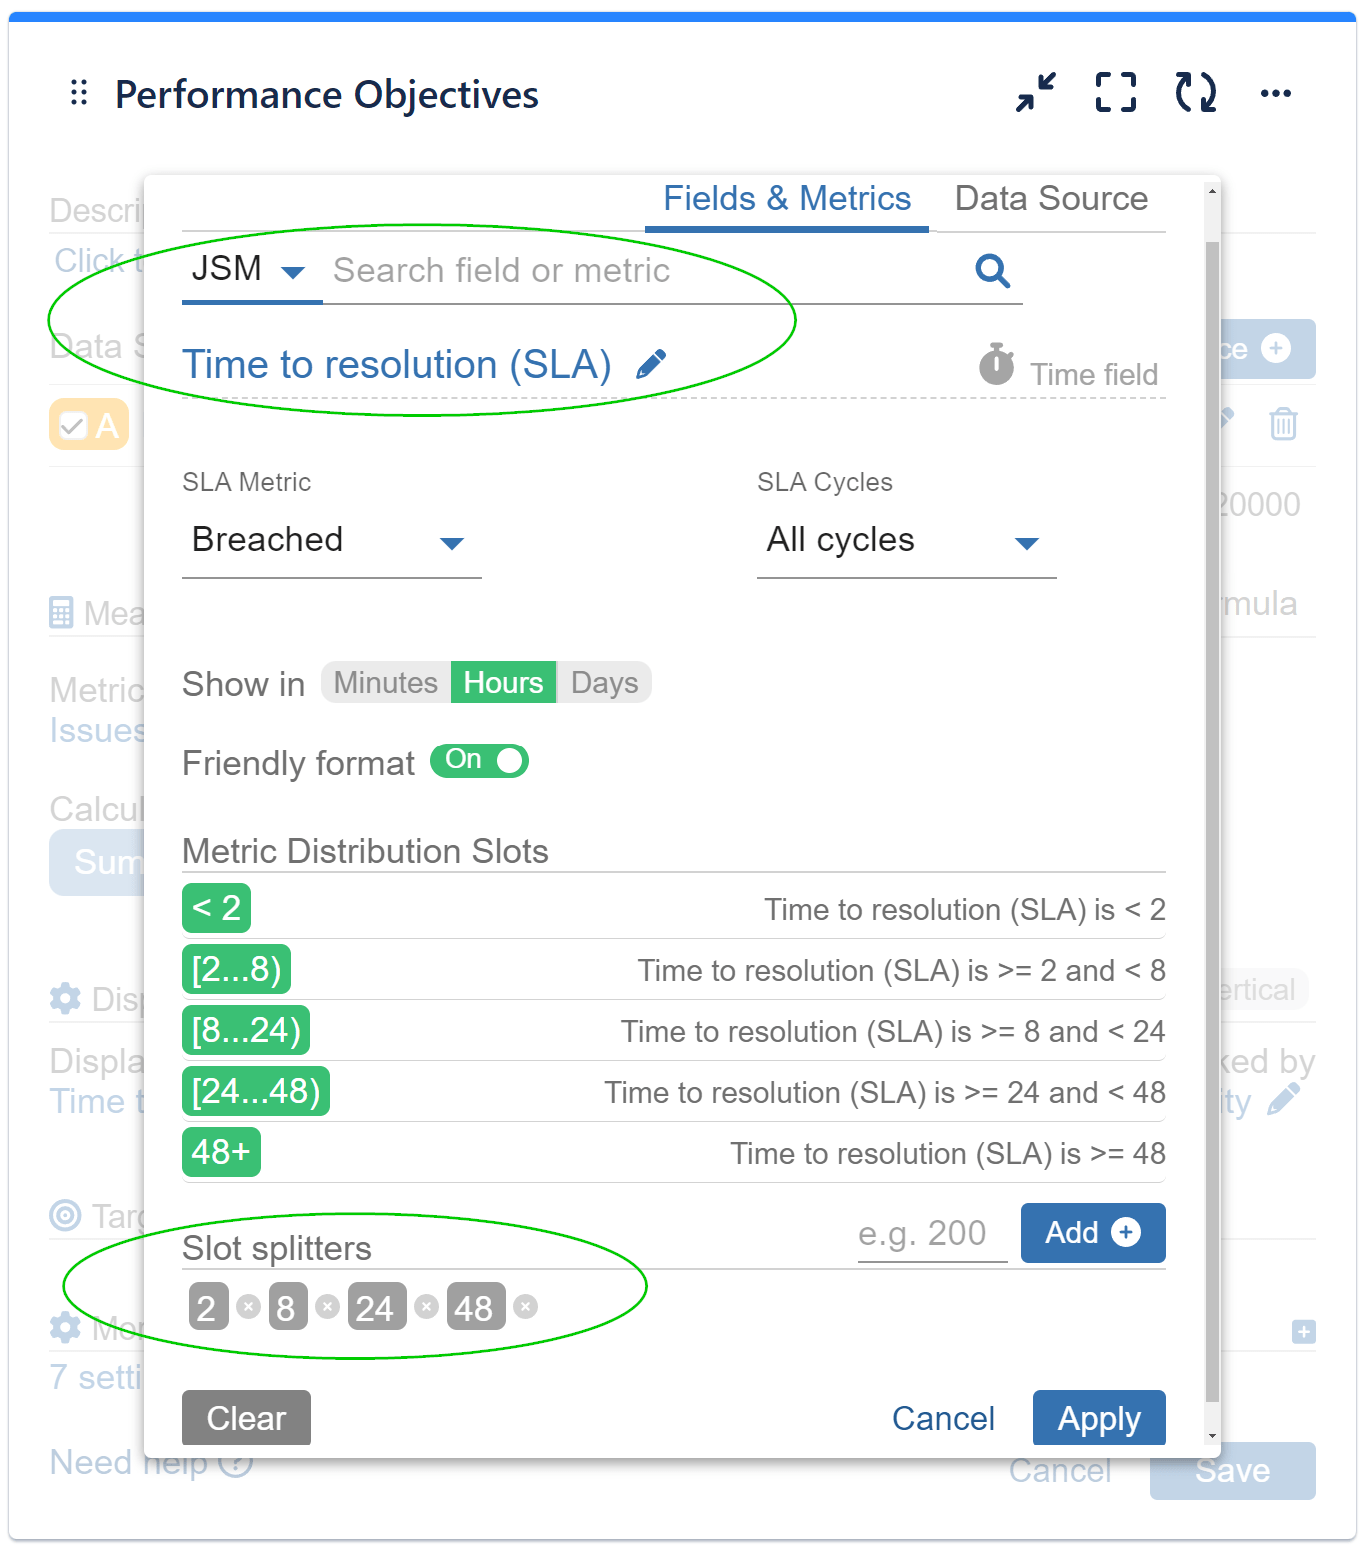
Enhance ITSM SLA Reporting with SLA Metric Distribution
The Performance Objectives: Charts for Jira app offers a robust metric distribution feature, allowing users to utilize SLA metrics, but also Time, Number, Dynamic metrics as fields and segment them into custom distribution slots using the ‘Slot Splitters’ functionality. Metric distribution enhances SLA metric management by providing valuable insights into compliance and performance directly on Jira dashboards. Custom time slots are crucial for monitoring response and resolution times, helping teams swiftly identify breaches and take corrective actions to maintain service quality and customer satisfaction.
In this chart, we apply a conditional expression for metric calculation and use custom slot splitters for the ‘Display by’ SLA metric. Additionally, the bars are stacked by ‘Priority.’
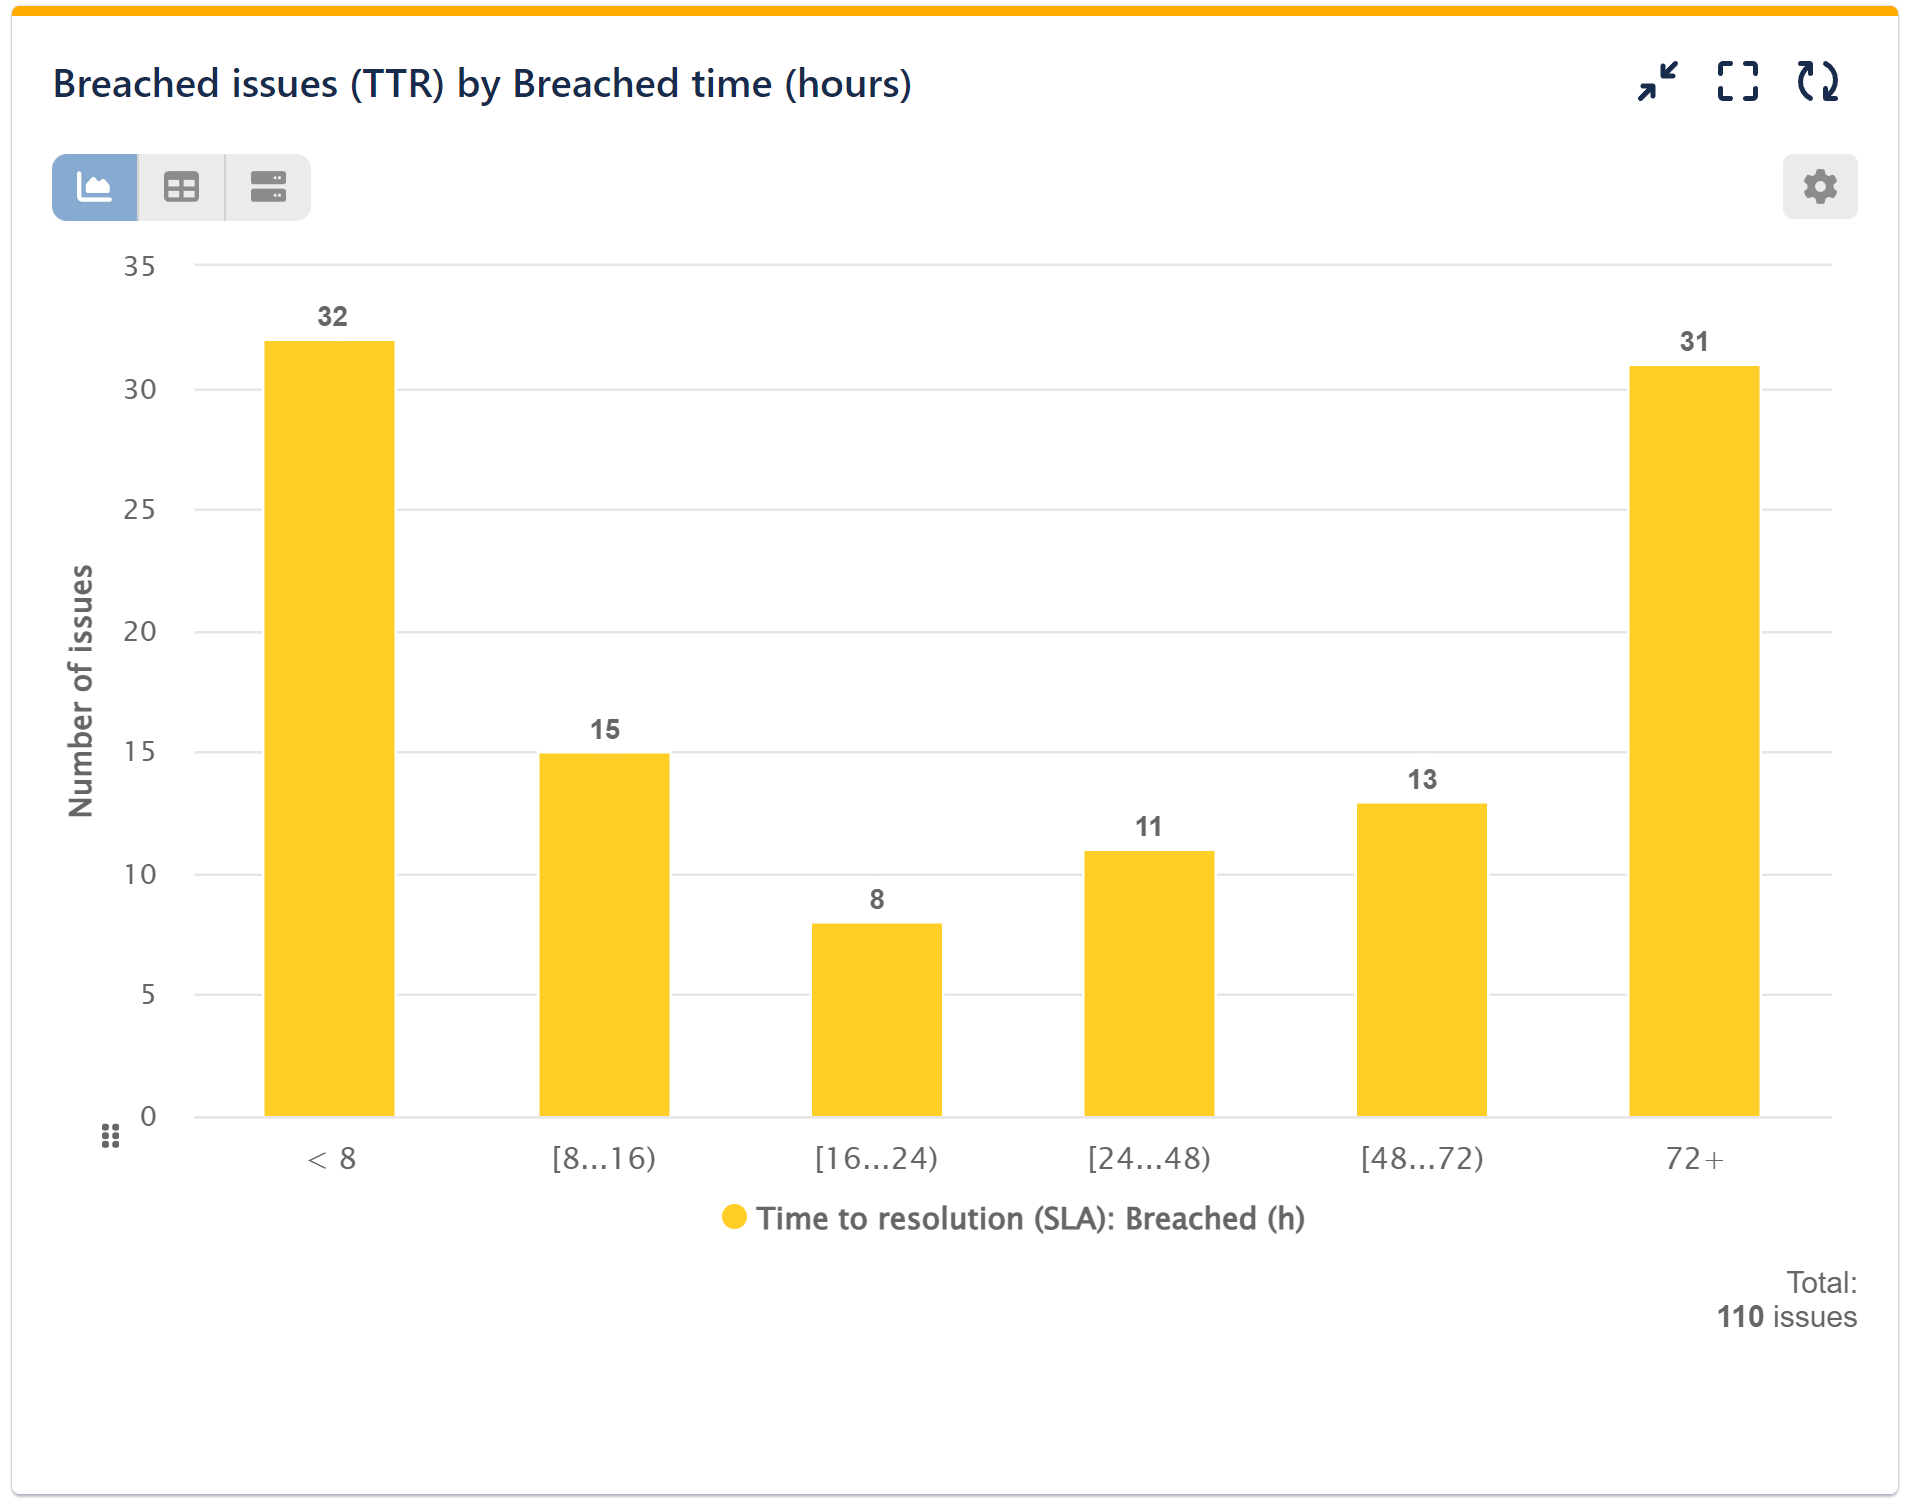
On the right is a settings image. Below, you can find a video with the configuration steps:
Delve into our content for extensive insights and ideas regarding SLA Reporting in Jira Service Management using the Performance Objectives app. When applicable, we also provide alternative approaches for reporting on similar metrics in Jira Work Management and Jira Software projects.
You can also use the Performance Objectives app to:
- Generate a ‘Breached vs Met‘ report (SLA breaches per team, per assignee, by issue type, by priority, etc.).
- Monitor the Mean Time to Resolve KPI with the ‘Time to Resolution Report.’
- Keep an eye on First Response Time with the ‘Time to First Response Report.’
Should you require additional assistance with configuring your reports and KPIs, please don’t hesitate to contact our Support Team.
Start your 30 days free trial of Performance Objectives: Charts for Jira from Atlassian Marketplace.