Burndown charts are invaluable in project management and agile software development, offering a host of advantages. In the context of Jira, the Performance Trend gadget, in tandem with the Multi Metric Trend and Multi Metric Combined gadgets, empowers users to craft custom burndown charts with Declining mode feature.
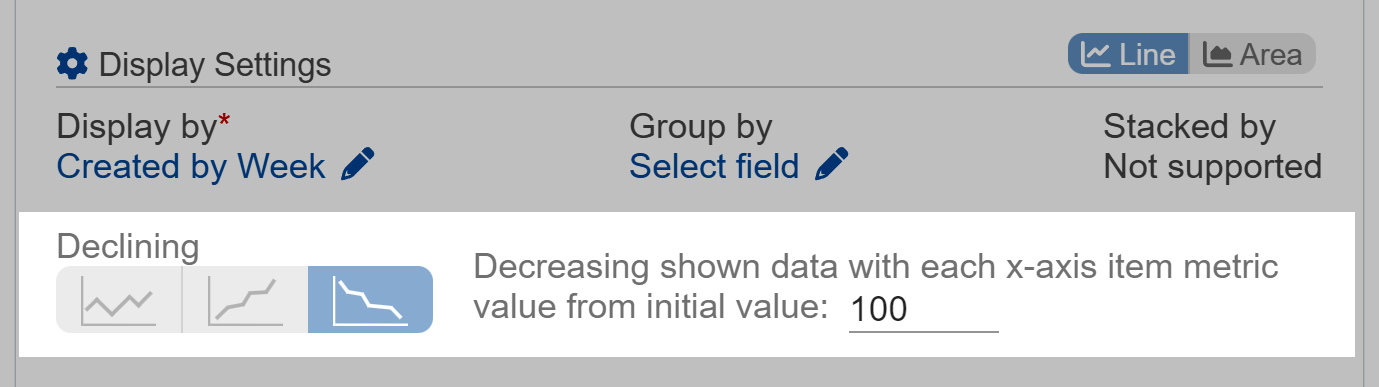
This is achieved by selecting the ‘Declining Mode‘ for displaying trends, allowing you to establish a starting point and zero for the ending point.
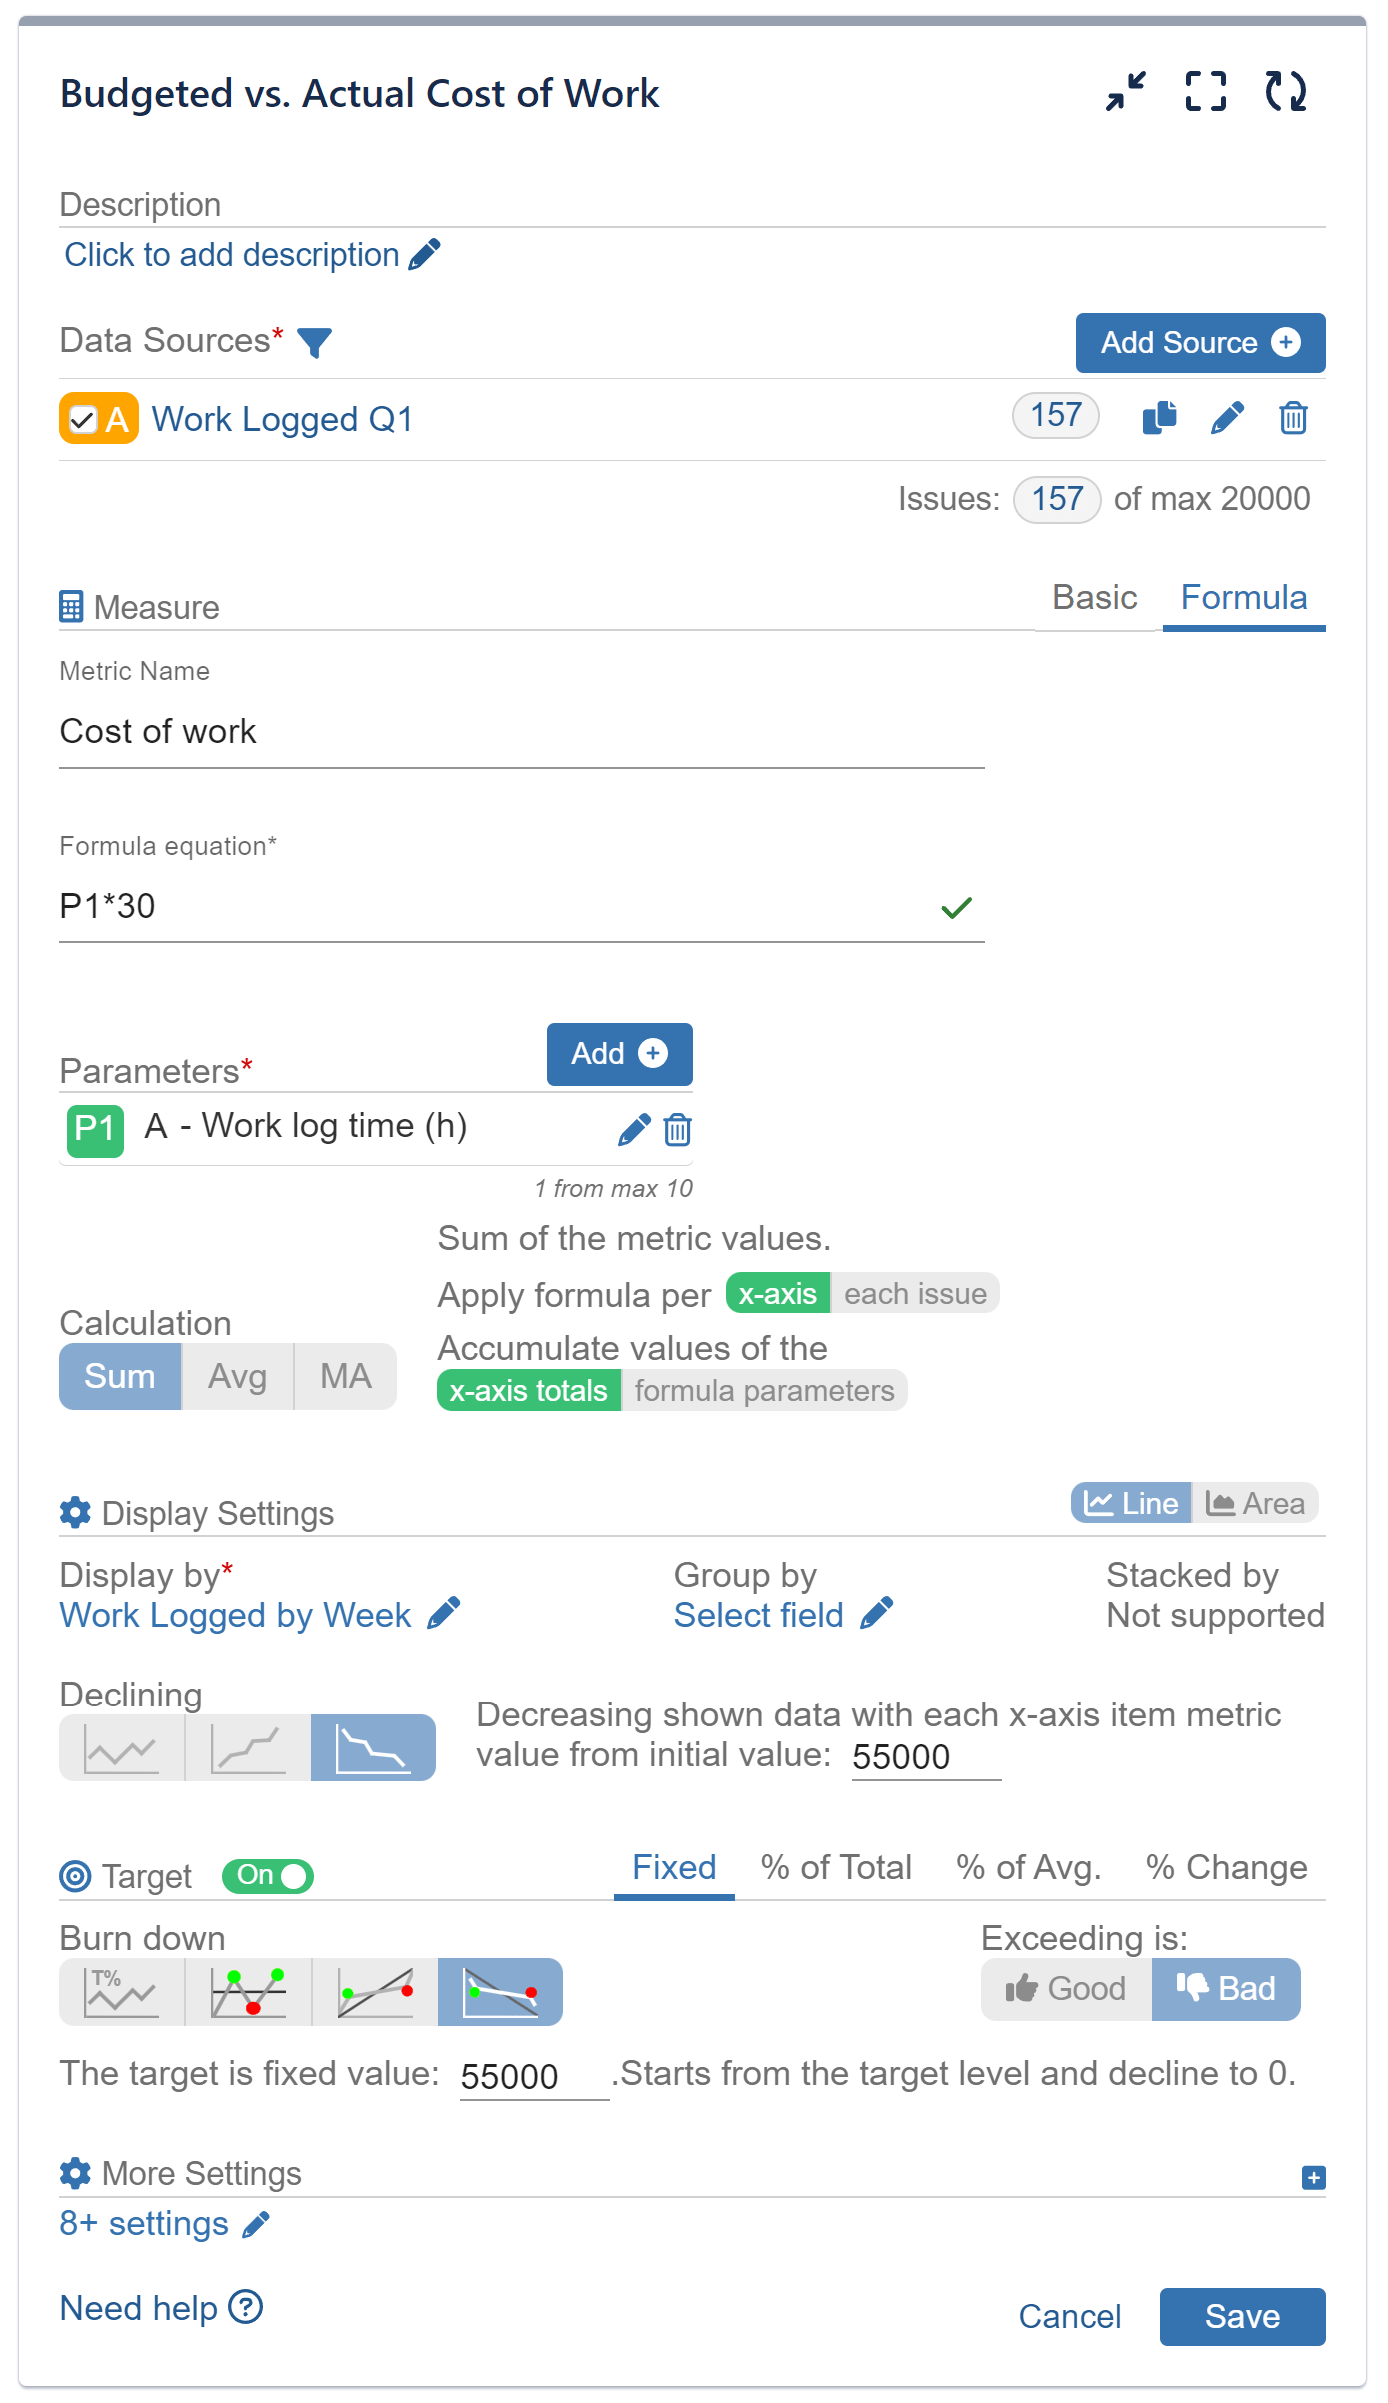
Moreover, the Performance Trend gadget introduces a ‘Target‘ feature, enabling you to transform any chart into a powerful performance management tool. This versatile tool finds application in a range of Jira reports, including evaluating ‘Budget vs. Actual Cost of Work,’ ‘Sprint Burndown’ report, or comparing ‘Original Estimate vs. Work Logged Time’ report.
Burndown Charts: Exploring Diverse Reports
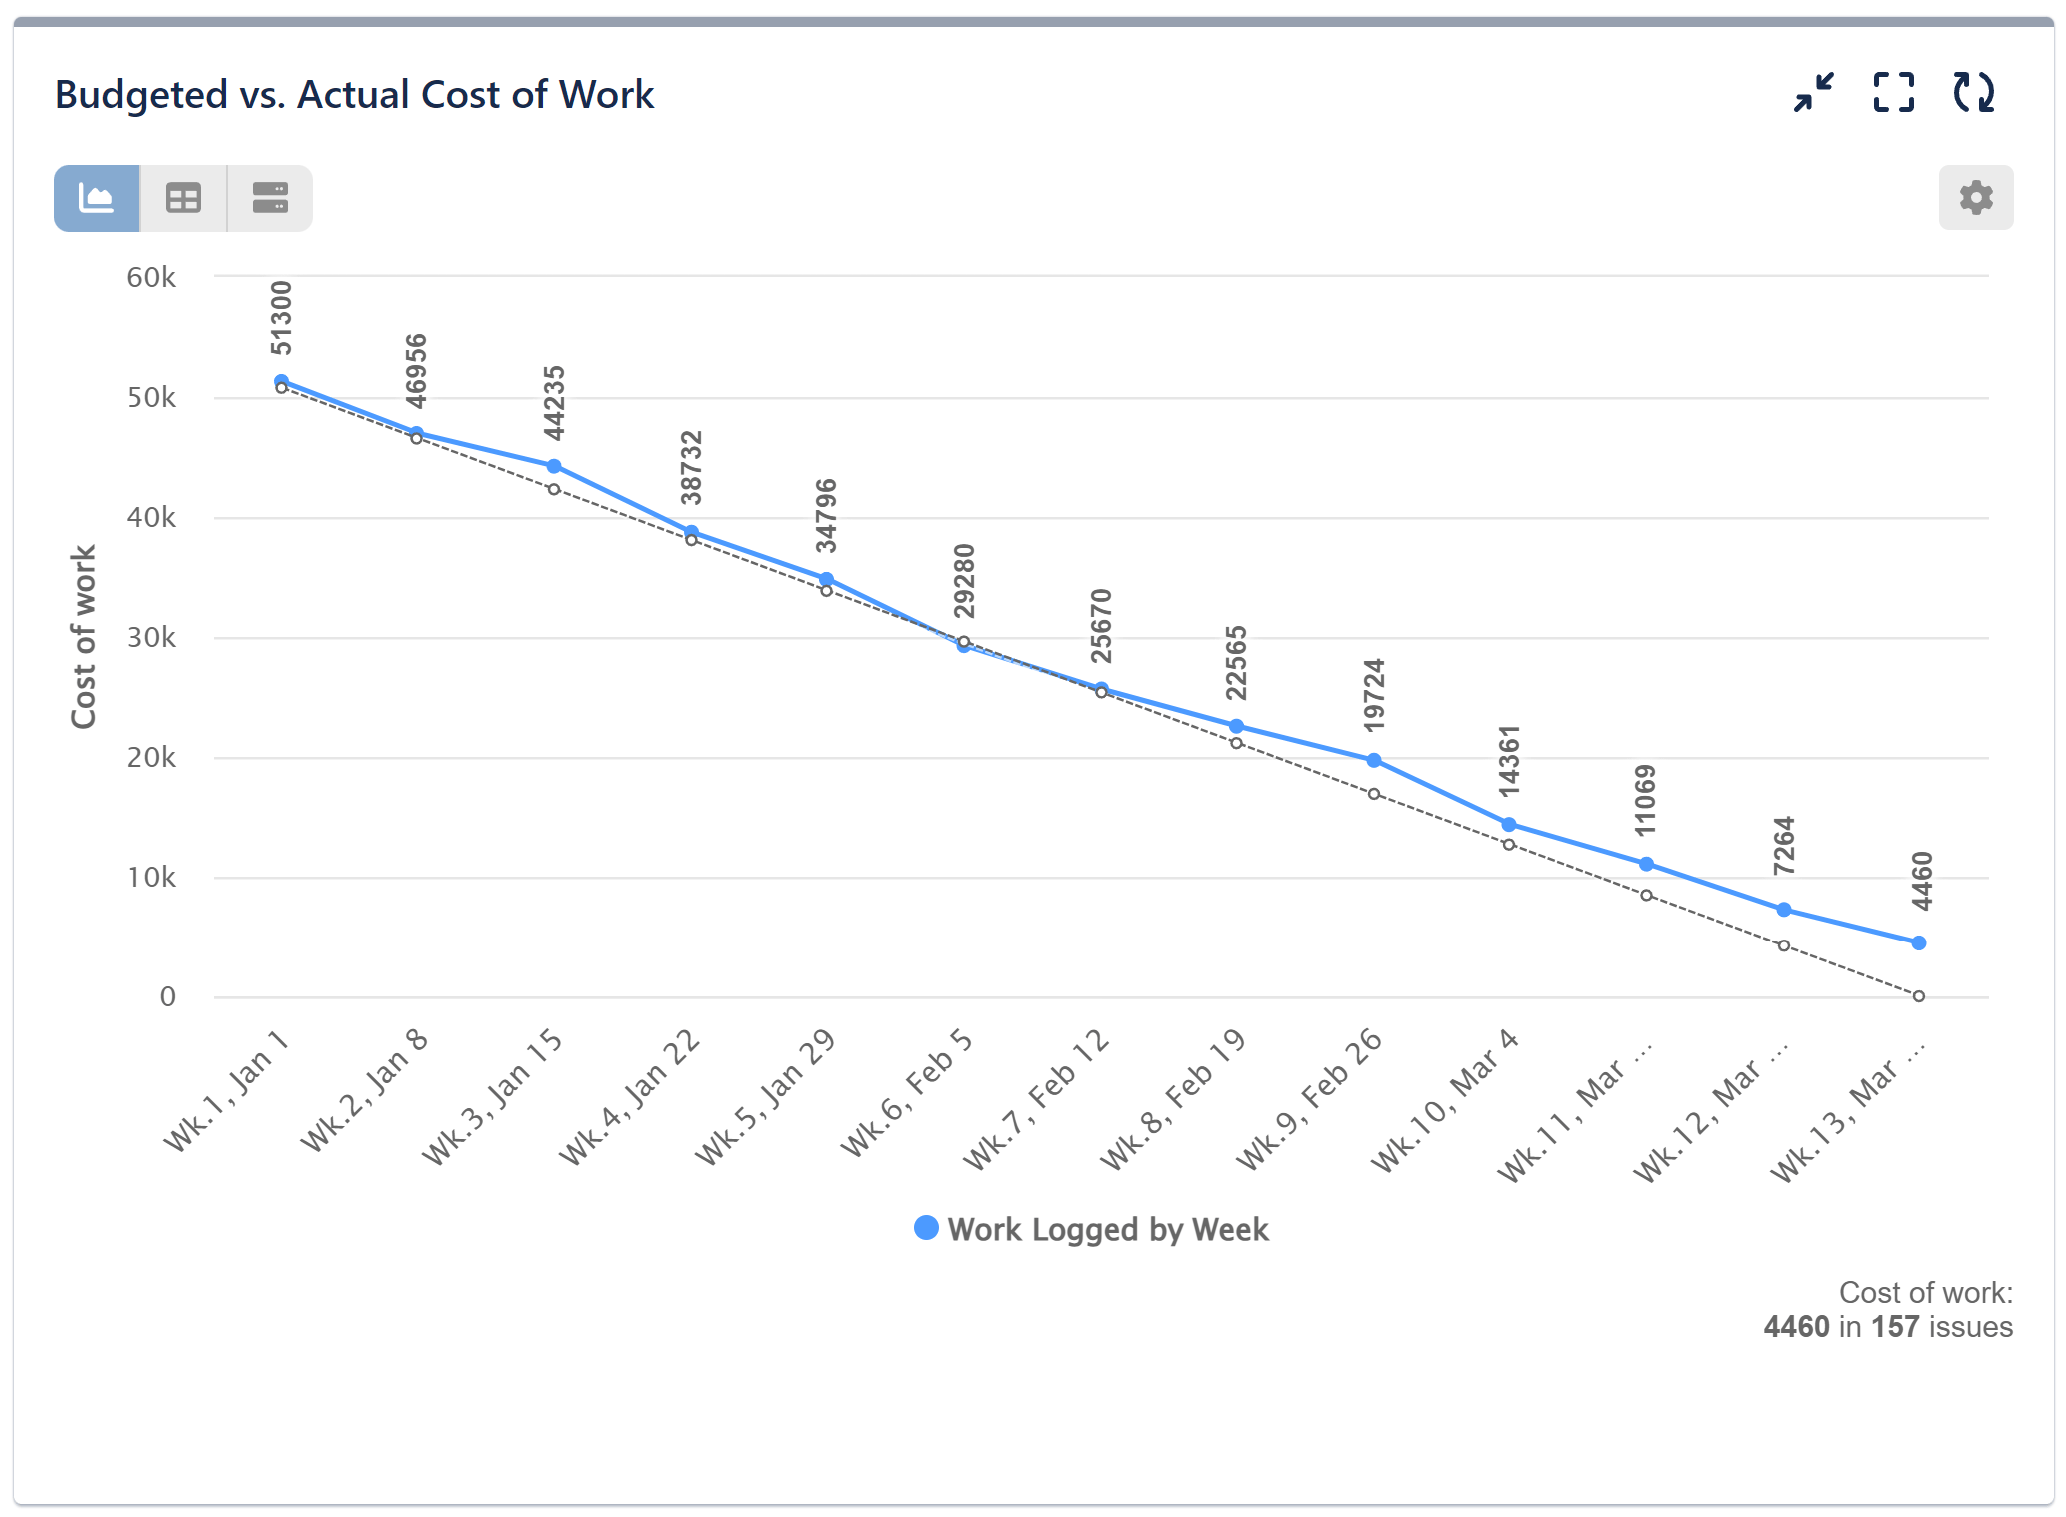
Budget vs Actual cost report:
Here’s a configuration screen for this report:
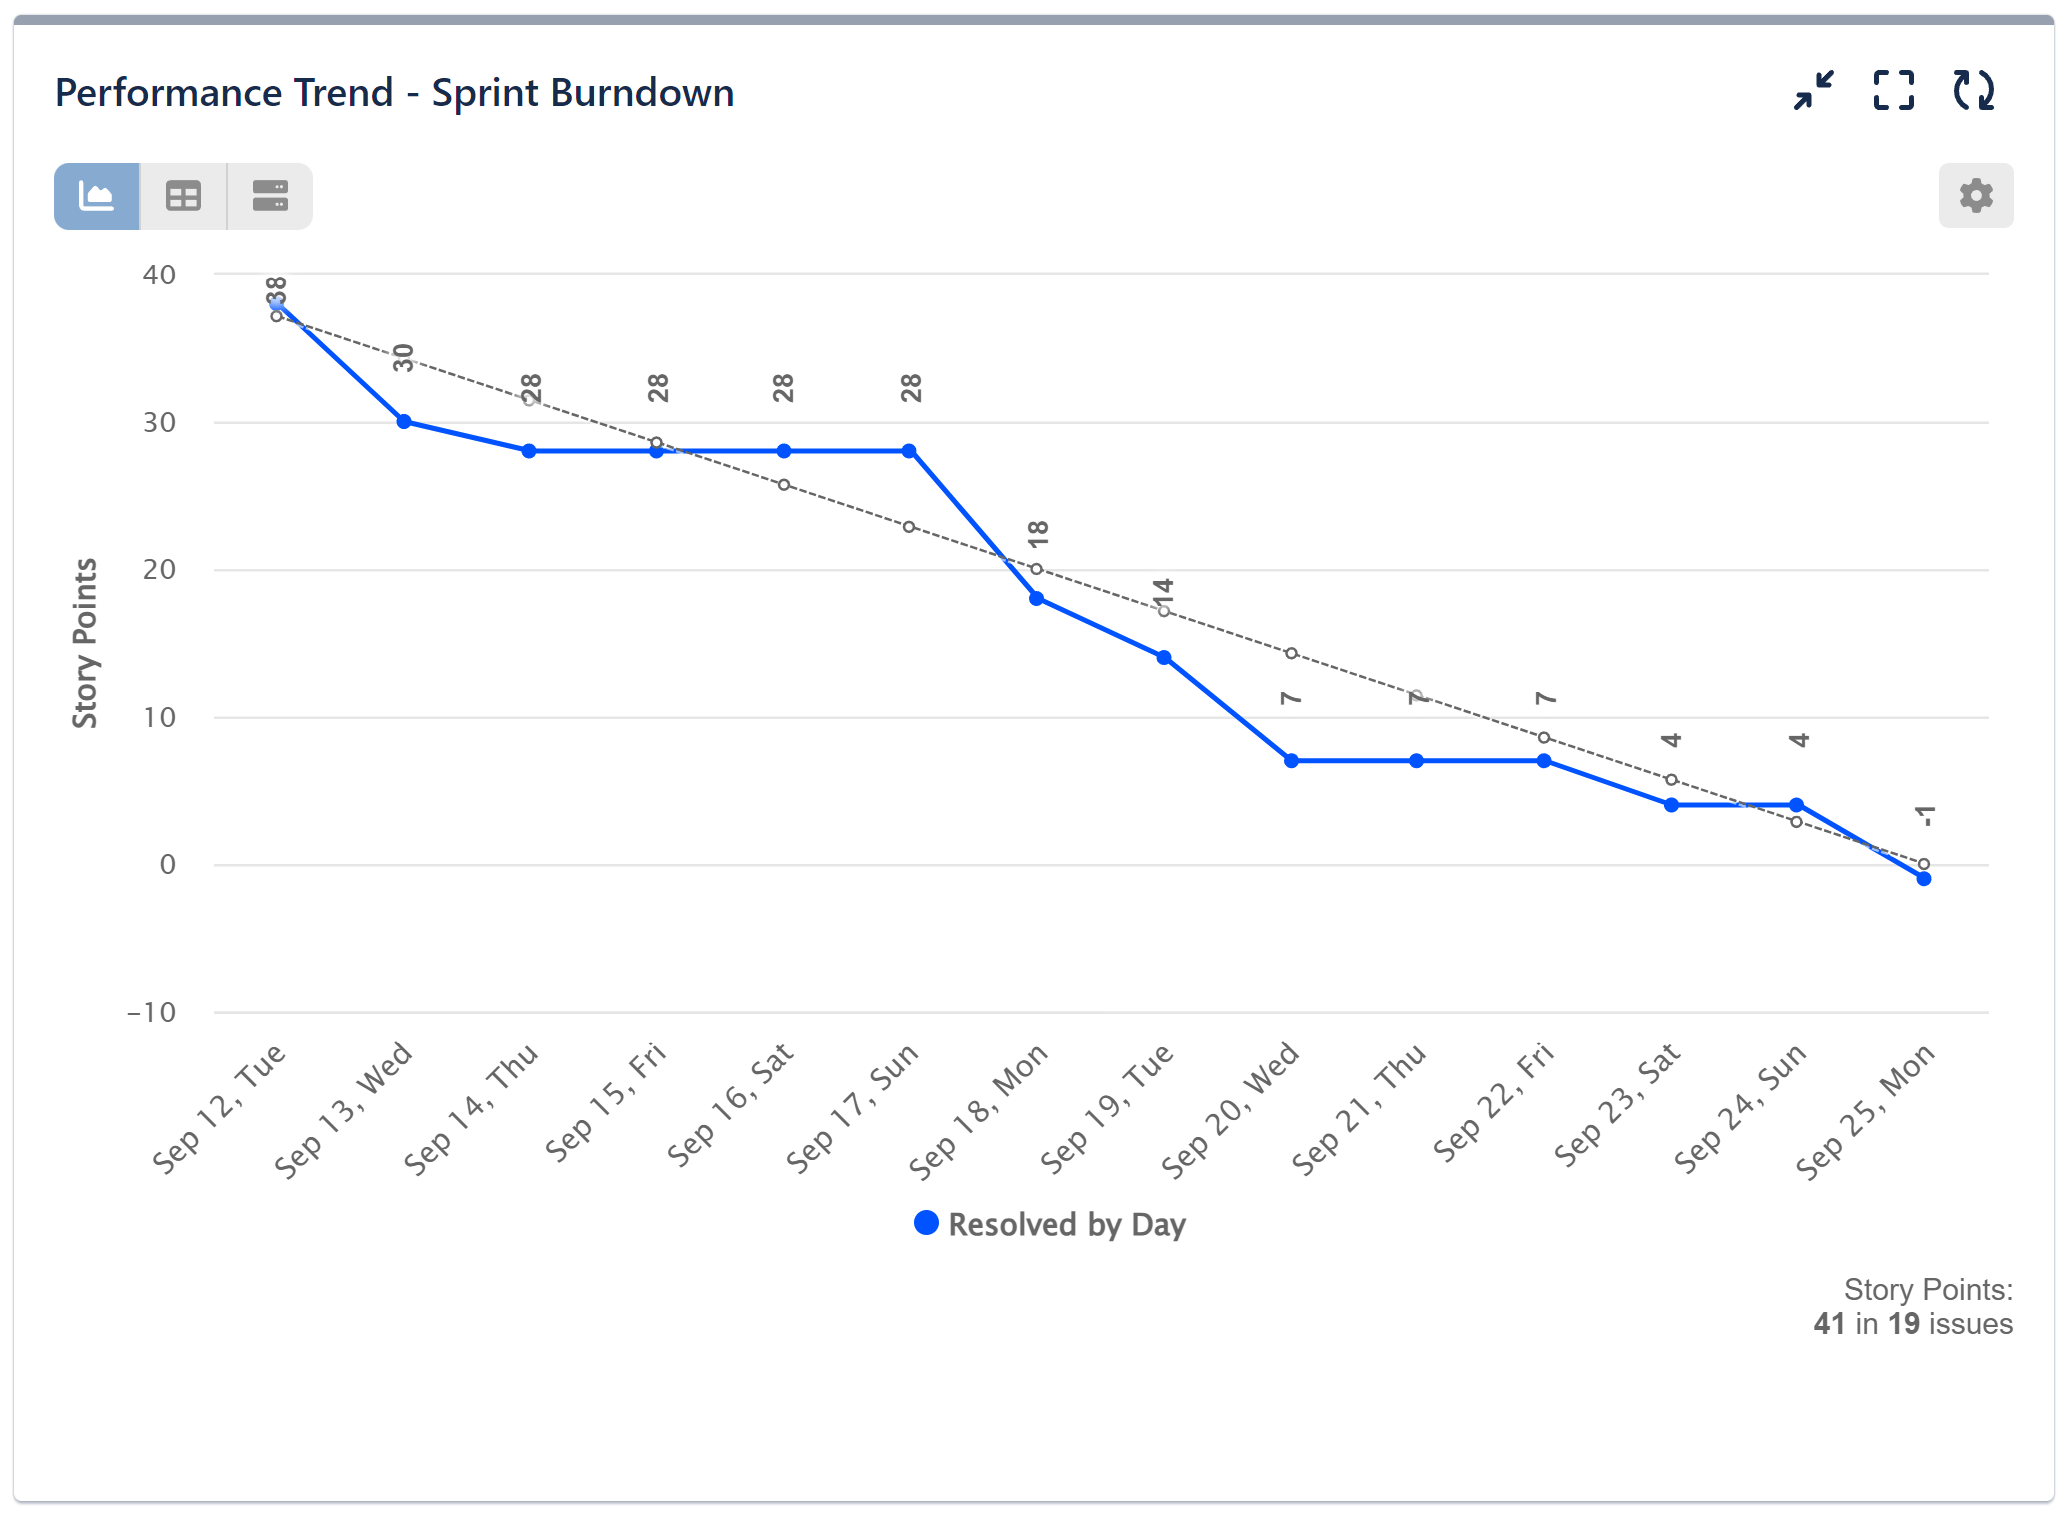
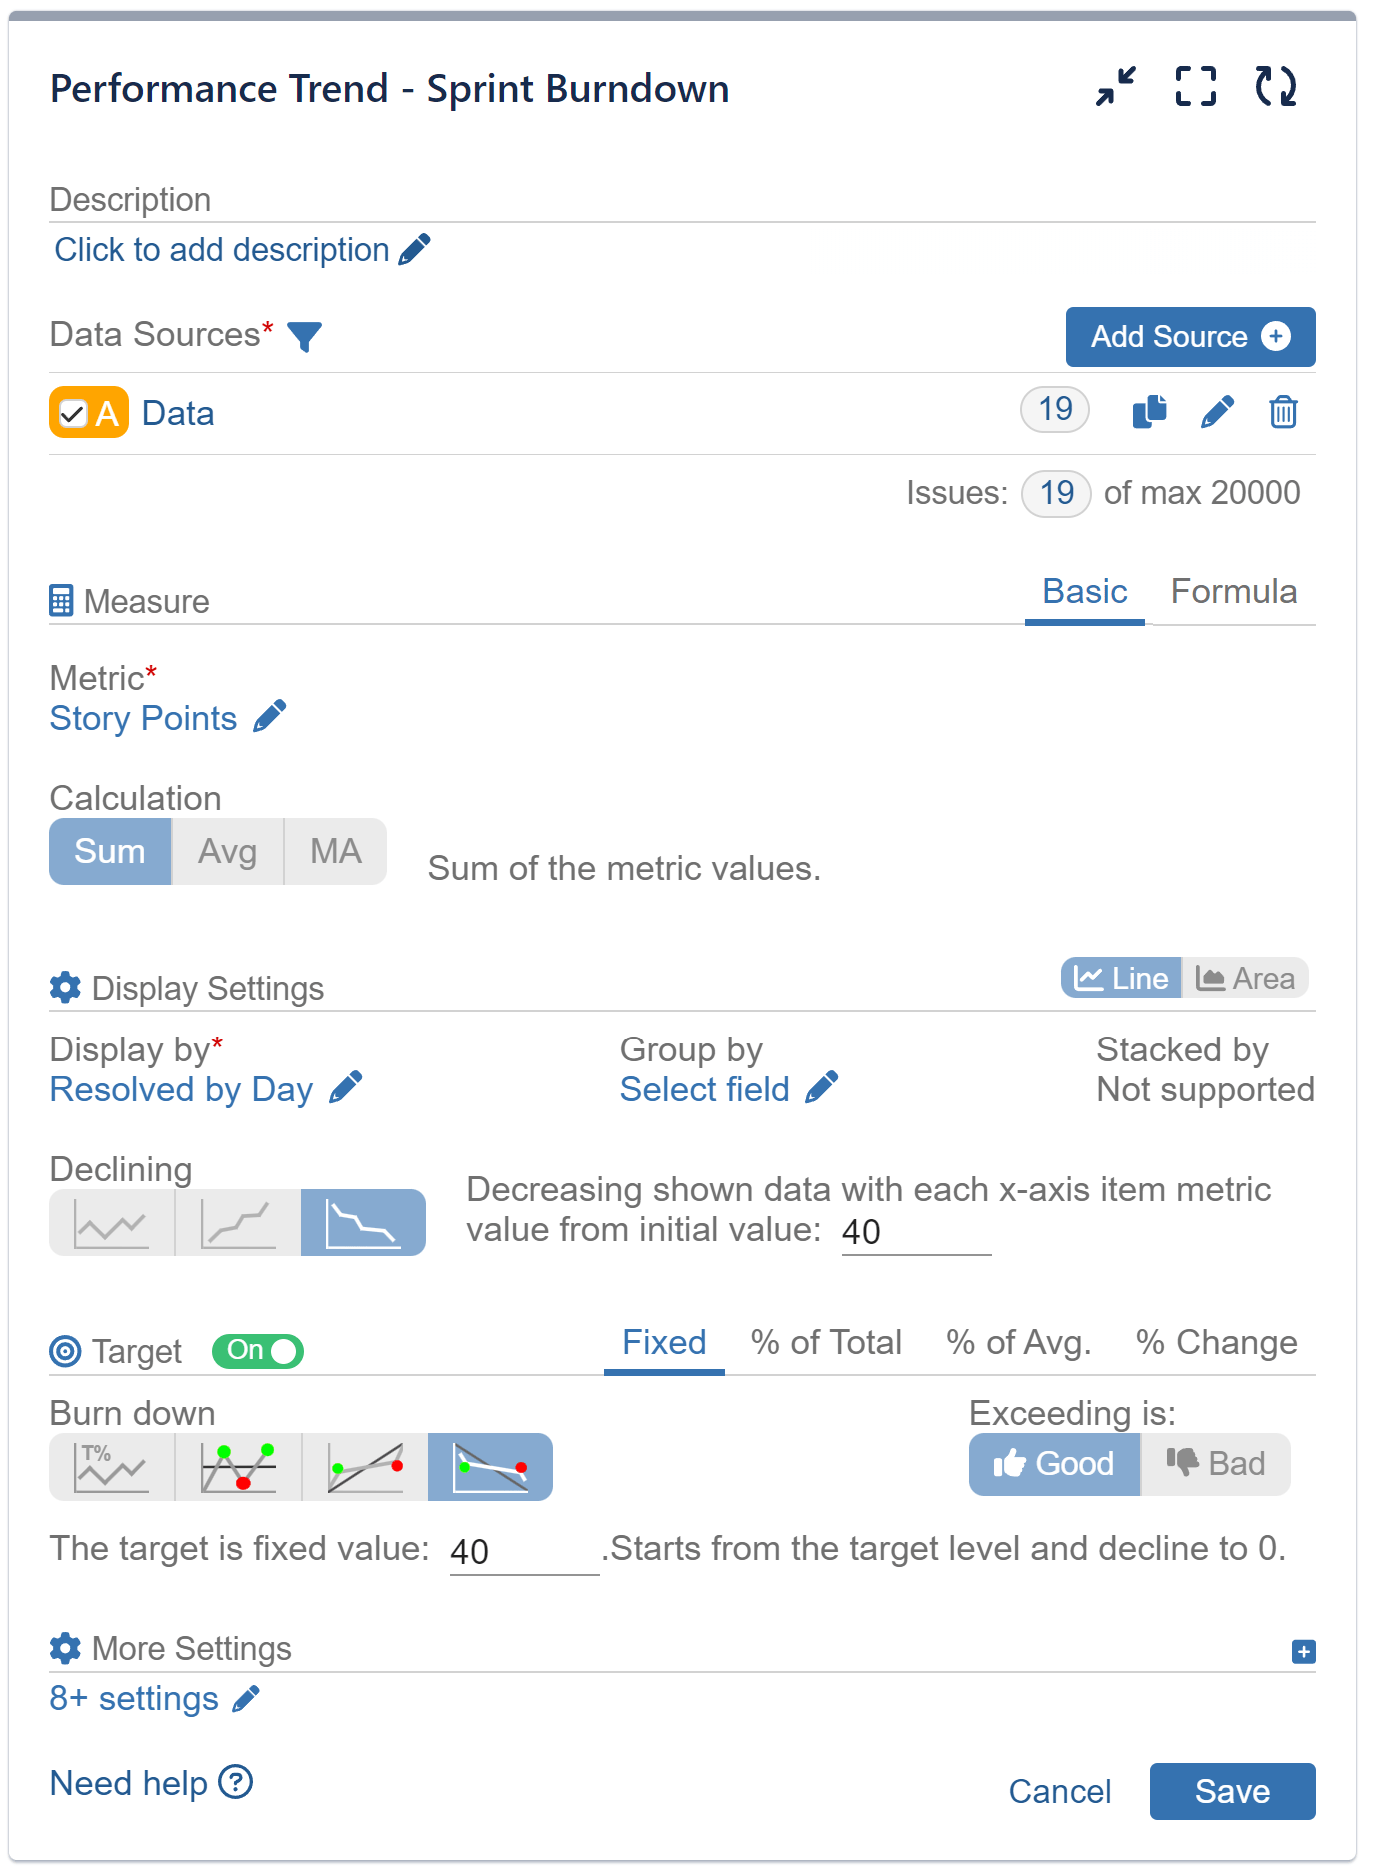
Sprint Burndown report:
Here’s a configuration screen for this report:
Another valuable report that can be generated in Declining mode is the comparison between the Original Estimate and Work Logged Time.
Aside from Declining mode, the Performance Objectives app also provides support for Cumulative mode. If you’re interested in identifying the reports that are most compatible with this feature, we encourage you to refer to our article.
If you want to delve into the Budget vs Actual cost report in detail, please refer to our article. If you are interested in other KPI examples, we can recommend a wide range of them for your Jira data analysis!
Start your 30 days free trial of Performance Objectives: Charts for Jira from Atlassian Marketplace.