Table of Contents
Performance Trend Gadget: Spotting Patterns on Your Jira Dashboard
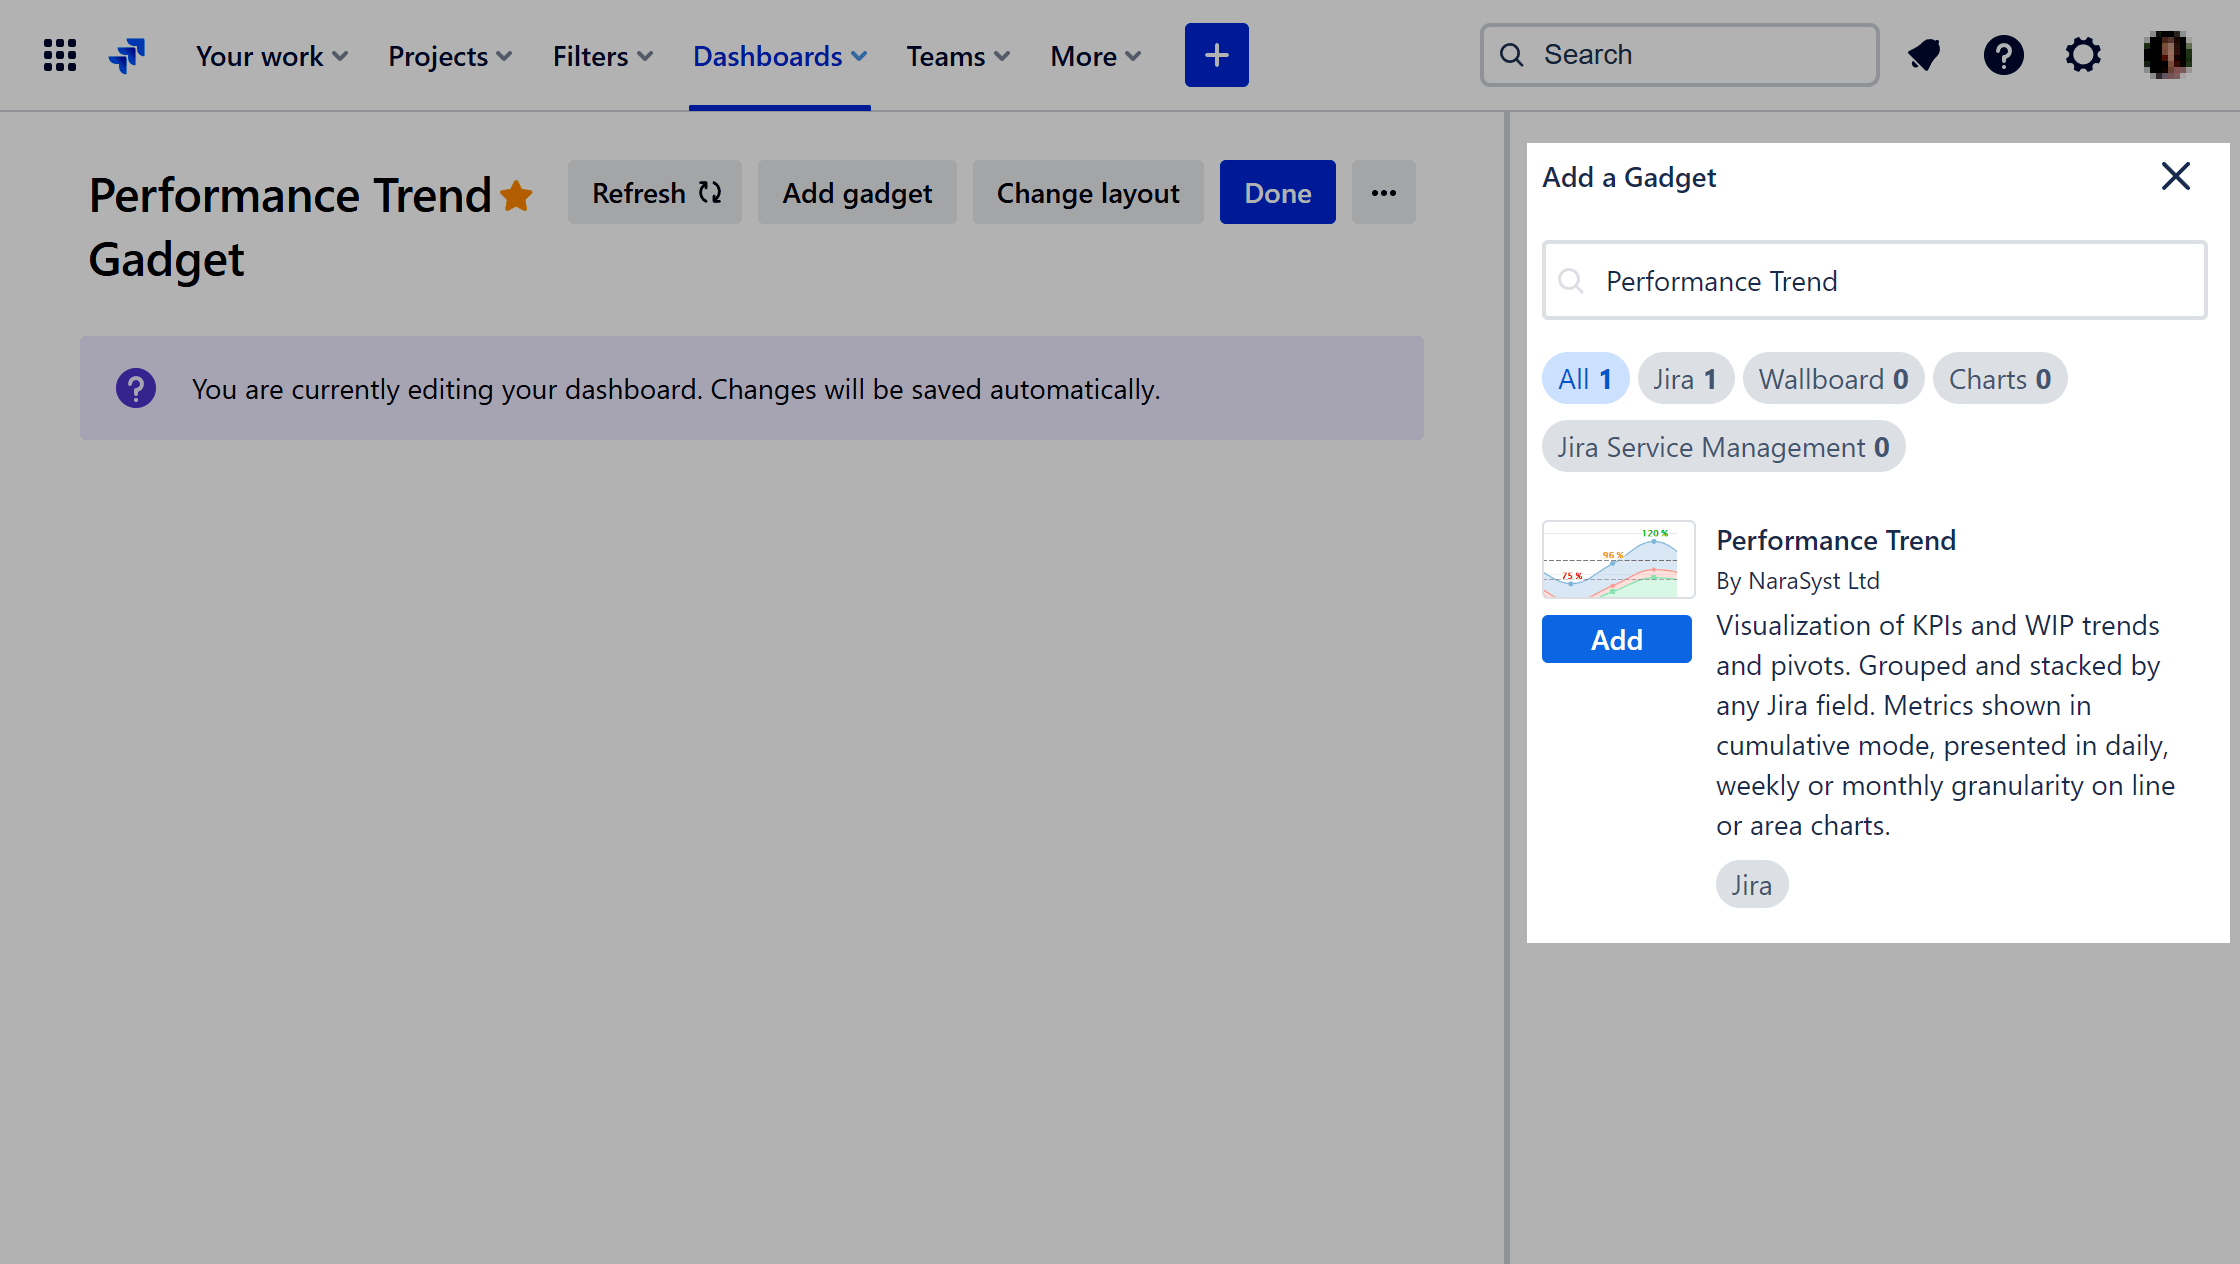
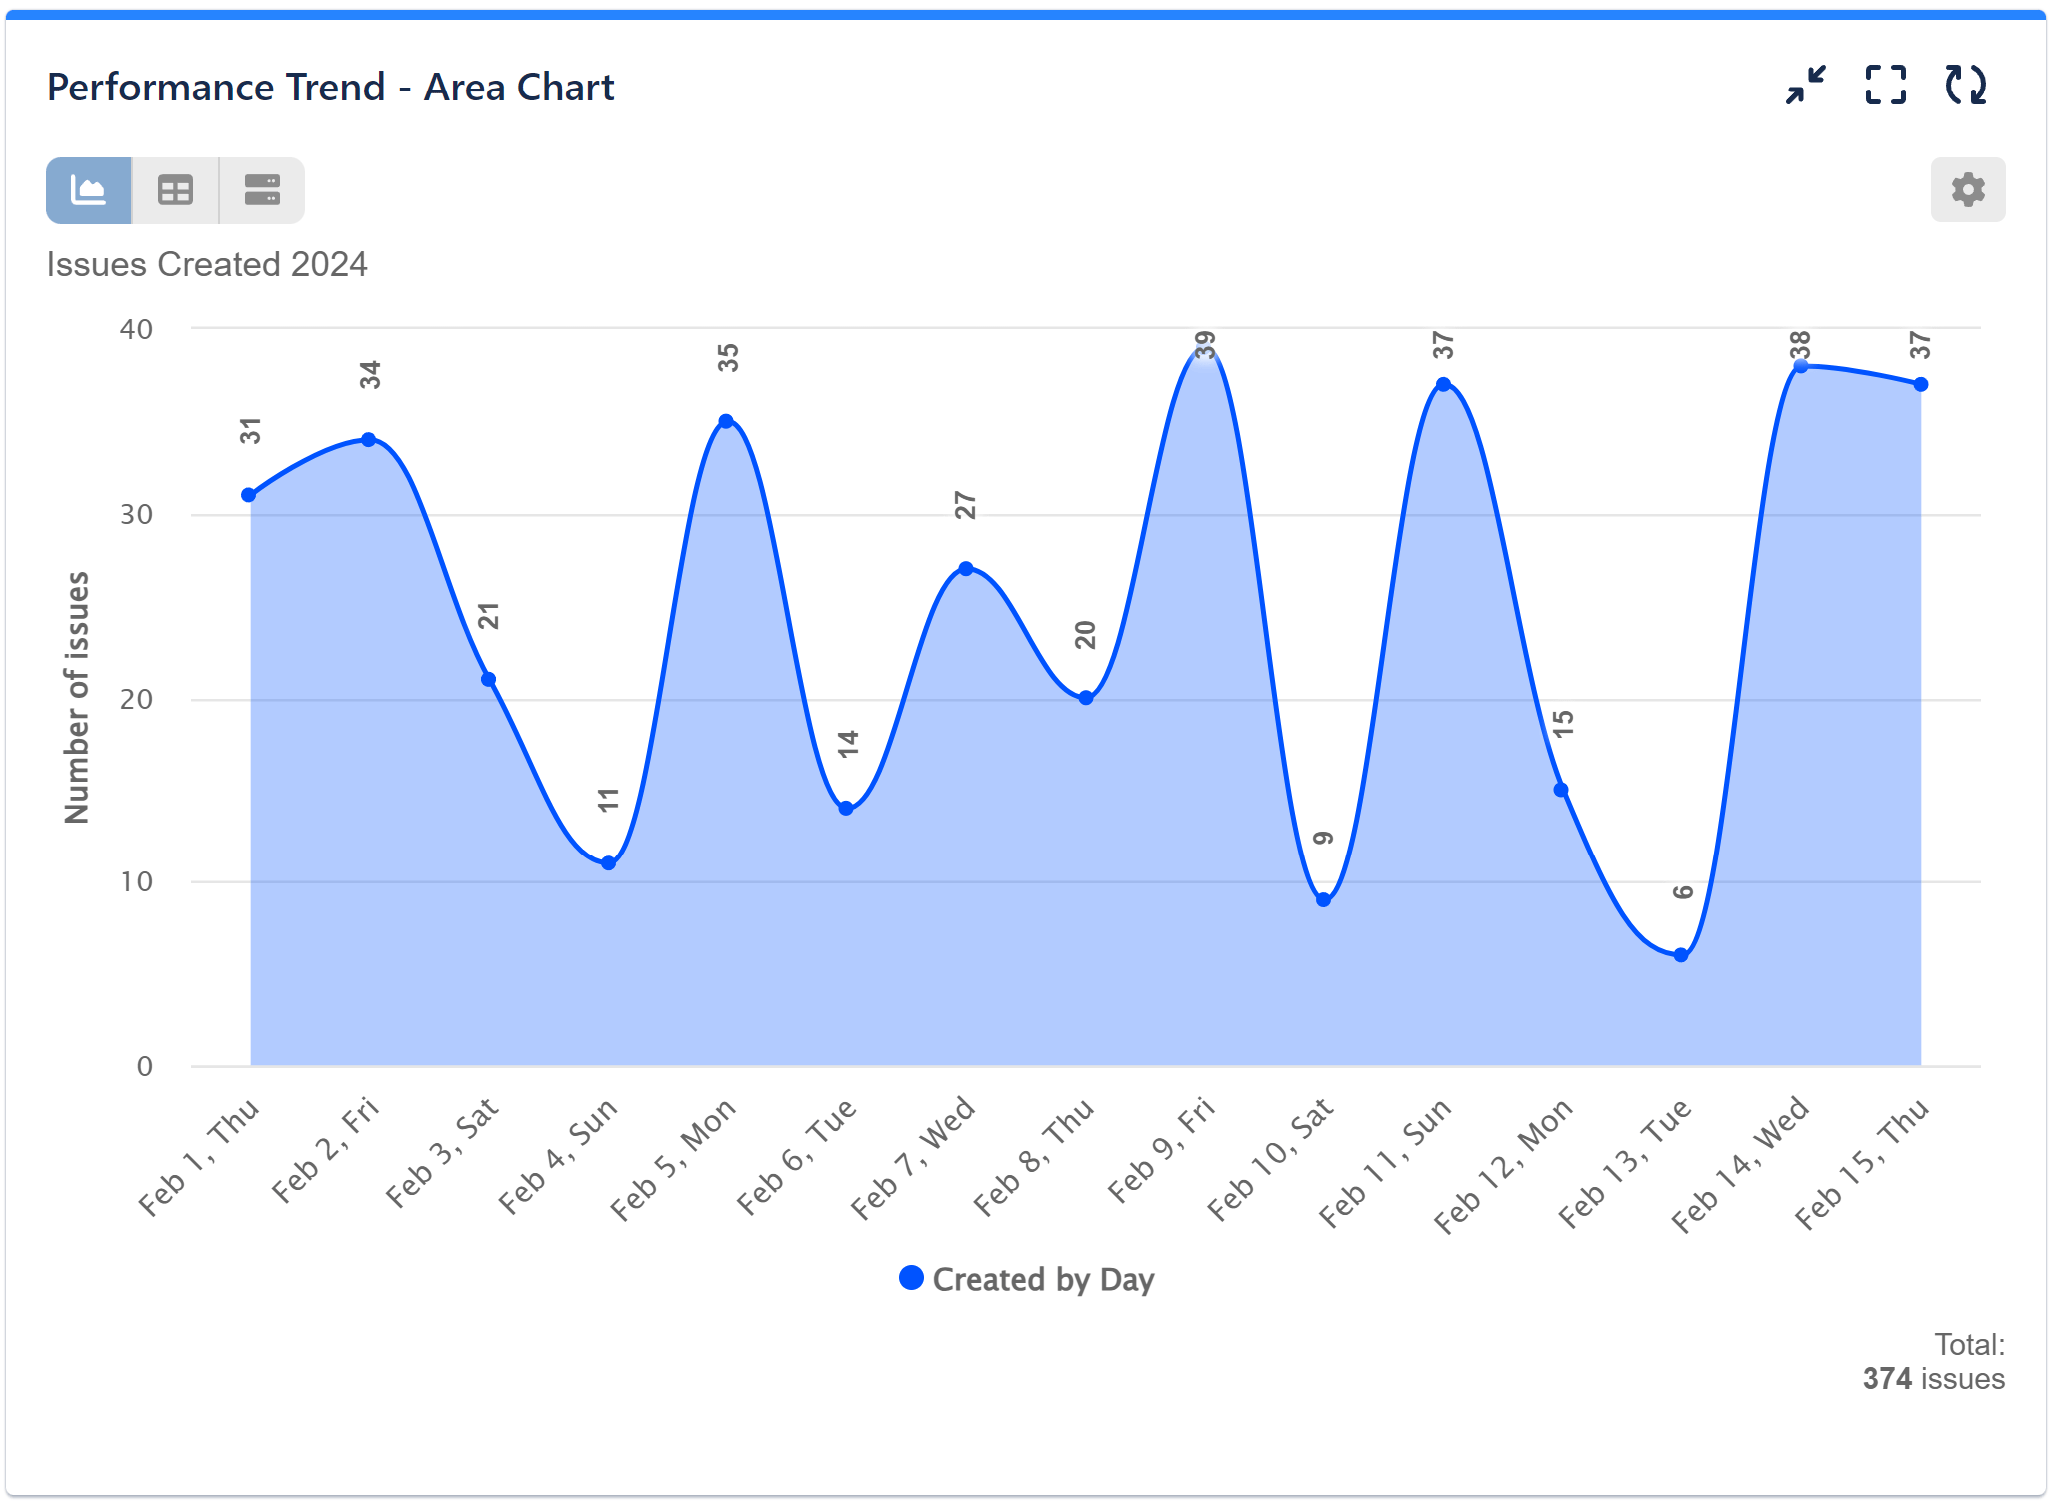
Introducing one of the 10 standalone Jira dashboard gadgets offered within our app: the Performance Trend Gadget. With a comprehensive set of features similar to our flagship Performance Objectives gadget, the Performance Trend enables users to leverage line and area charts to illustrate trends within their Jira data.
In this article, we’ll explore how the Performance Trend Gadget empowers your decision-making process through intuitive yet robust data visualization techniques.
Start your journey by adding the Performance Trend gadget to your Jira dashboard.
Exploring Performance Trend Gadget’s Key Features
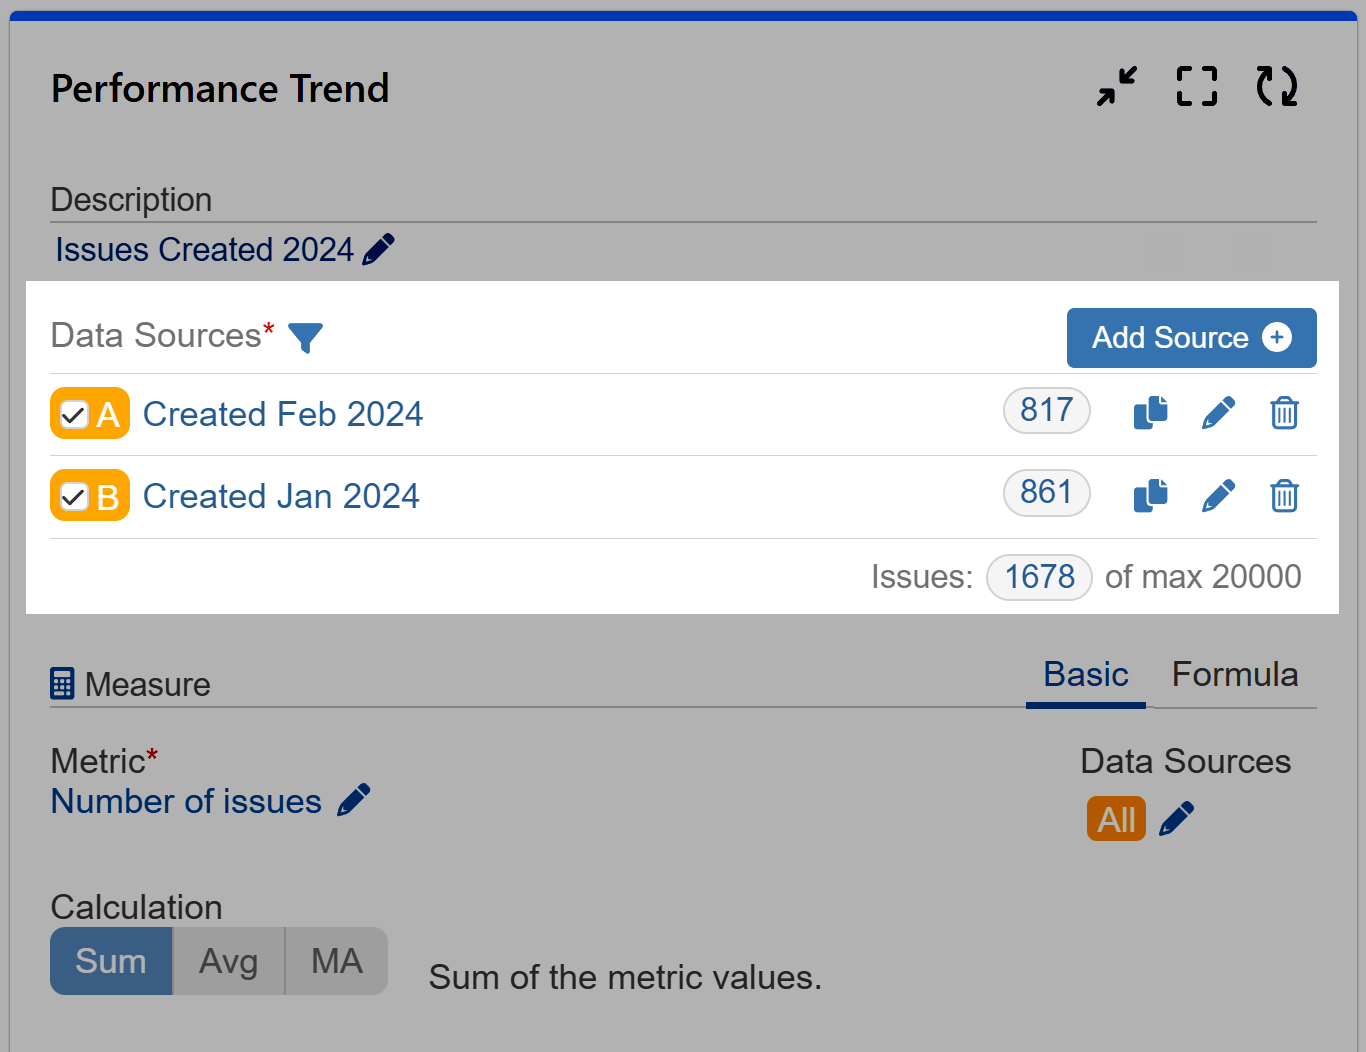
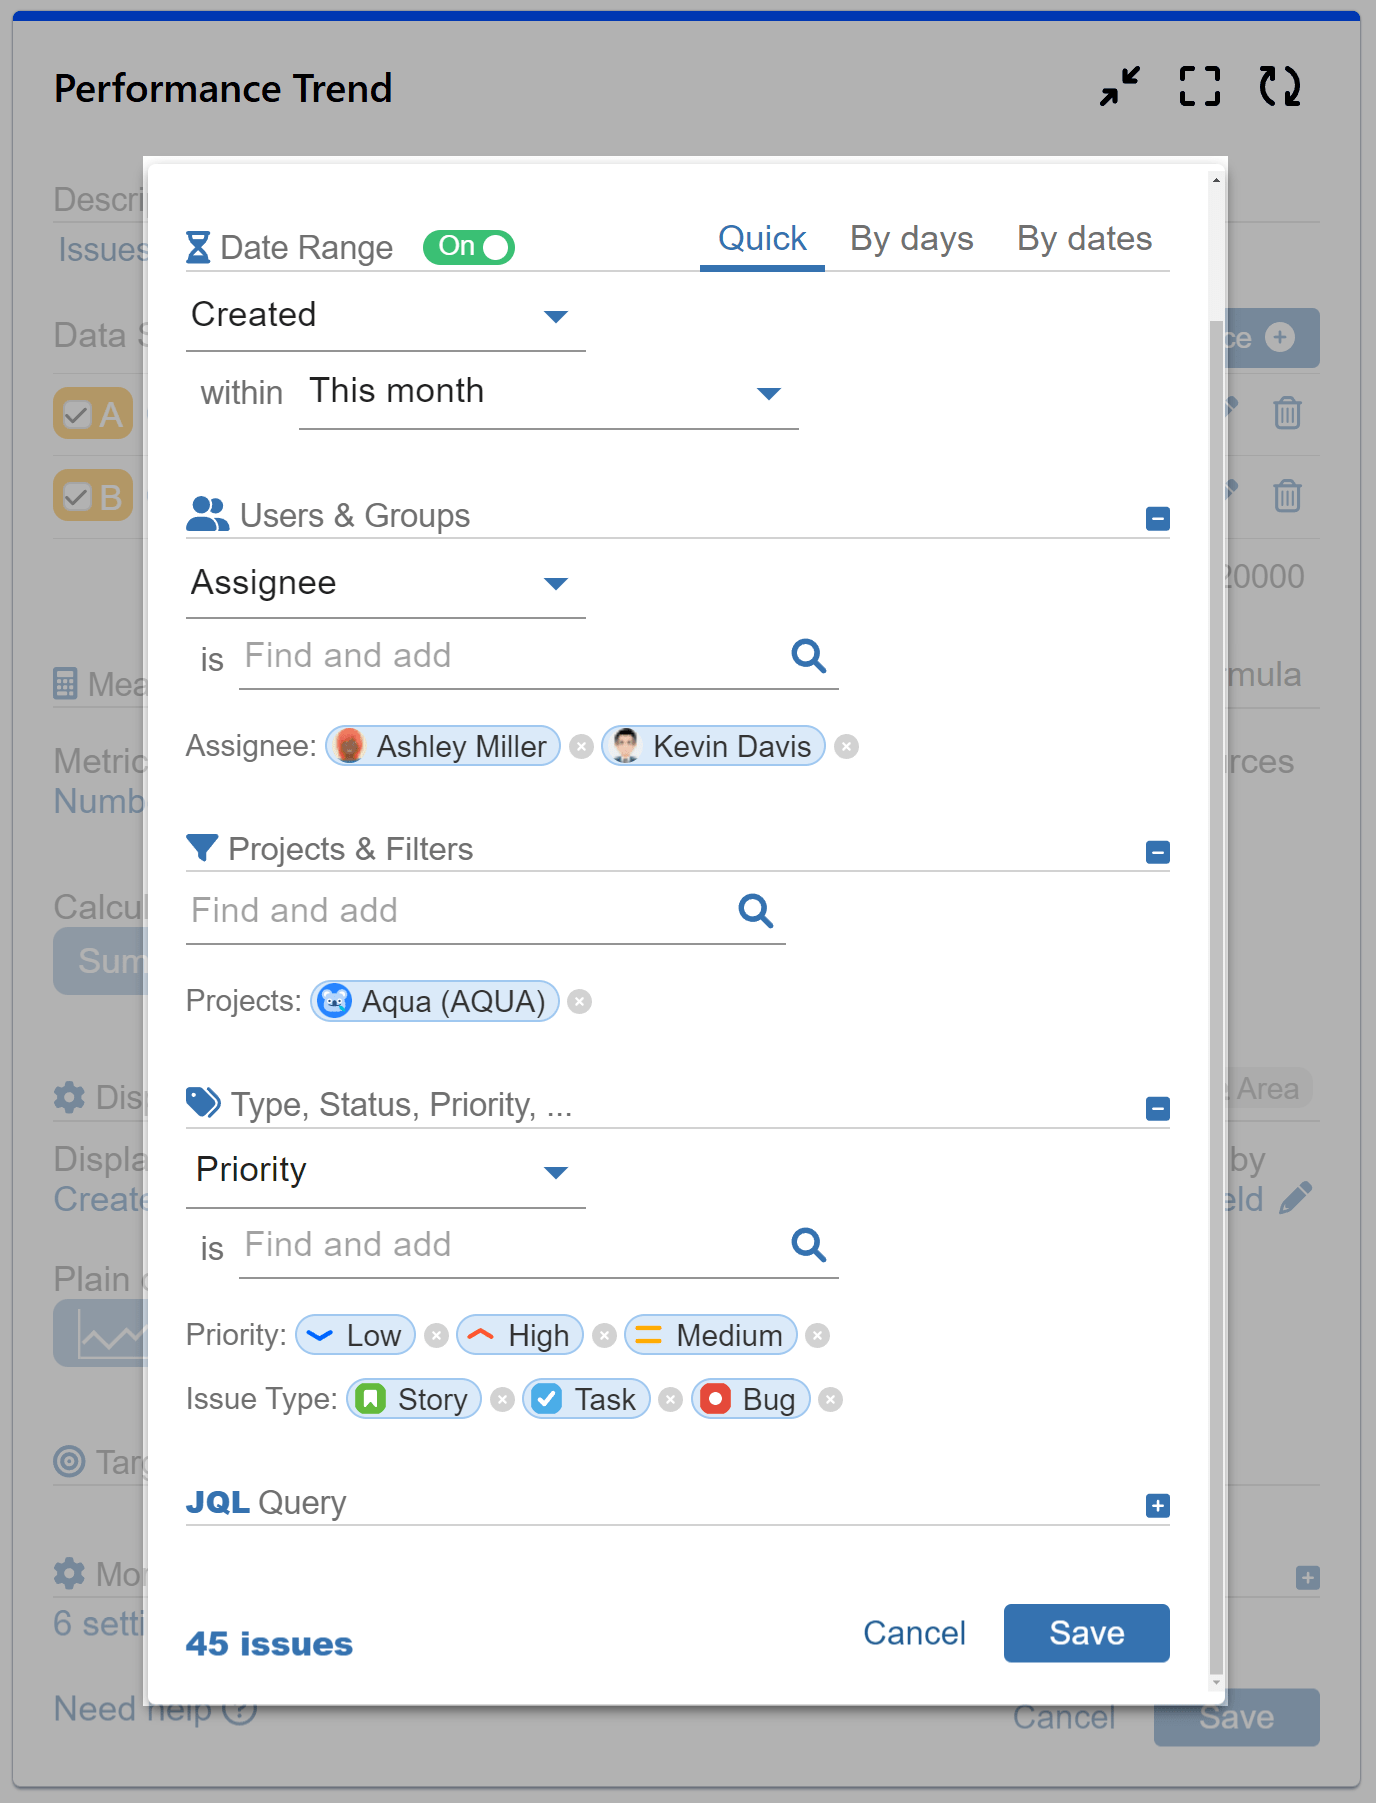
The Performance Trend stands as a worthy competitor to the Performance Objectives gadget, empowering users to seamlessly integrate multiple data sources and segment them effortlessly. Whether selecting predefined filters or choosing manual adjustments to customize the included data, the Performance Trend gadget replicates the functionality of its counterpart.
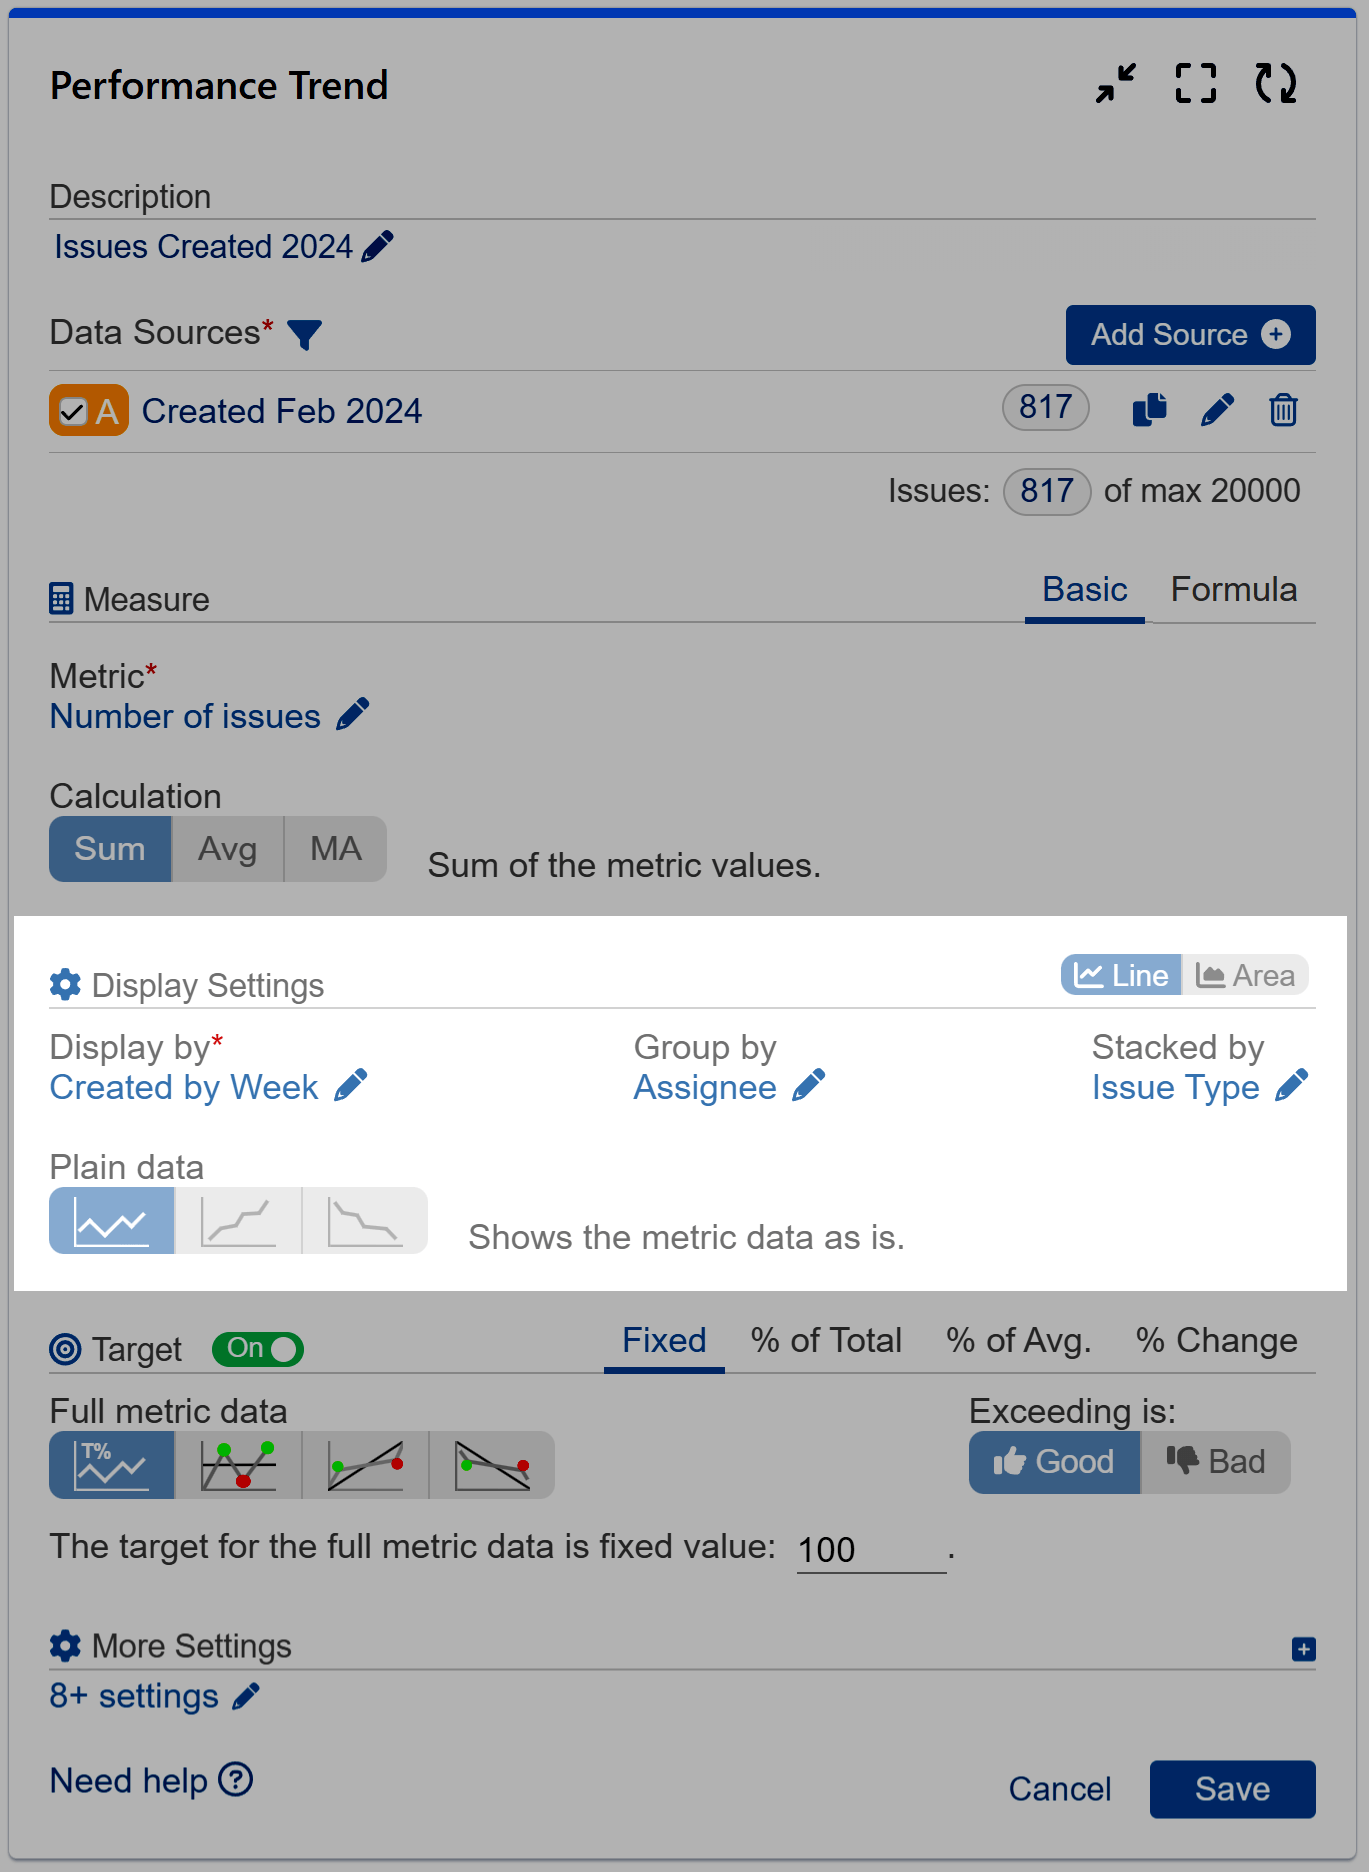
Similar to the Performance Objectives gadget, the Performance Trend enables users to group or stack data, adding a second dimension to visualizations for deeper insights into compositions.
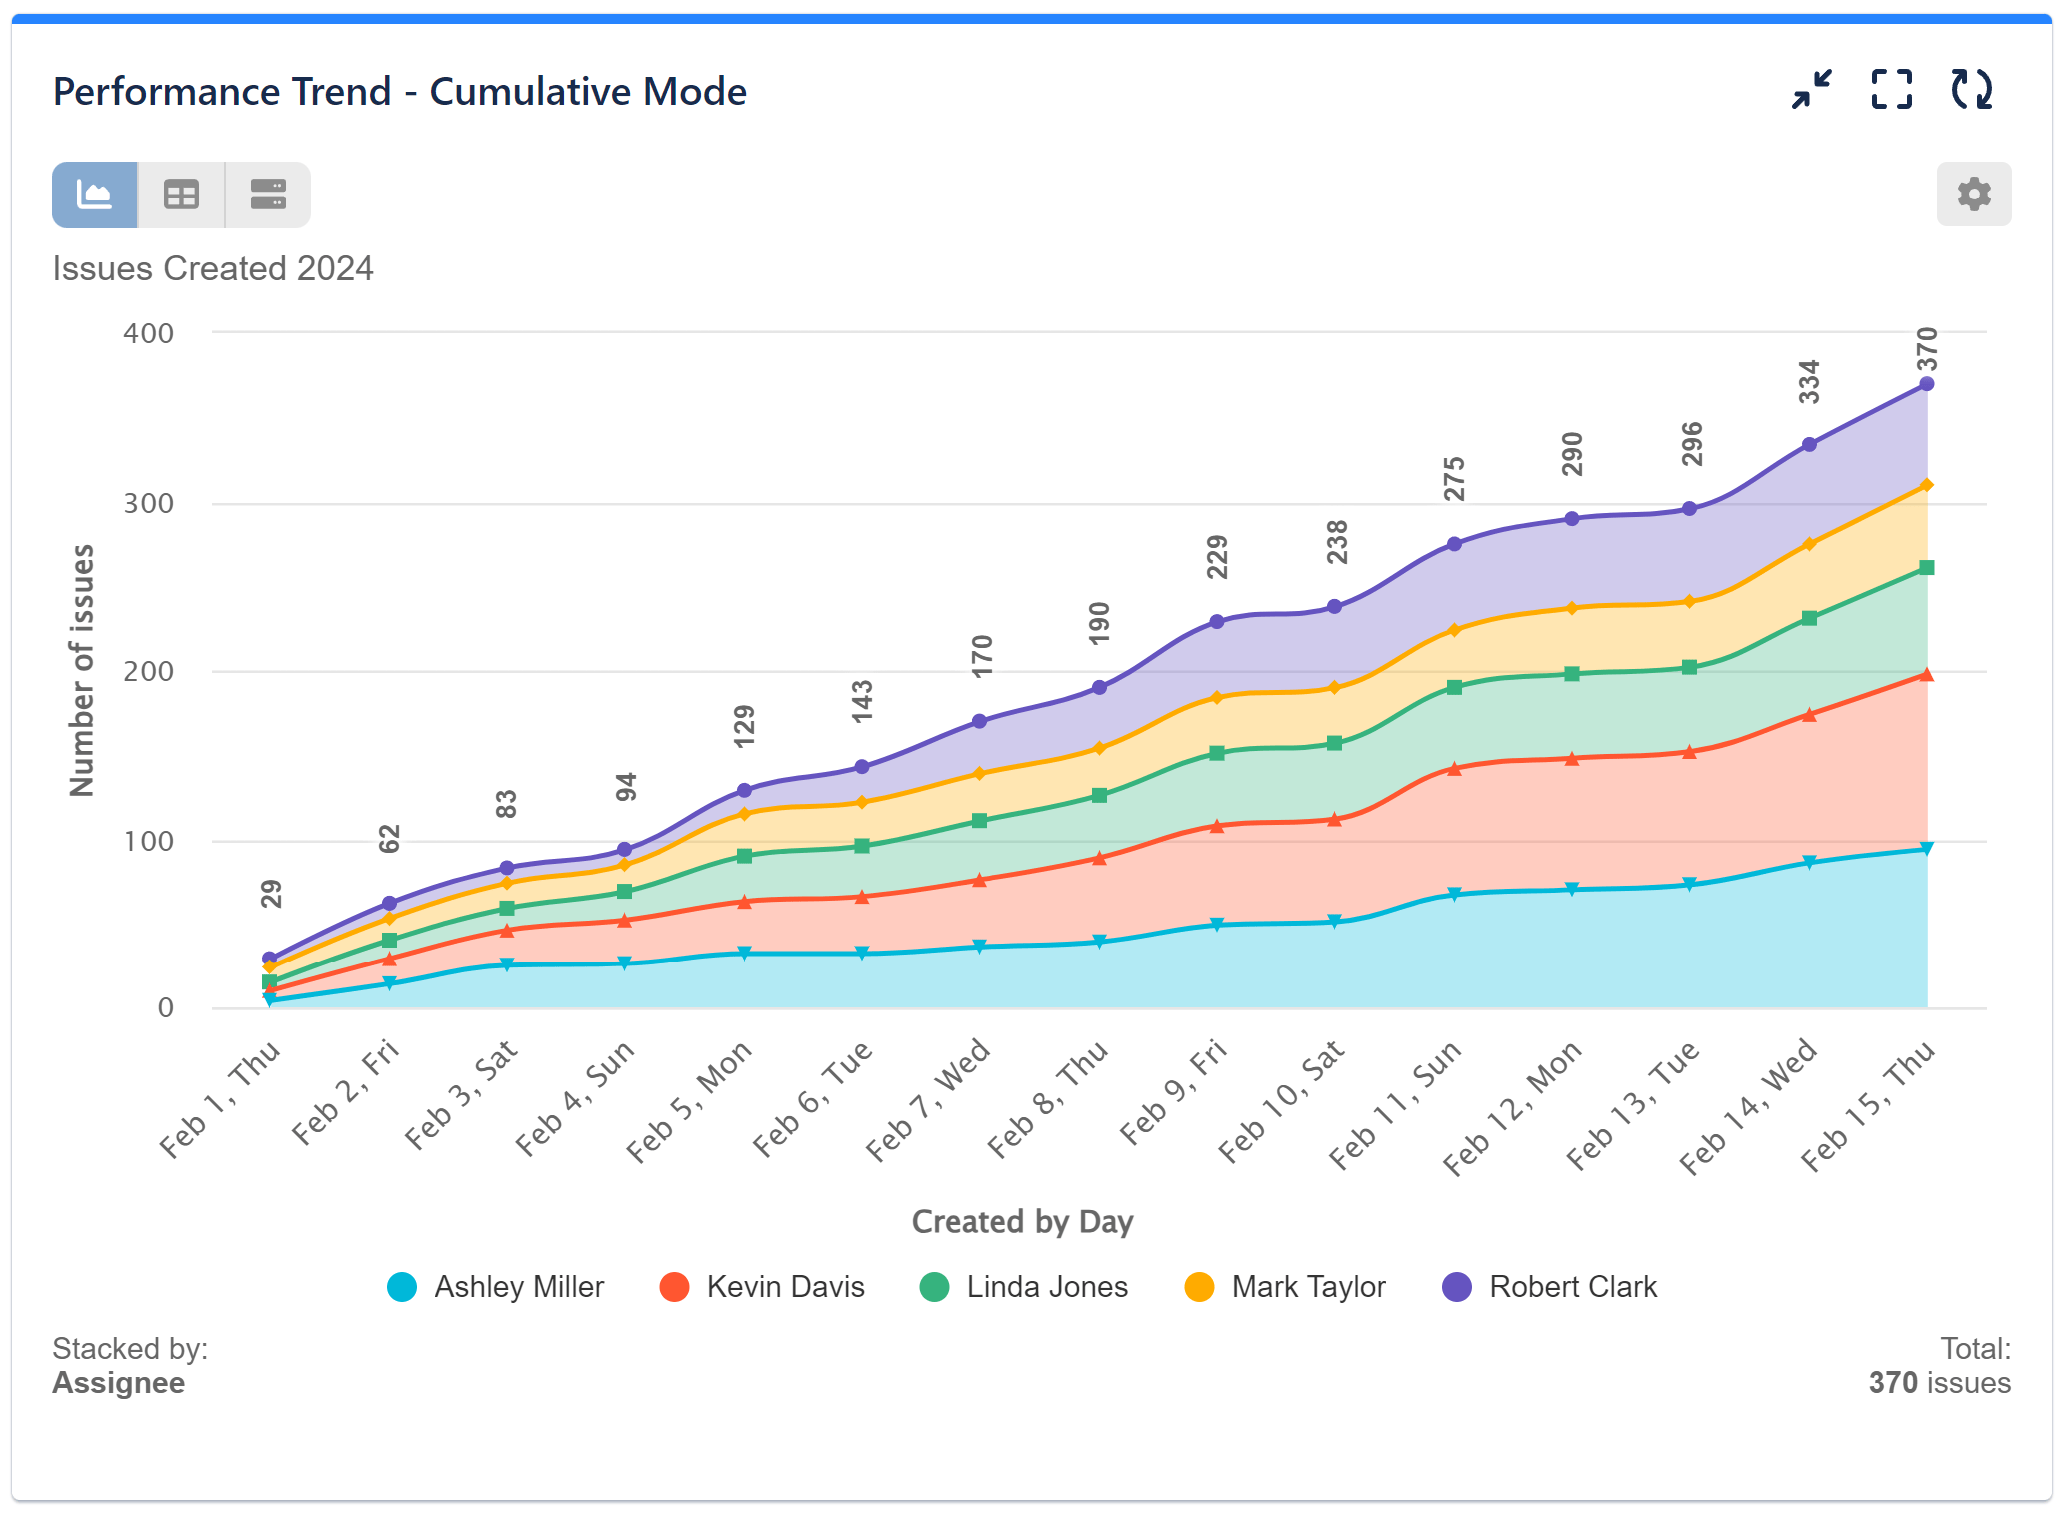
The gadget supports Plain, Cumulative and Declining modes, catering to diverse contexts and the specific insights users may require. Here’s an example of Cumulative mode in action:
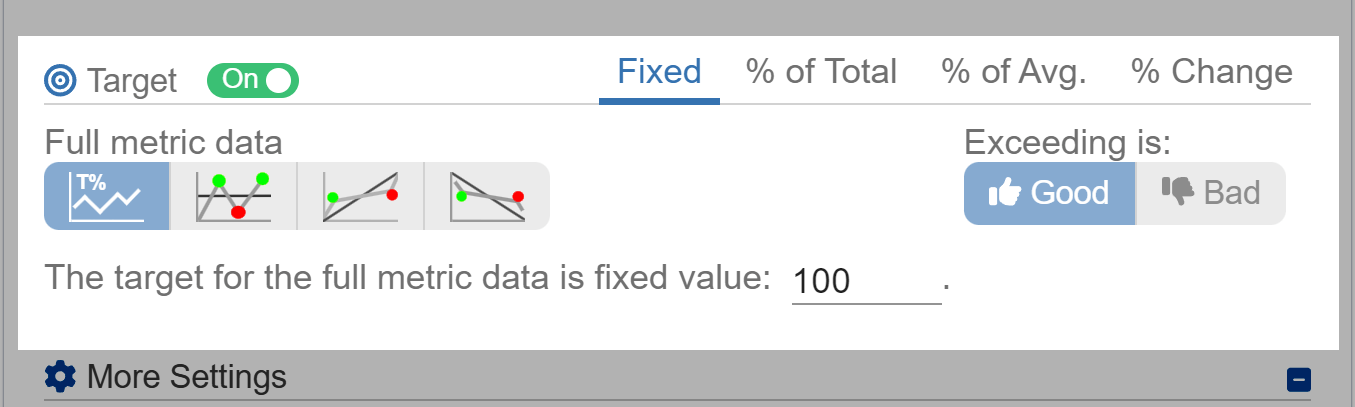
The Performance Trend gadget distinguishes itself with our advanced Target feature, offering users precise KPI calculations with just a few clicks, setting it apart from other Jira dashboard charting gadgets.
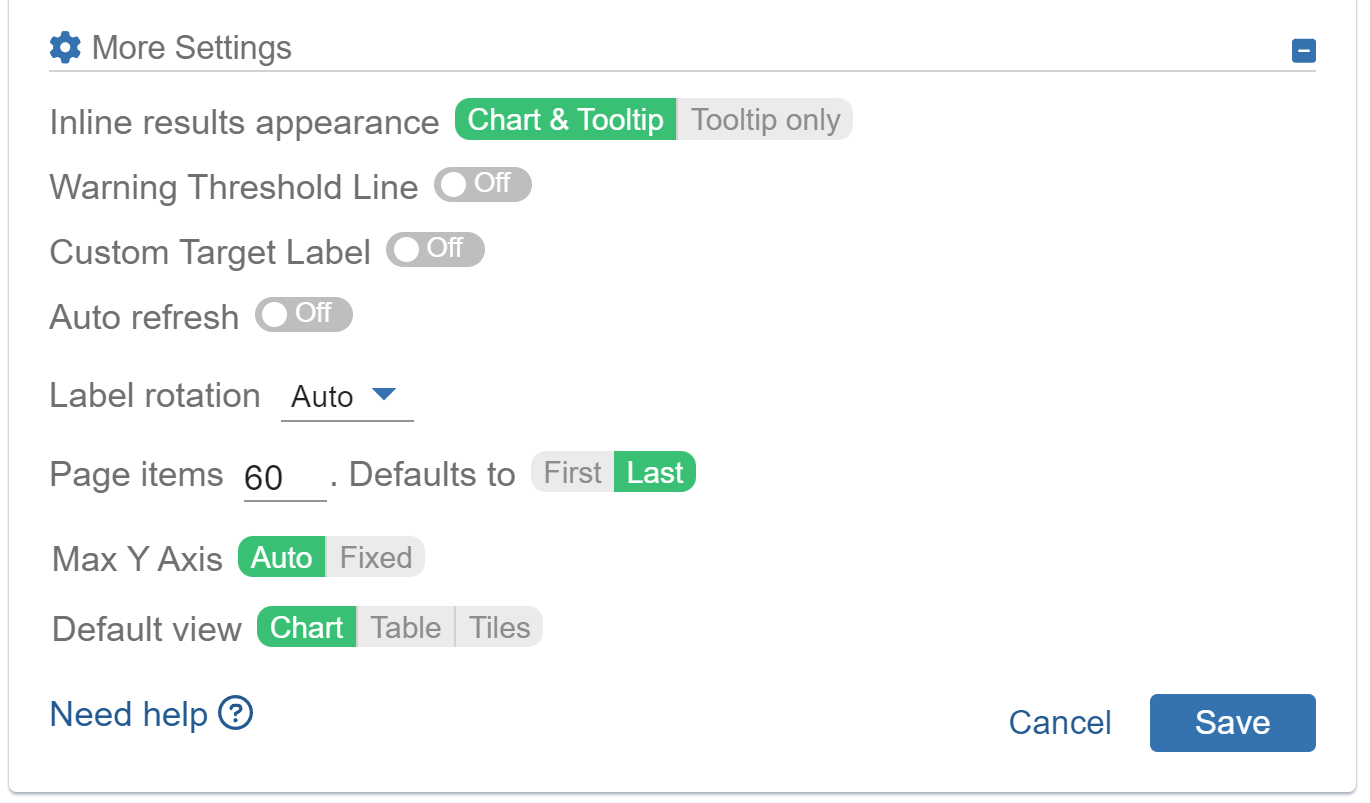
Moreover, users benefit from a high degree of flexibility with the Performance Trend, which offers numerous customization options to personalize each chart according to their preferences. Easily modify chart colors from the chart or switch to Tiles view with captivating Sparkline or Pivot Table view for precise data examination.
Jira Dashboard Gadgets: Performance Trend vs. Performance Objectives
However, what truly distinguishes the Performance Trend gadget from the flagship Performance Objectives gadget?
When considering between the two gadgets for your Jira dashboard, two key factors come into play:
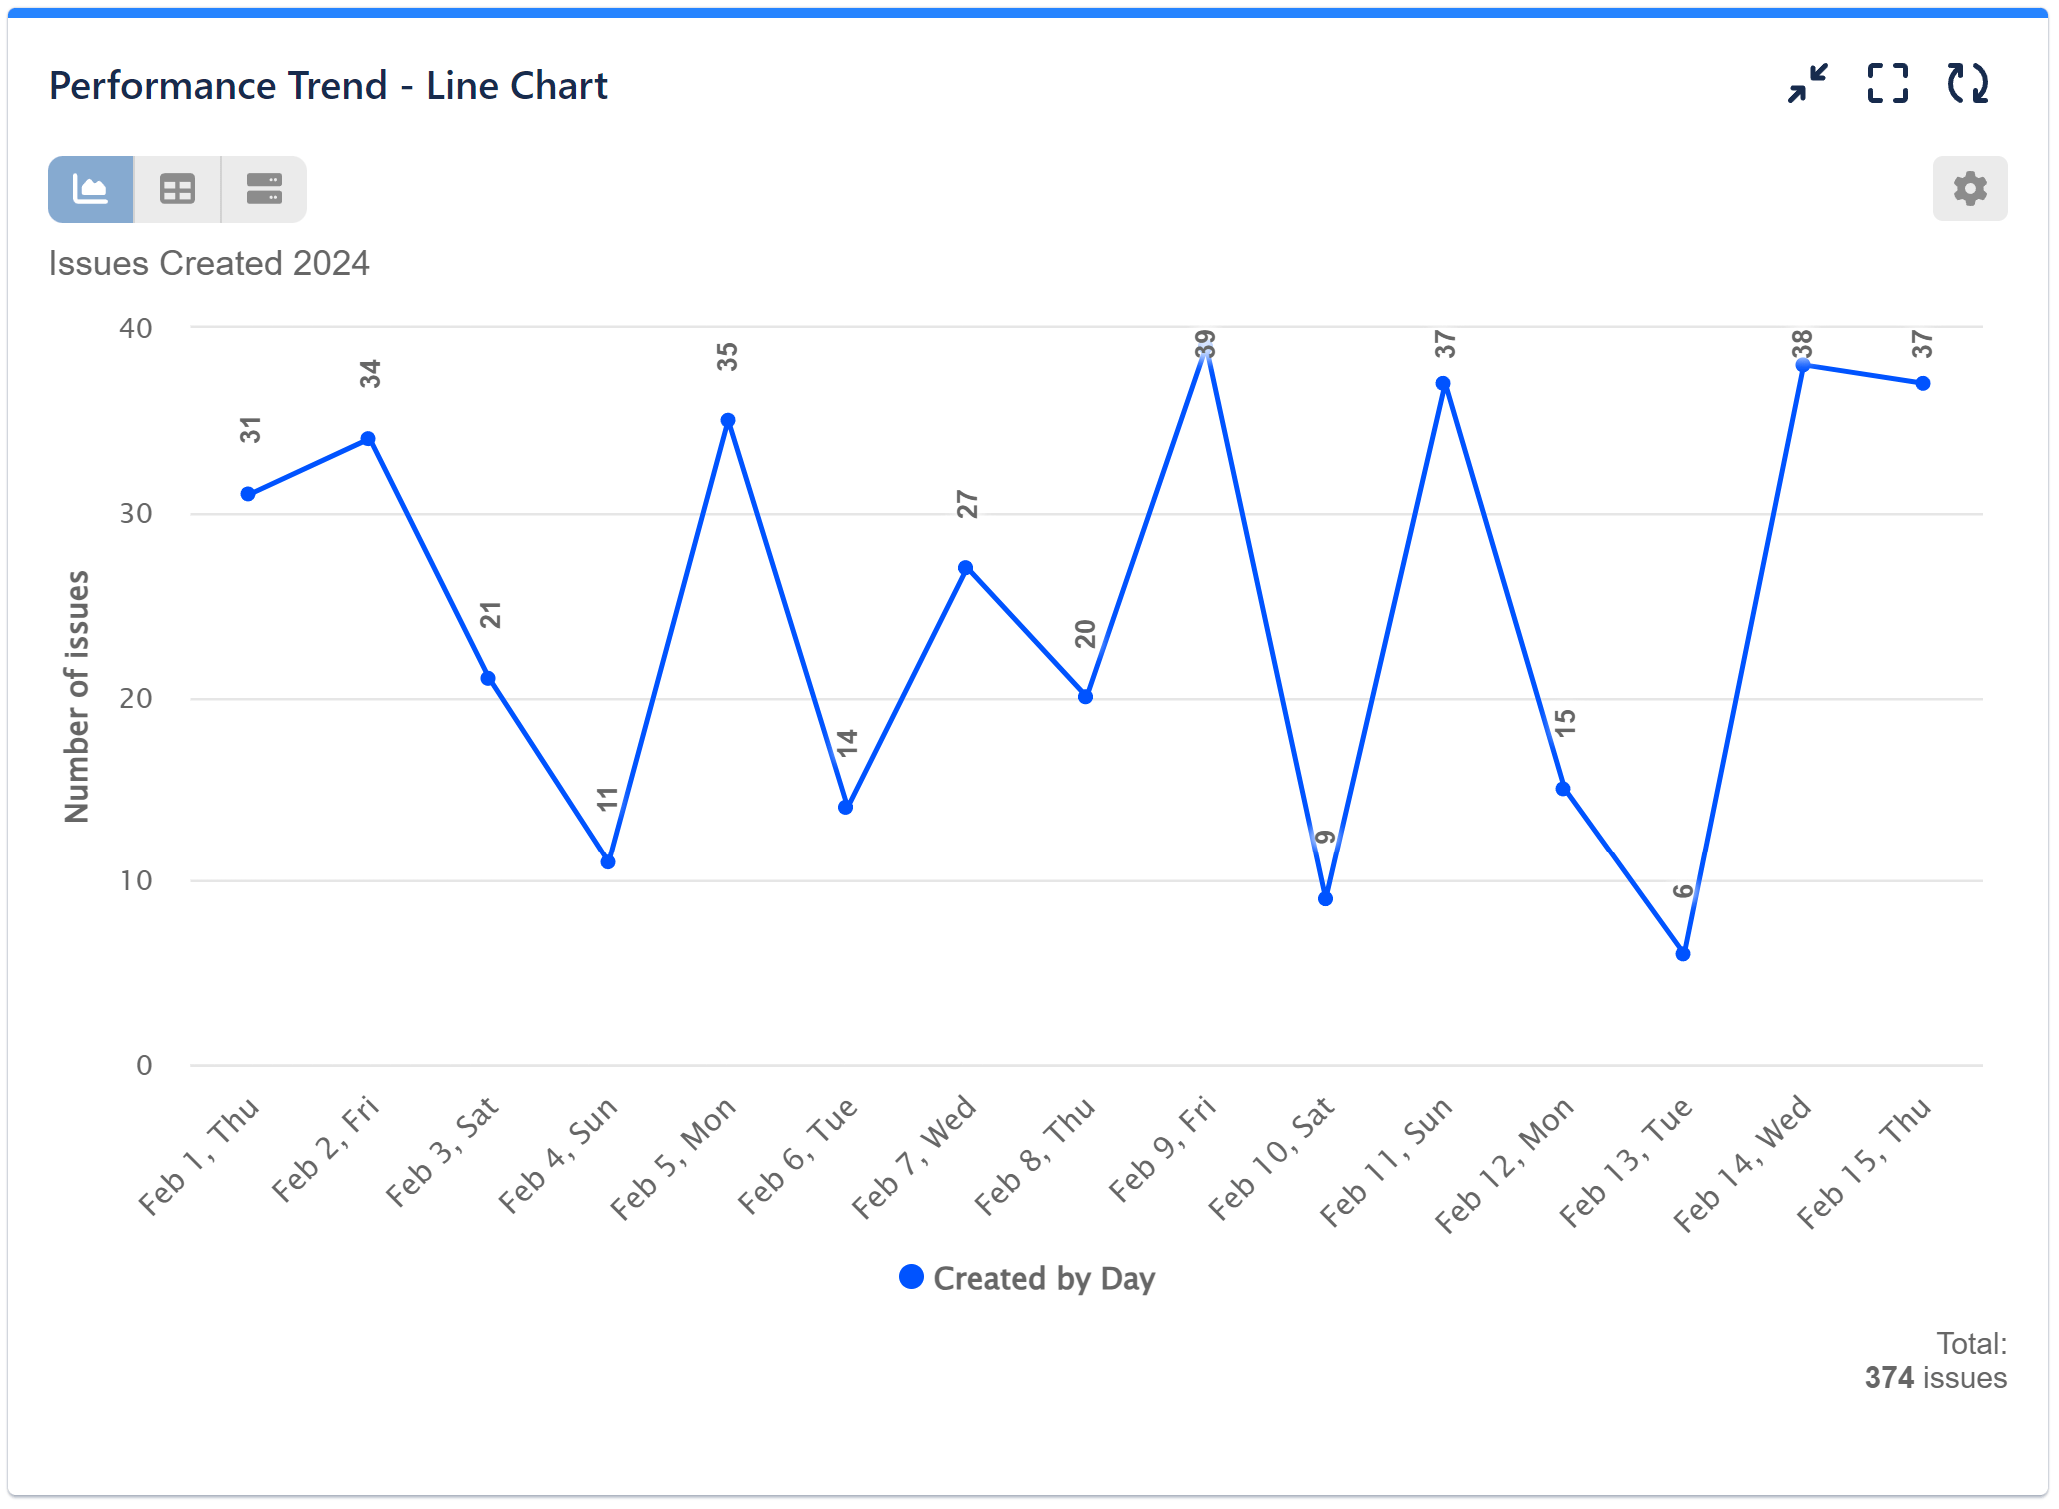
Firstly, while the Performance Objectives gadget supports bar and column charts, the Performance Trend favors line and area charts.
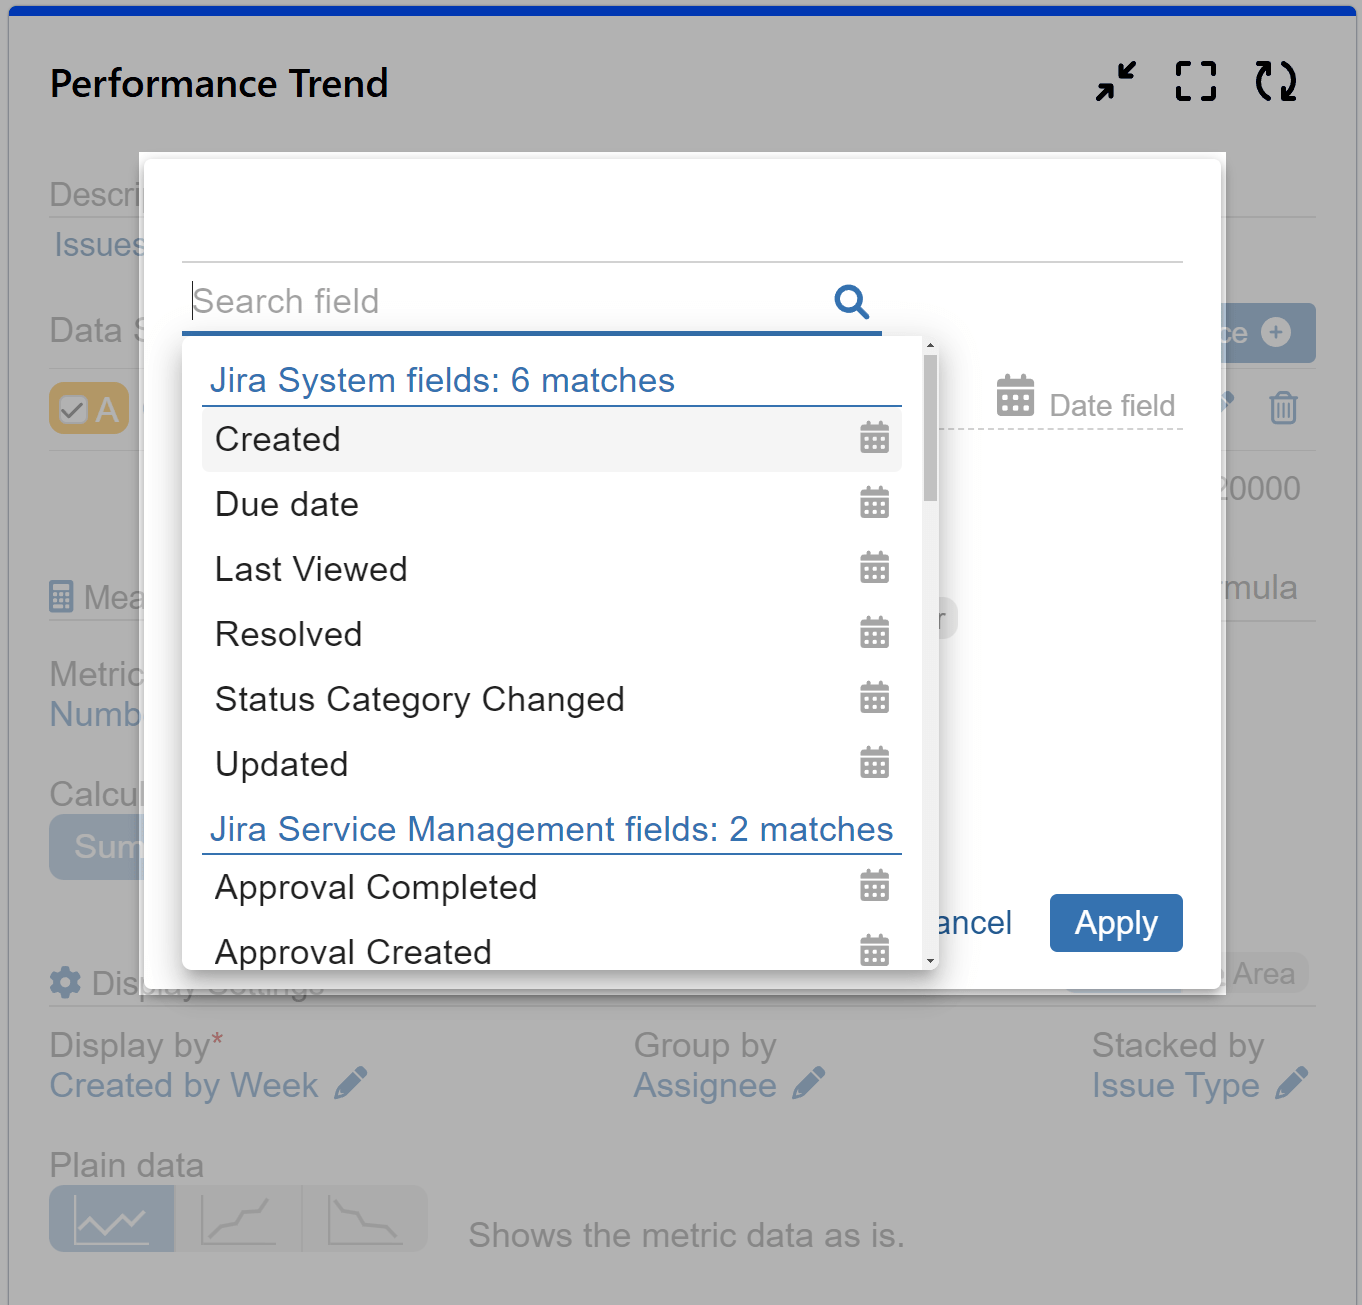
Secondly, the Performance Trend gadget offers a selection of Date type fields for Display by, mandating that the items on your x-axis must be dates. Conversely, the Performance Objectives gadget provides a wider array of display by fields, including date, number, user, time, and text fields.
In simple terms, your decision to use the Performance Trend gadget depends on the kind of analysis you need and the type of data you have.
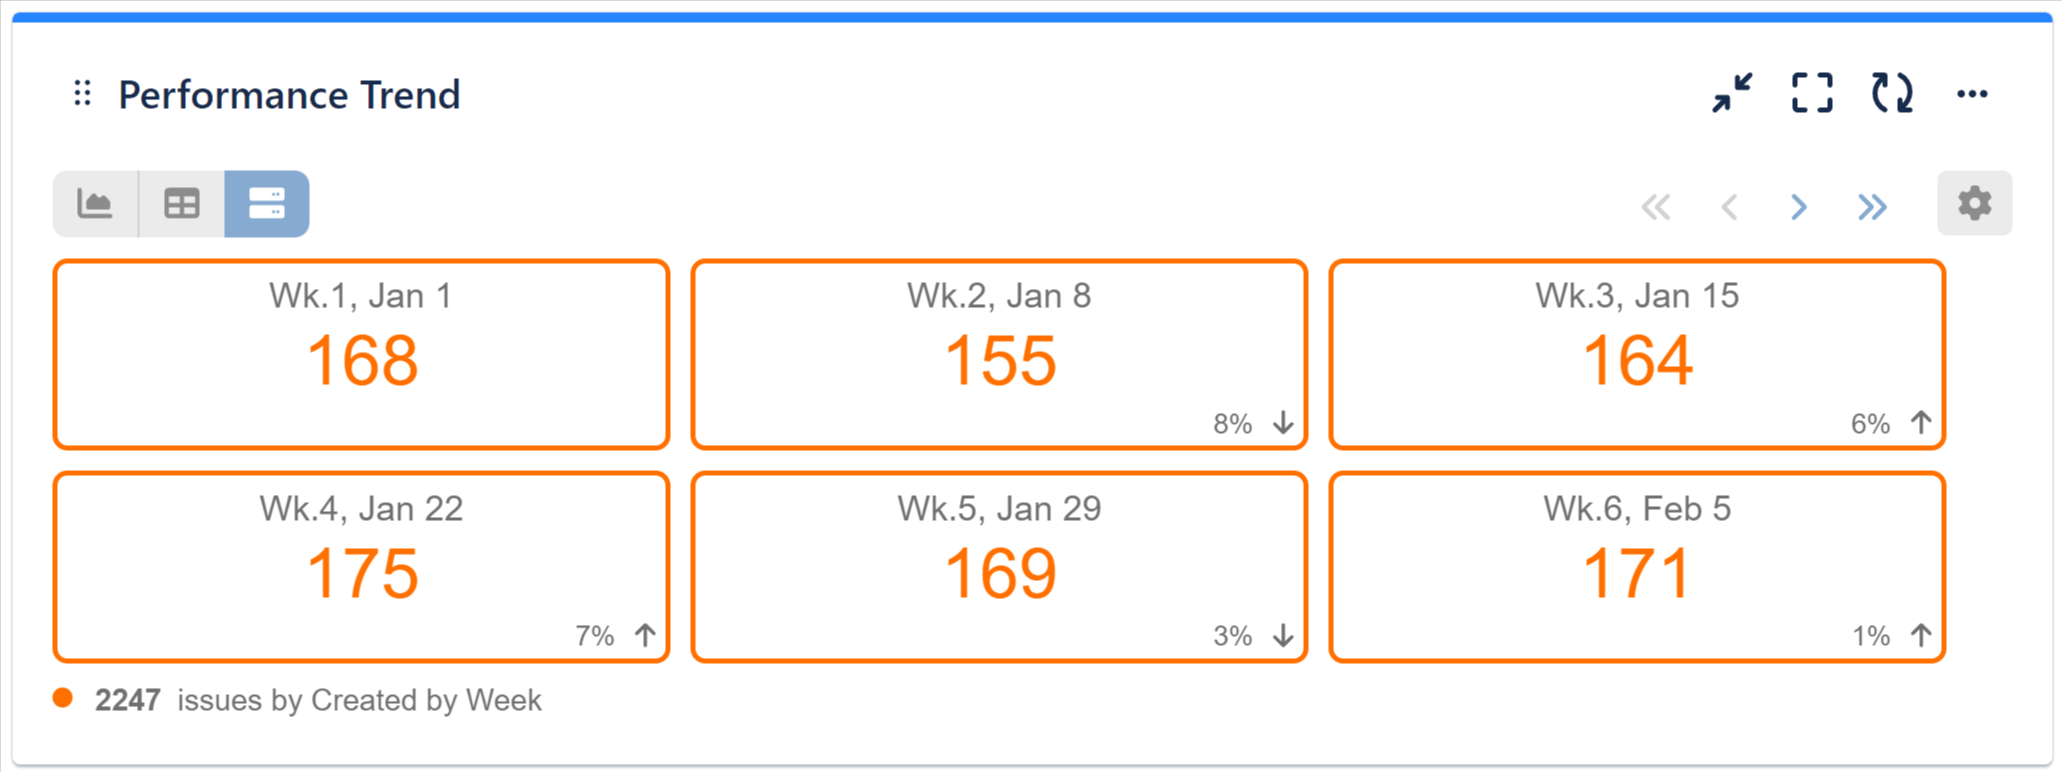
Leveraging % Change Indicator with Jira Date-Type Fields in Tiles View
When you choose to see your Jira data in Tiles View, our Performance Trend gadget provides additional insights for better analysis. All date-type fields available and selected for “Display by” (or the x-axis of your chart) include a percent change indicator. This indicator uses the first date segment displayed on the chart as the starting point for its calculation, and each subsequent value shows the change from the previous one.
Performance Trend Gadget in Action: Two Use Cases
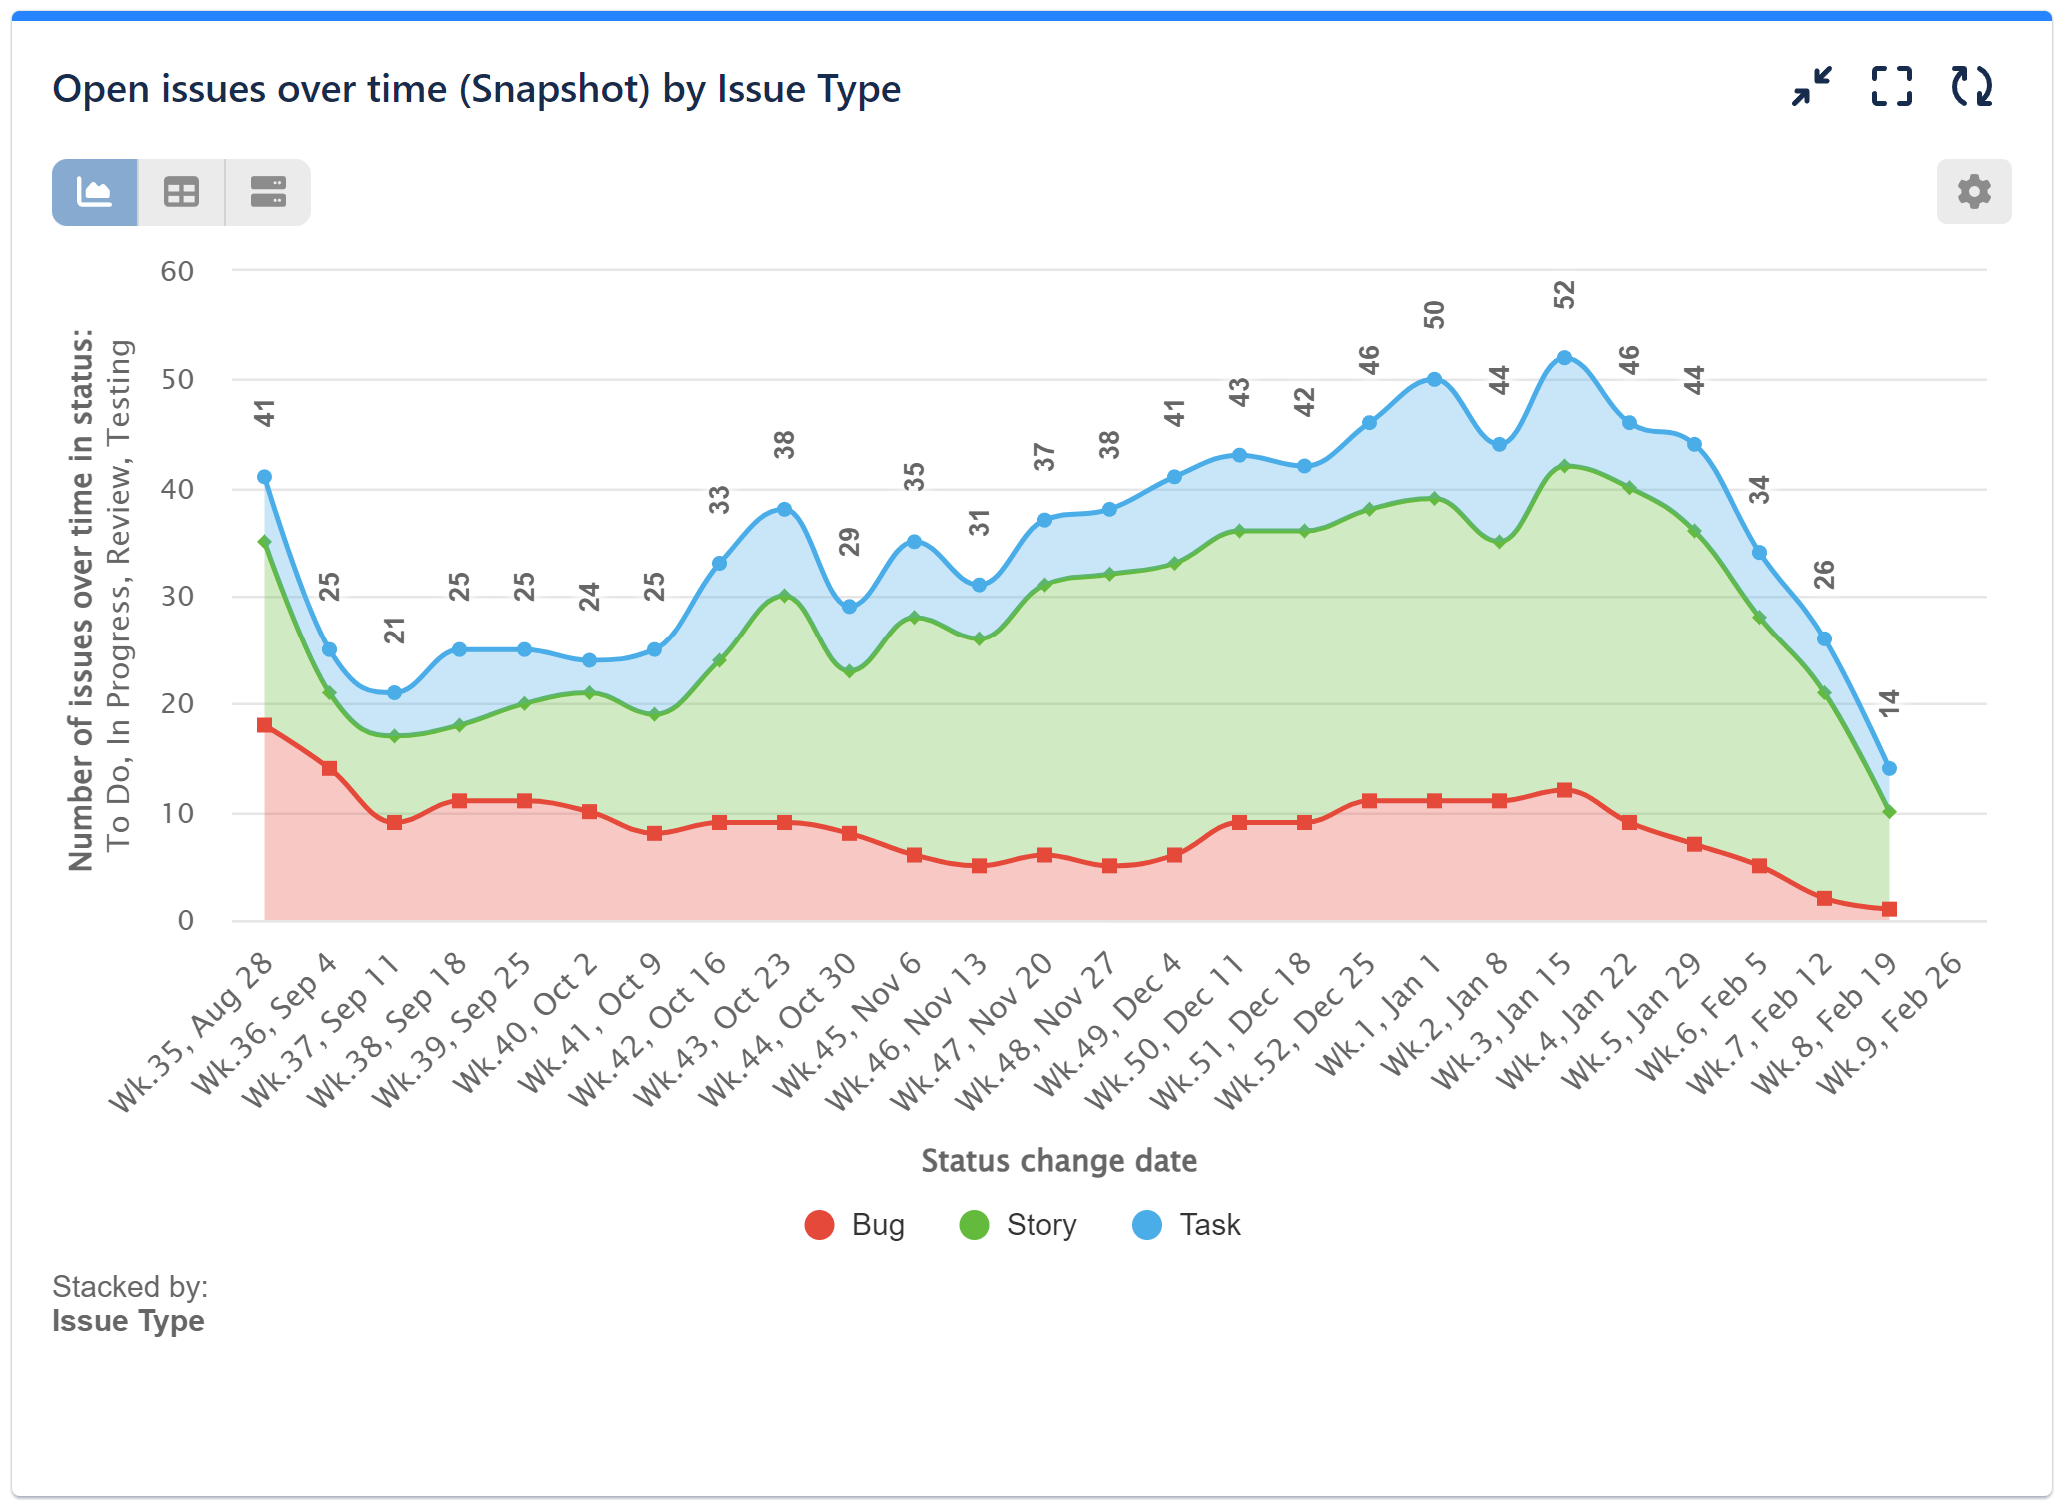
In this section, we unveil the capabilities of the Performance Trend gadget in visualizing trends and patterns within your data, demonstrated through two compelling examples.
The first sample report is an “Open issues over time by Issue Type” area chart. This visualization tracks the progression of open issues across three issue types – Bug, Story, and Task over time, offering a clear understanding of how different categories of issues evolve.
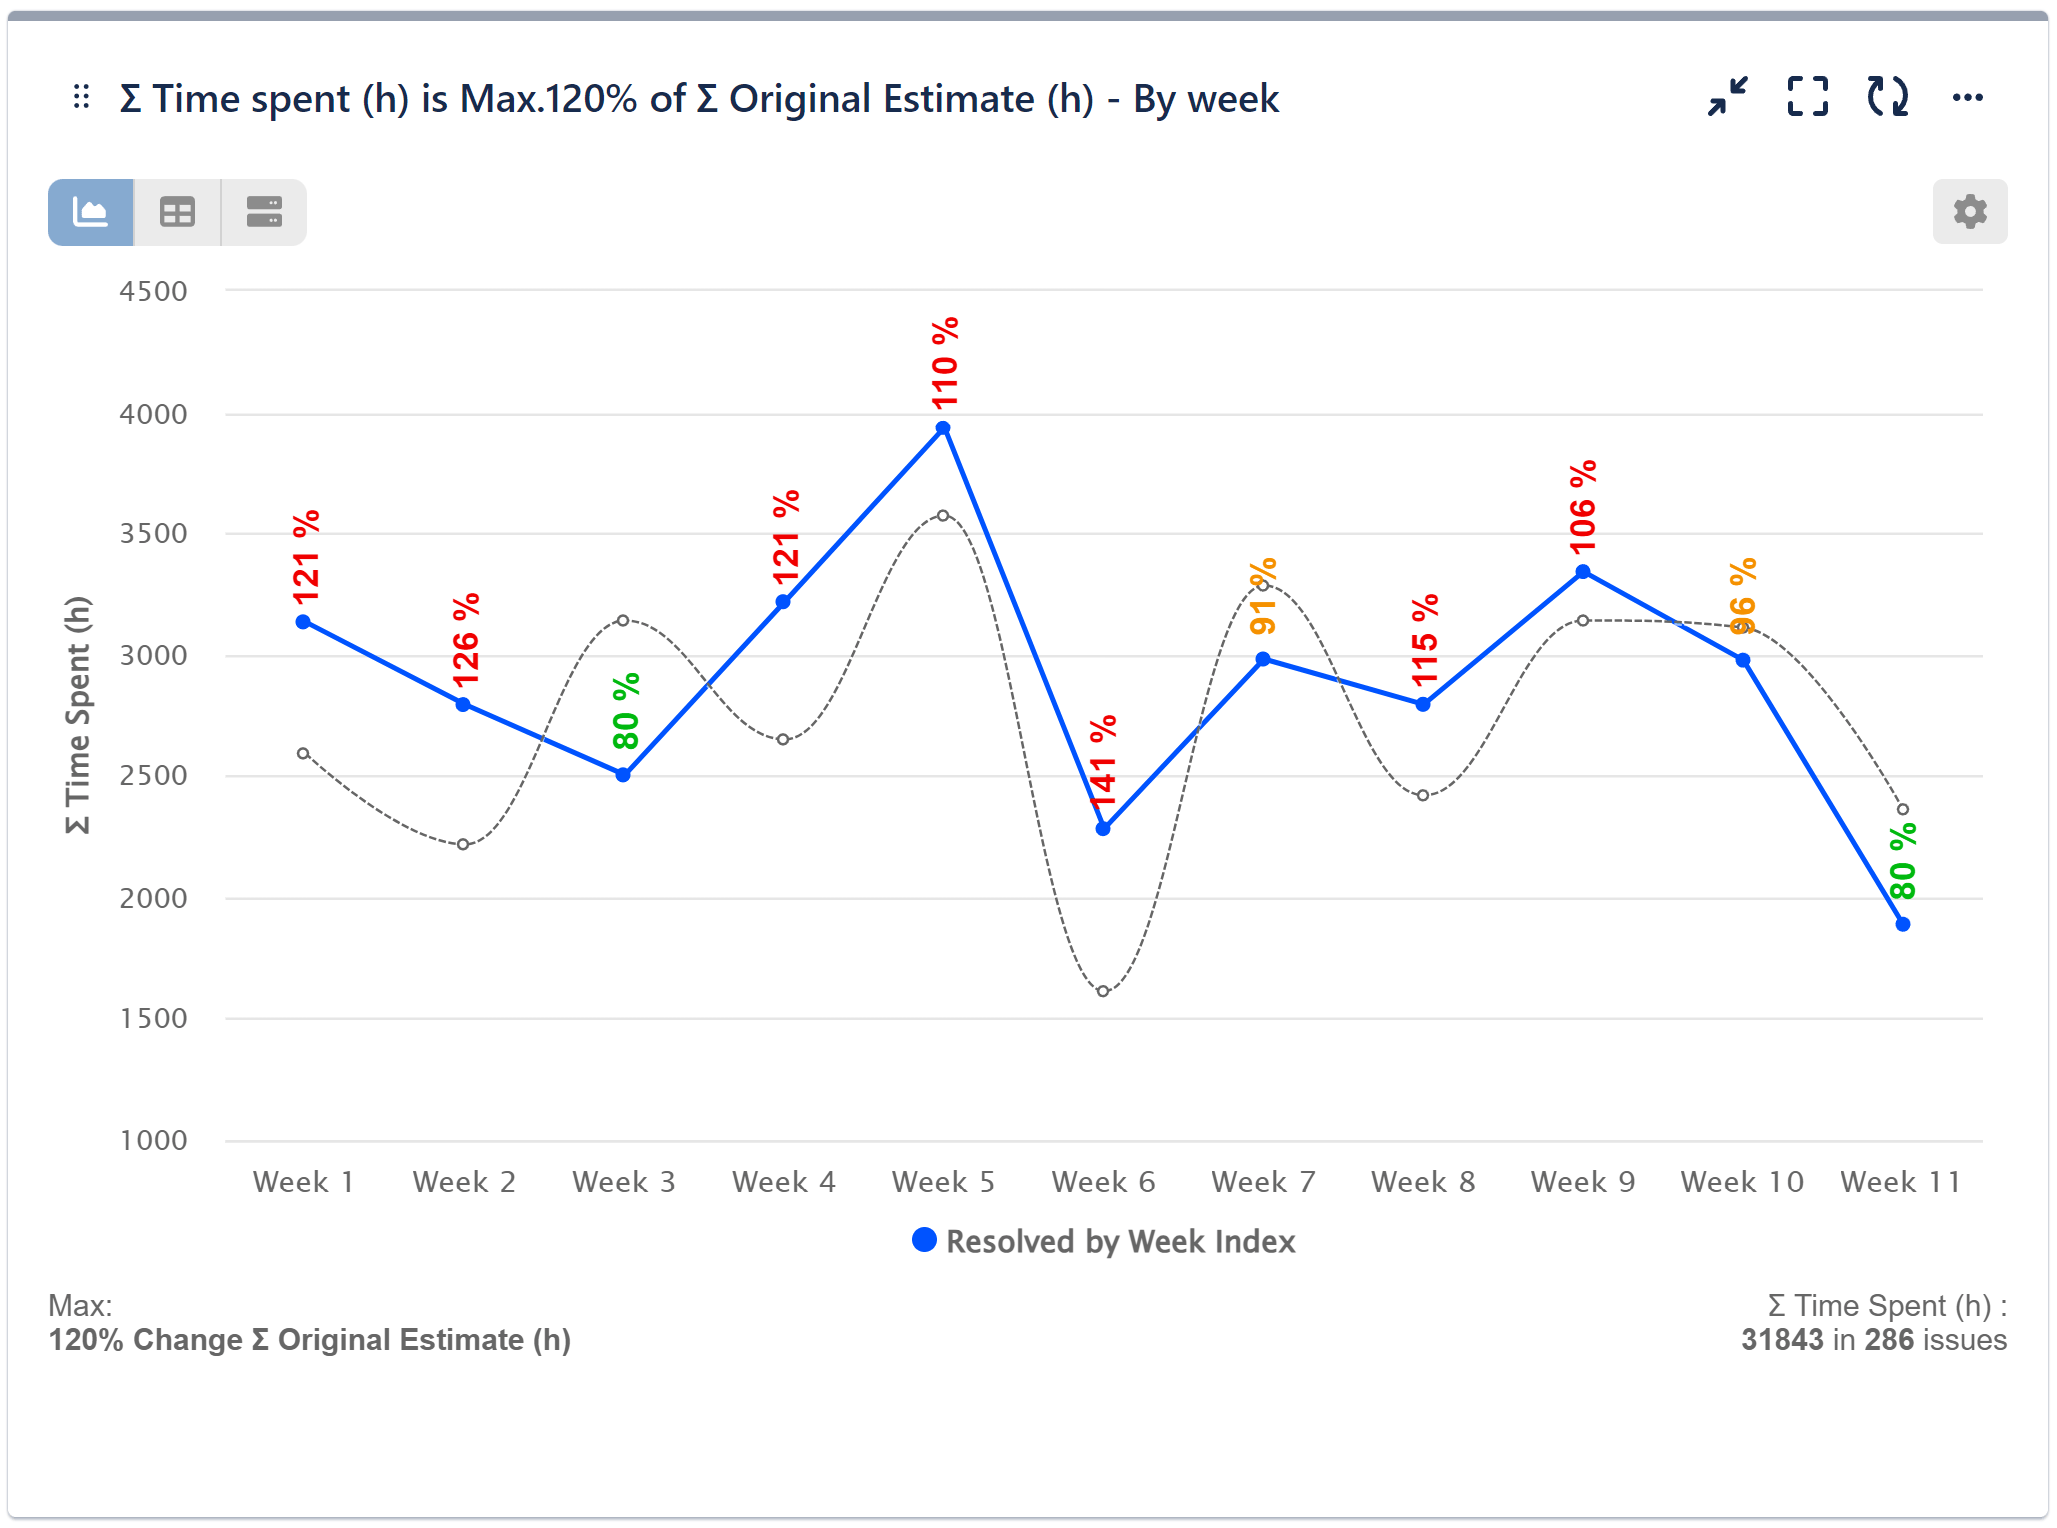
The second chart presents a “Sum time spent (h)” report, depicted as a line chart with applied targets. The chart effectively compares the total time spent on tasks against the original estimated time, ensuring that if the sum of time spent exceeds the maximum set at 120% of the sum of the original estimate, it will be clearly noticeable and marked in red. Resolved issues are displayed by Week Index.
If you’re interested in exploring the capabilities of the Performance Objectives gadget, please refer to our dedicated article. Additionally, here are some example KPI reports created using the Performance Trend gadget to inspire you. If you require assistance and consulting to determine the best-fit dashboard gadget and configuration for your needs, feel free to reach out to our support team.
Start your 30 days free trial of Performance Objectives: Charts for Jira from Atlassian Marketplace.