Table of Contents
Introduction
In today’s dynamic business landscape, maintaining effective ITIL practices is crucial. However, integrating real-time monitoring through informative dashboards elevates this importance even further. In response to inquiries from the Atlassian community, this article will demonstrate how to create custom fields and automation rules for commonly requested Affected Service attributes like Name, Tier, and Dependent Services in Jira Service Management. Subsequently, we will provide several sample Incident reports for Affected Services generated with the Performance Objectives app.
Understanding the Difference: Affected Services Reporting vs. Atlassian’s ‘Reports for Assets’ Dashboard
The recently introduced “Reports for Assets” dashboard template by Atlassian presents a different perspective compared to our solution. “Reports for Assets” is Object-centric, displaying data related to your Objects and their associated issues. In contrast, our approach is Issue-centric, drawing insights from issues that reference featured objects and services (only if configured). For instance, while we can identify the number of issues reporting downtimes with the DNS service, pinpointing when the DNS object was initially created is not feasible.
Notably, our method allows reporting on affected services without the need for the Administrator role, unlike Atlassian’s reporting, which restricts this capability to Jira and Site Administrators for safety reasons. We anticipate that Atlassian will introduce powerful reporting capabilities for Asset management, and we eagerly look forward to further developments in the near future.
In this article, we assume that you have already configured your service schema with Services for your ITSM projects, and that they are selectable in the field “Affected Services”. If you haven’t done this yet, you can find more information on the official Atlassian page: What are services? | Jira Service Management Cloud | Atlassian Support
Let’s get started!
Create Service Properties Retrieval Field
To transform the distinct attributes of Service – ‘Name’, ‘Tier’, and ‘Dependent Service’ – into identifiable fields for reporting, it’s essential to incorporate custom fields that utilize your Affected Services data. This step becomes necessary due to specific constraints within the Jira API.
To add a new field of type “Labels” and associate it with the project where you intend to use it, follow these steps:
⚙️ → Issues → Custom fields → Create custom field
- Navigate to the project settings in Jira Service Management.
- Click on “Issues” and then “Custom fields”
- Select “Create Custom Field” and opt for the “Labels” field type
- Name the field “Service Name” or any other suitable name, and save the changes
- Optionally, associate this new custom field with the relevant project by selecting the project under “Contexts” during the field configuration
- Repeat the steps for the remaining fields by selecting a different name for Step 4 (Affected Tier, Affected Dependent Service)
To prevent accidental edits of the field, we don’t recommend adding it to the screen of your projects.
For a visual guide, you can refer to the video below:
Create Automation Rule to Retrieve the Affected Service
To display Services through reporting gadgets on your Jira dashboard, you’ll need to create Jira Automation rules using the custom ‘Labels’ fields you’ve just set up. Follow these steps:
- Navigate to your project’s left-hand menu, then go to Project settings → Automation → Create Rule
- For the Trigger, choose “Field value changed”
- Under Component, select “Edit issue Field” → “More options” → “Additional fields”
- In the “Additional fields” section, remove any existing text and insert the following codes for each rule:
Rule for the “Affected Service Name” custom field:
{
  "fields": {
        "Affected Service Name": {{issue.affectedServices.name.asJsonStringArray.replace(" ","-")}}
    }
}
In the provided code, the first field corresponds to the ‘Labels’ field (Service Name), and the second field represents the Service (Affected Services). The ‘Service Name’ will adopt the same name values as those in the ‘Affected Services’ field. The rest of the code processes the Object list by separating it into an array of values and removing any empty spaces between them.
Rule for the “Affected Service Tier” custom field:
{
    "fields": {
        "Affected Service Tier": {{issue.affectedServices.tier.asJsonStringArray.replace(" ","-")}}
    }
}
Rule for the “Affected Dependent Services” custom field:
{
    "fields": {
        "Affected Dependent Services": {{issue.affectedServices.dependentServices.asJsonStringArray.replace(" ","-")}}
    }
}
In the code, the smart value ‘{{issue.affectedServices.dependentServices}}’ returns the list of services that this issue’s services depend on.
If, for any reason, the code isn’t working as expected, please ensure that you haven’t included any spaces or extra characters while naming your custom fields. Alternatively, you can refer to the fields using their unique field IDs. If you prefer using the custom ID of the field, replace the field name with the notation below, where ‘X’ stands for the unique ID of the field.
customfield_X
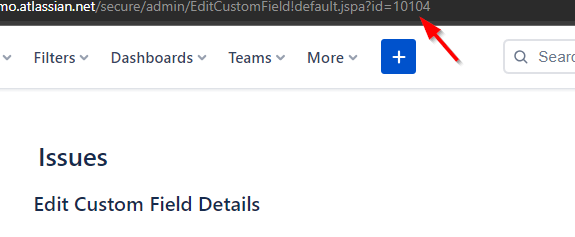
To find the ID, navigate to your Custom Fields and select the ‘Edit Details’ option from the 3-dot menu of the respective field. The ID is visible at the end of the URL. In our example, the field’s ID should be displayed as customfield_10104 within the code.
Handling Issues without Dependencies
When testing the rules, you might notice ‘[]’ in the ‘Affected Dependent Services’ field within the screen or reporting apps. These square brackets indicate an absence of dependencies for the selected services, meaning they are not dependent on any others.
If you wish to visualize issues with no dependencies in a more comprehensible way on a chart, you can add a second ‘replace’ method. This will result in two ‘replace’ methods in the script, like this:
{
    "fields": {
        "Affected Dependent Services": {{issue.affectedServices.dependentServices.asJsonStringArray
.replace(" ","-").replace("[]","[Independent]")}}
    }
}
You have the flexibility to adjust the replacement value to ‘Independent’ or any other term that aligns with your preferences.
For a visual demonstration, please refer to the video below:
Troubleshooting and Manual Rule Execution
We strongly advise monitoring your automation rules for potential errors. Even a minor and unintentional keystroke, such as pressing the ‘space’ key in the wrong location, can cause a rule to malfunction, resulting in data gaps in your reports. If you encounter such an issue, follow these steps:
- Deactivate the problematic rule.
- Address the identified problem.
- Activate the affected rule(s) manually one time by adjusting the trigger from ‘Field changed’ to ‘Scheduled,’ then re-enable the rule. Initiate the rule and wait for its completion.
- Once the manual execution is done, switch the trigger back to ‘Field changed’ after verifying that all data from manual execution has been included in the requests.
The same approach can be applied to older open requests if automation rules weren’t in place when they were created. You can easily use the ‘Scheduler’ trigger for these older requests using JQL. For example, this can be useful for all open tickets created before the introduction of custom fields. Keep in mind that manually executing rules may not align the historical data on custom field value changes with the issue’s creation date. This difference should be taken into account when reviewing the outcomes of manual executions.
For the manual execution of the rules, refer to the following video guide:
Create Incident Reports Utilizing Affected Services Fields
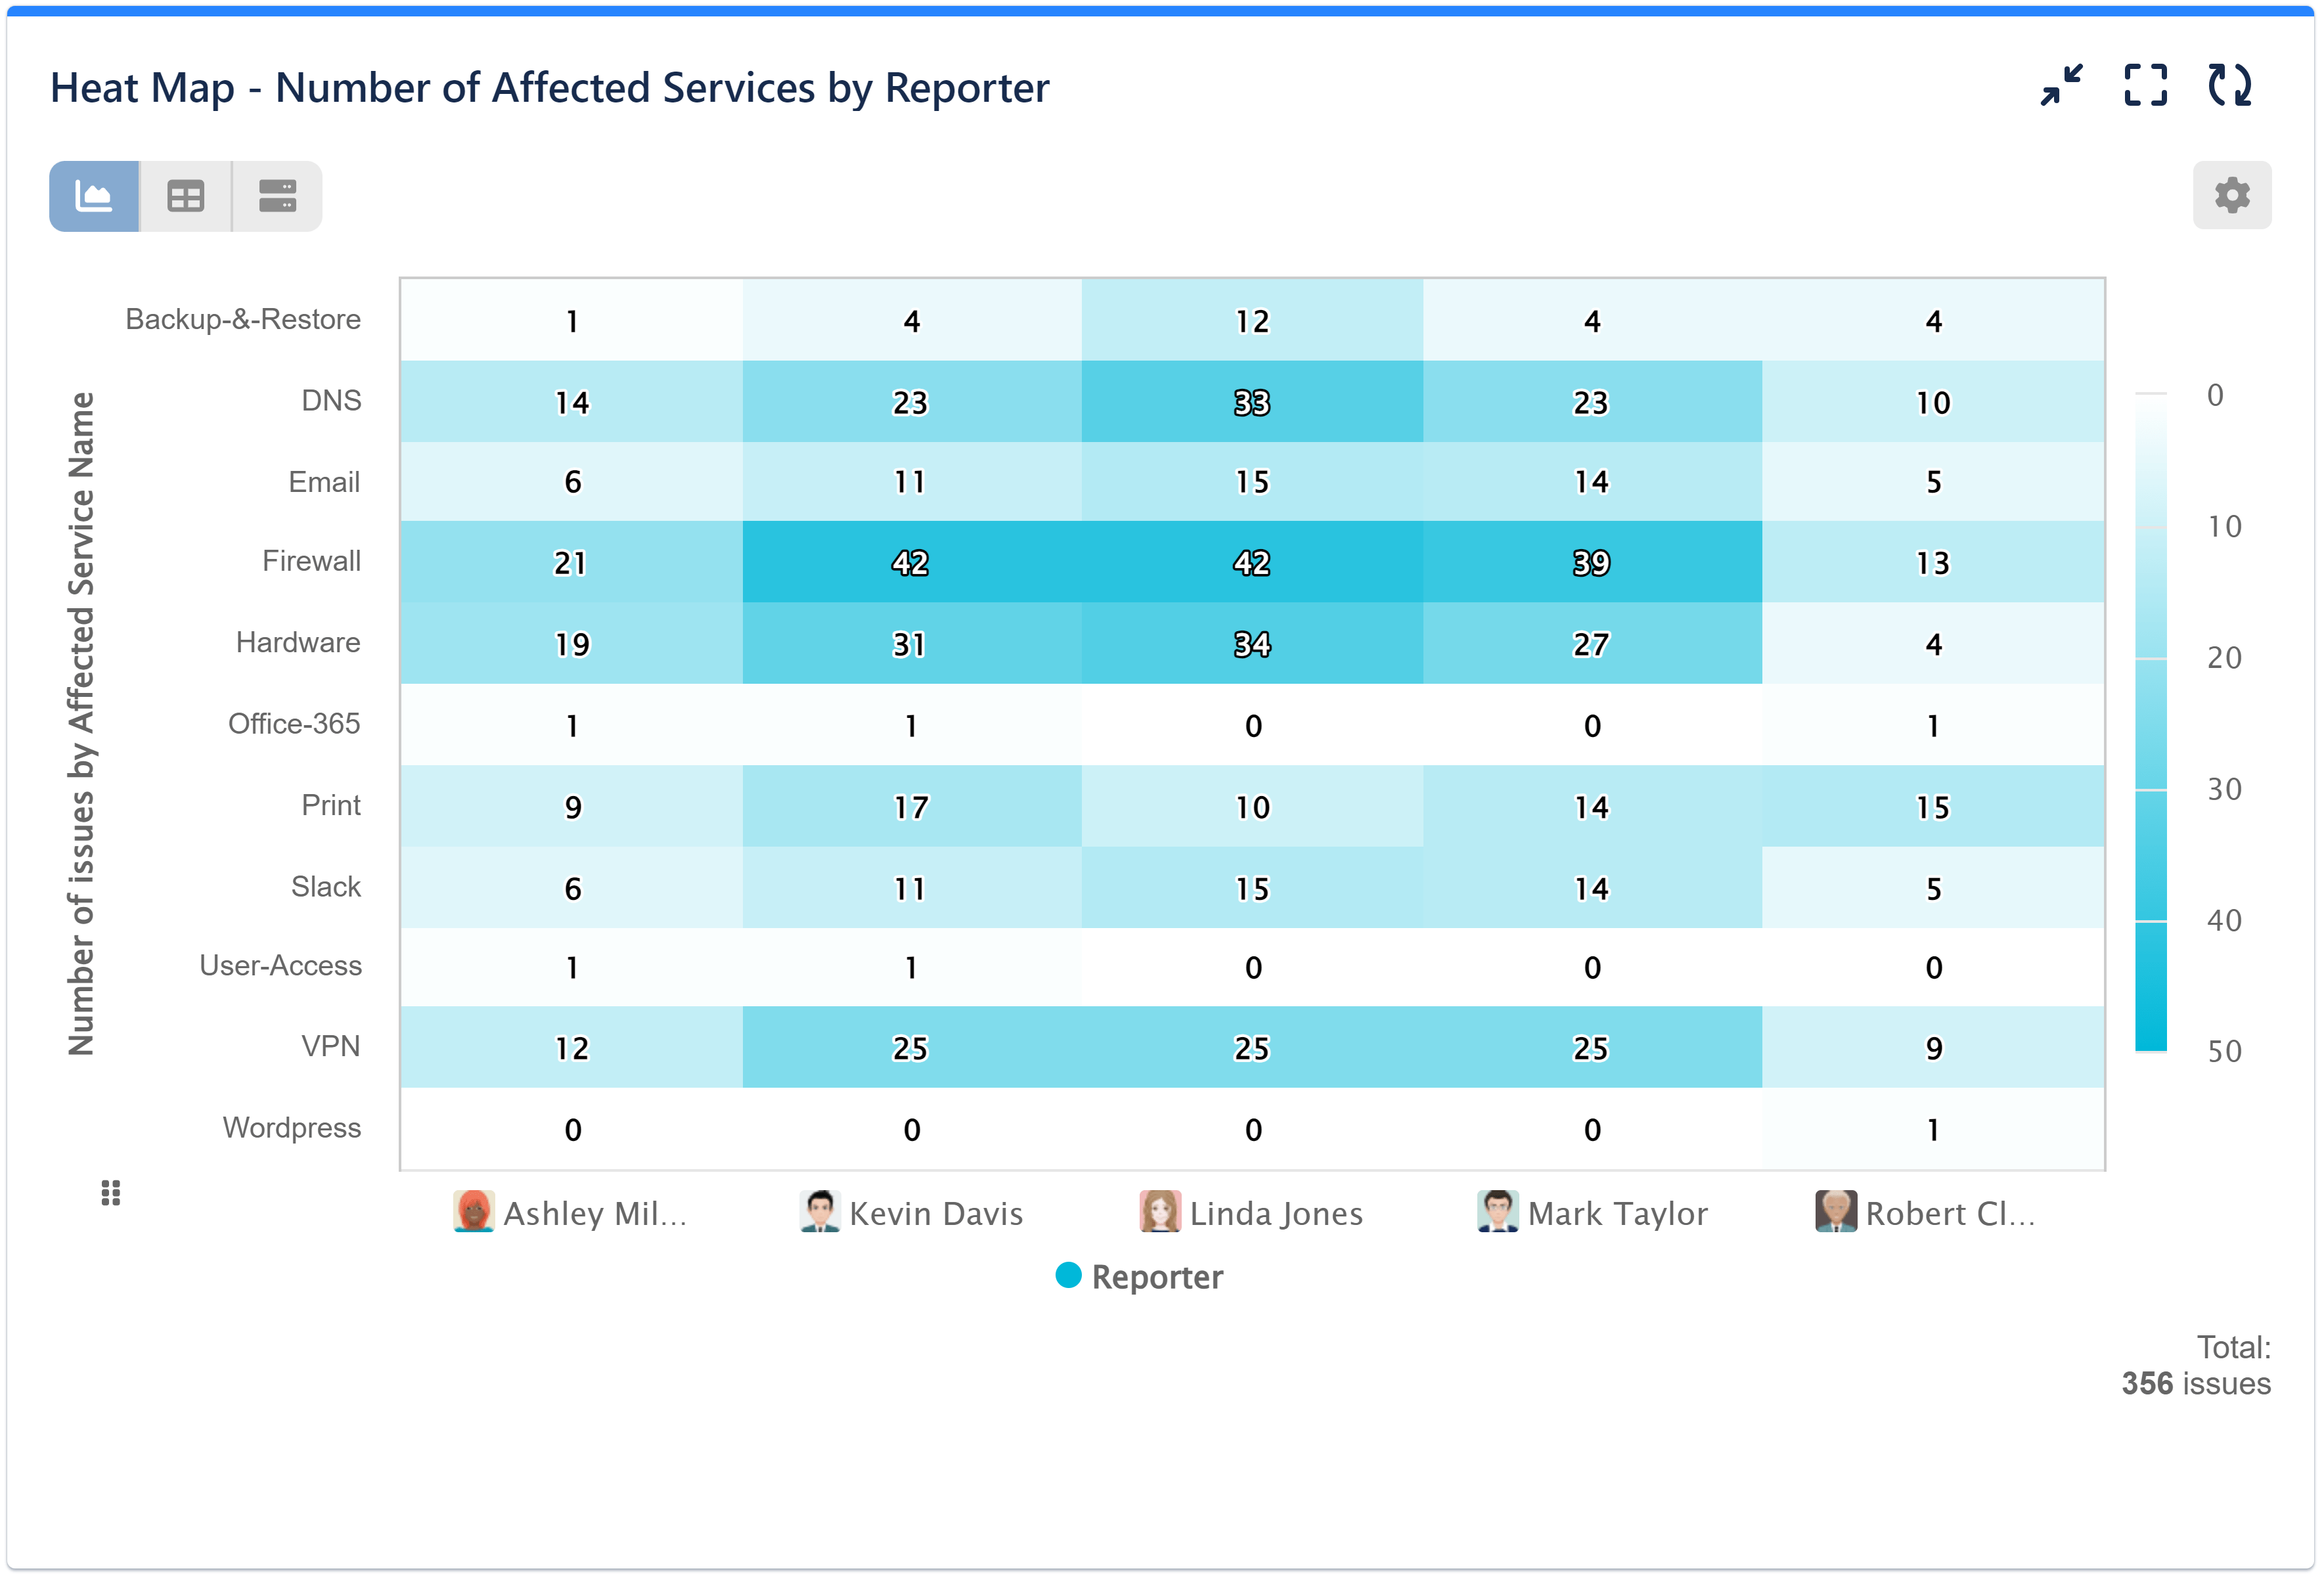
Below, you can review a sample Incident report created using the Heat Map gadget from the Performance Objectives app. This report displays the “Number of issues by Affected Service Name and Reporter.” Using this report in Jira Service Management will enable you to gain insights into your incident management process, optimize resource utilization, and improve the overall efficiency of your service delivery.
Here is a video demonstrating how to create various incident reports using Performance Objectives’ Tree map and Heat map.
Note: Your dependent services are indicated within ‘[ ]’ and are based on the Service in question. If a service affects two or more other services, they will be visualized as one label value separated by a comma and a hyphen “-”. For instance, in our case, the Print service relies on the [Hardware,-Firewall].
We’re committed to continually enhancing functionality. Keep an eye out for our upcoming blog posts and app updates. Explore other essential reports and KPI examples you can build on your Jira dashboard with Performance Objectives: Charts for Jira app. To learn more about all the app features, please refer to our User Guide.
Start your 30 days free trial of Performance Objectives: Charts for Jira from Atlassian Marketplace.