Performance Objectives: Charts for Jira allows you to stack your charts by percentage to display the distribution ratio based on any Jira field, metric, or data segment. This feature is accessible in the “Performance Objectives” and “Performance Trend” dashboard gadgets.
This feature offers improved data comprehension by revealing distribution patterns and trends, enabling data-driven decision-making through visualizing relevant data, and promptly detecting imbalances or anomalies that need further scrutiny.
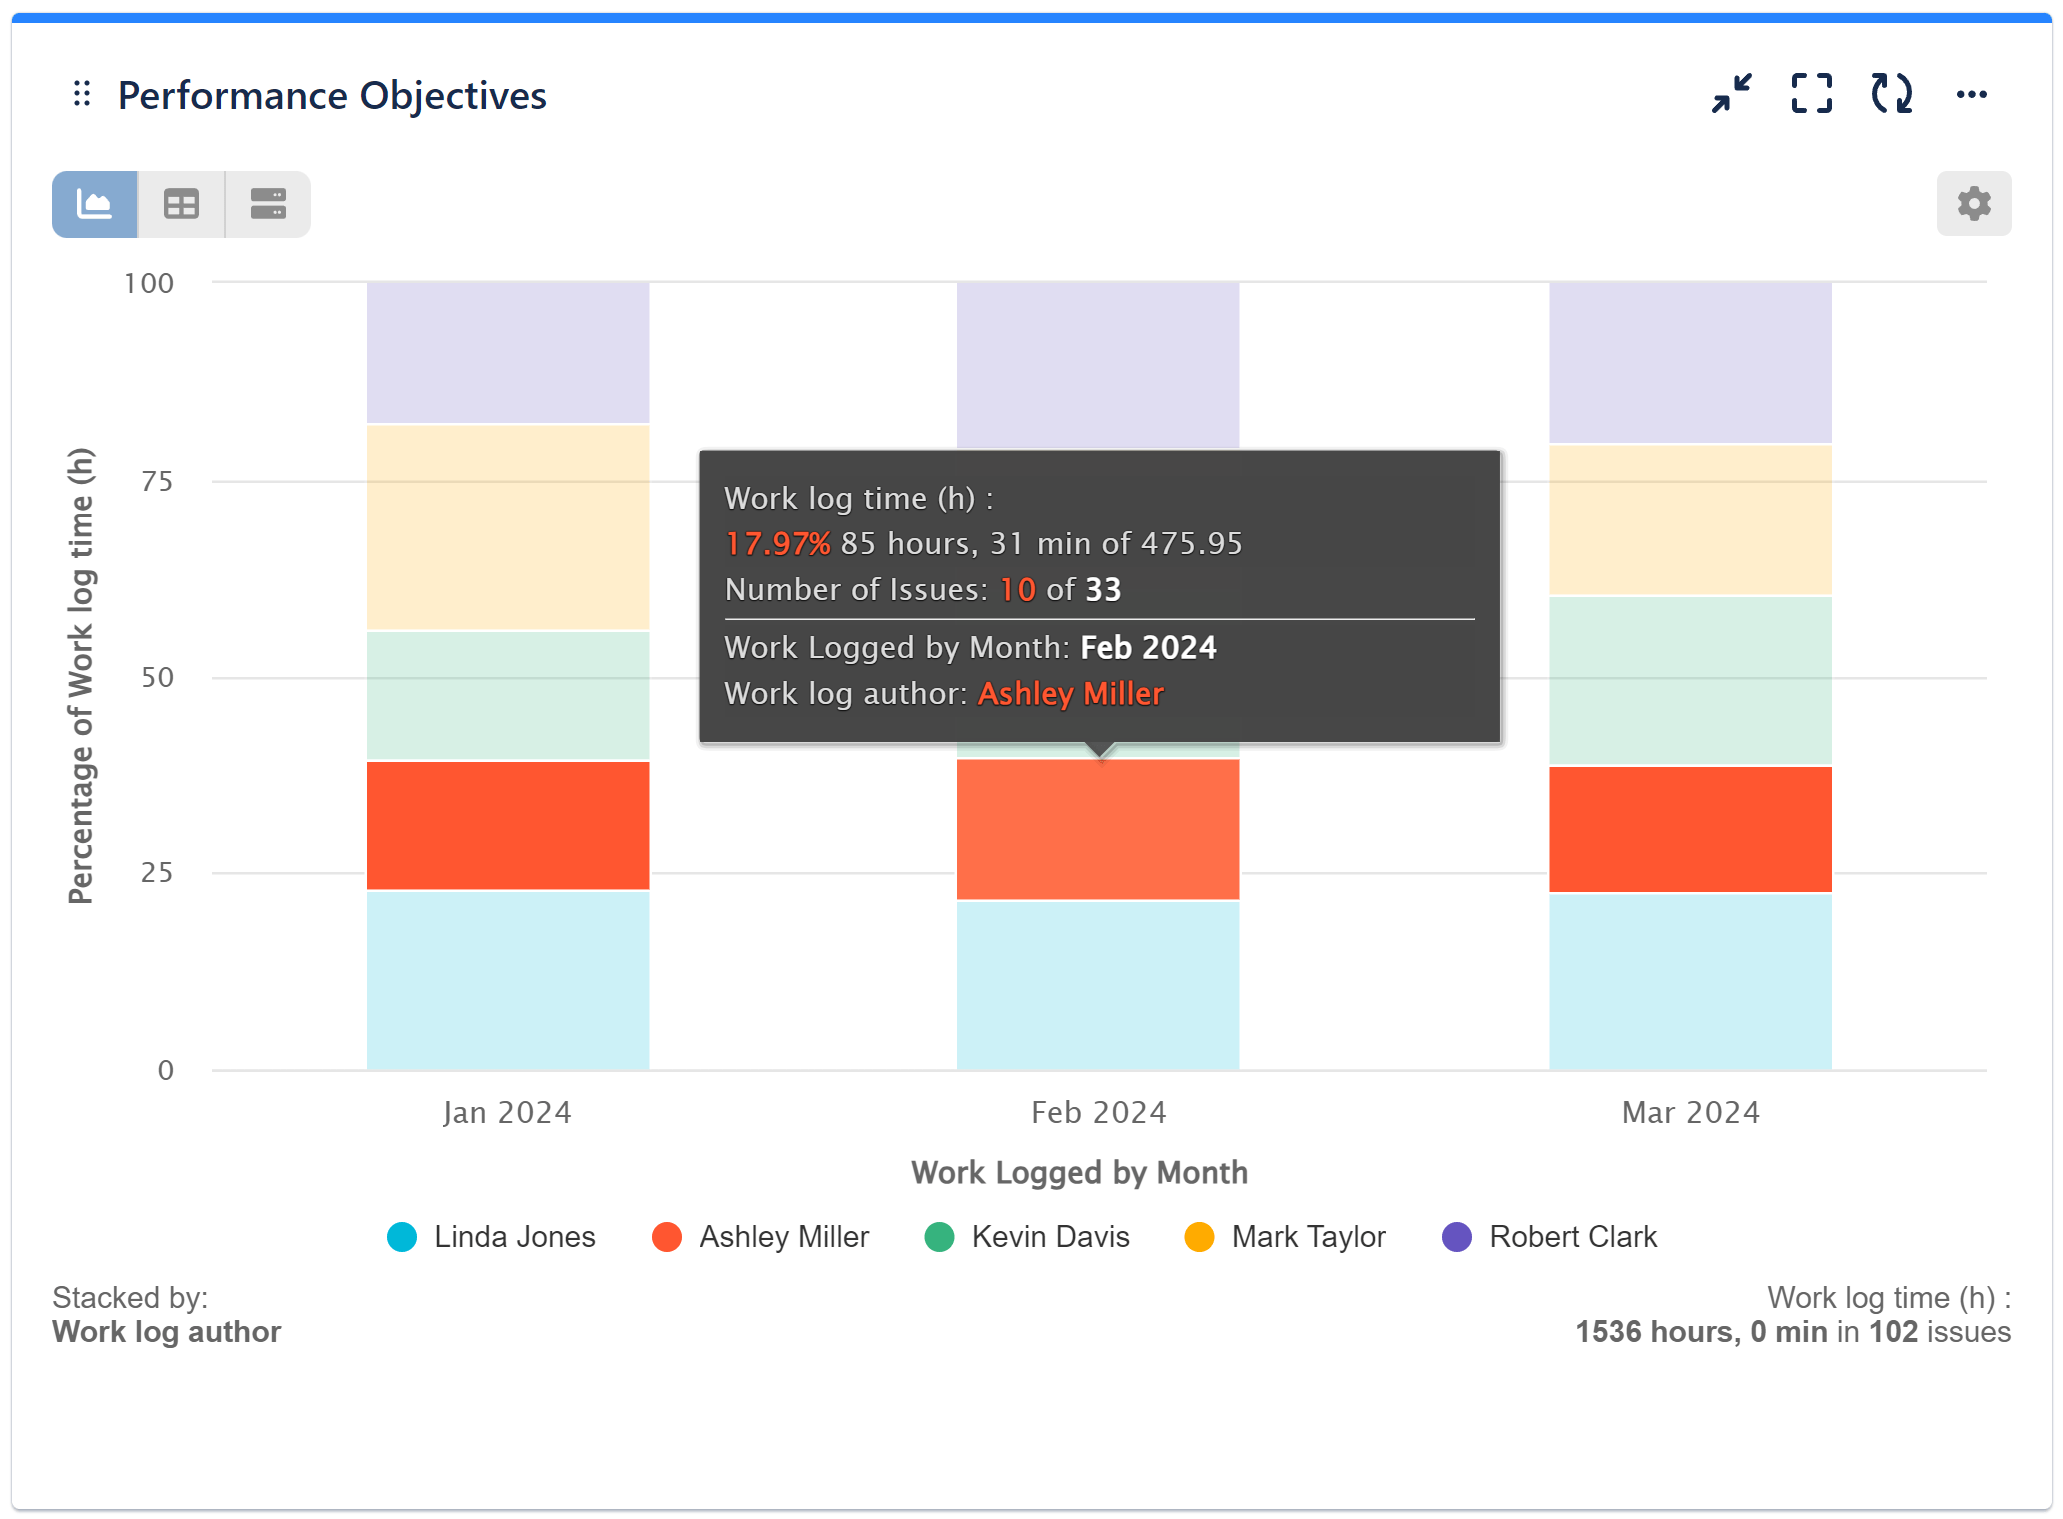
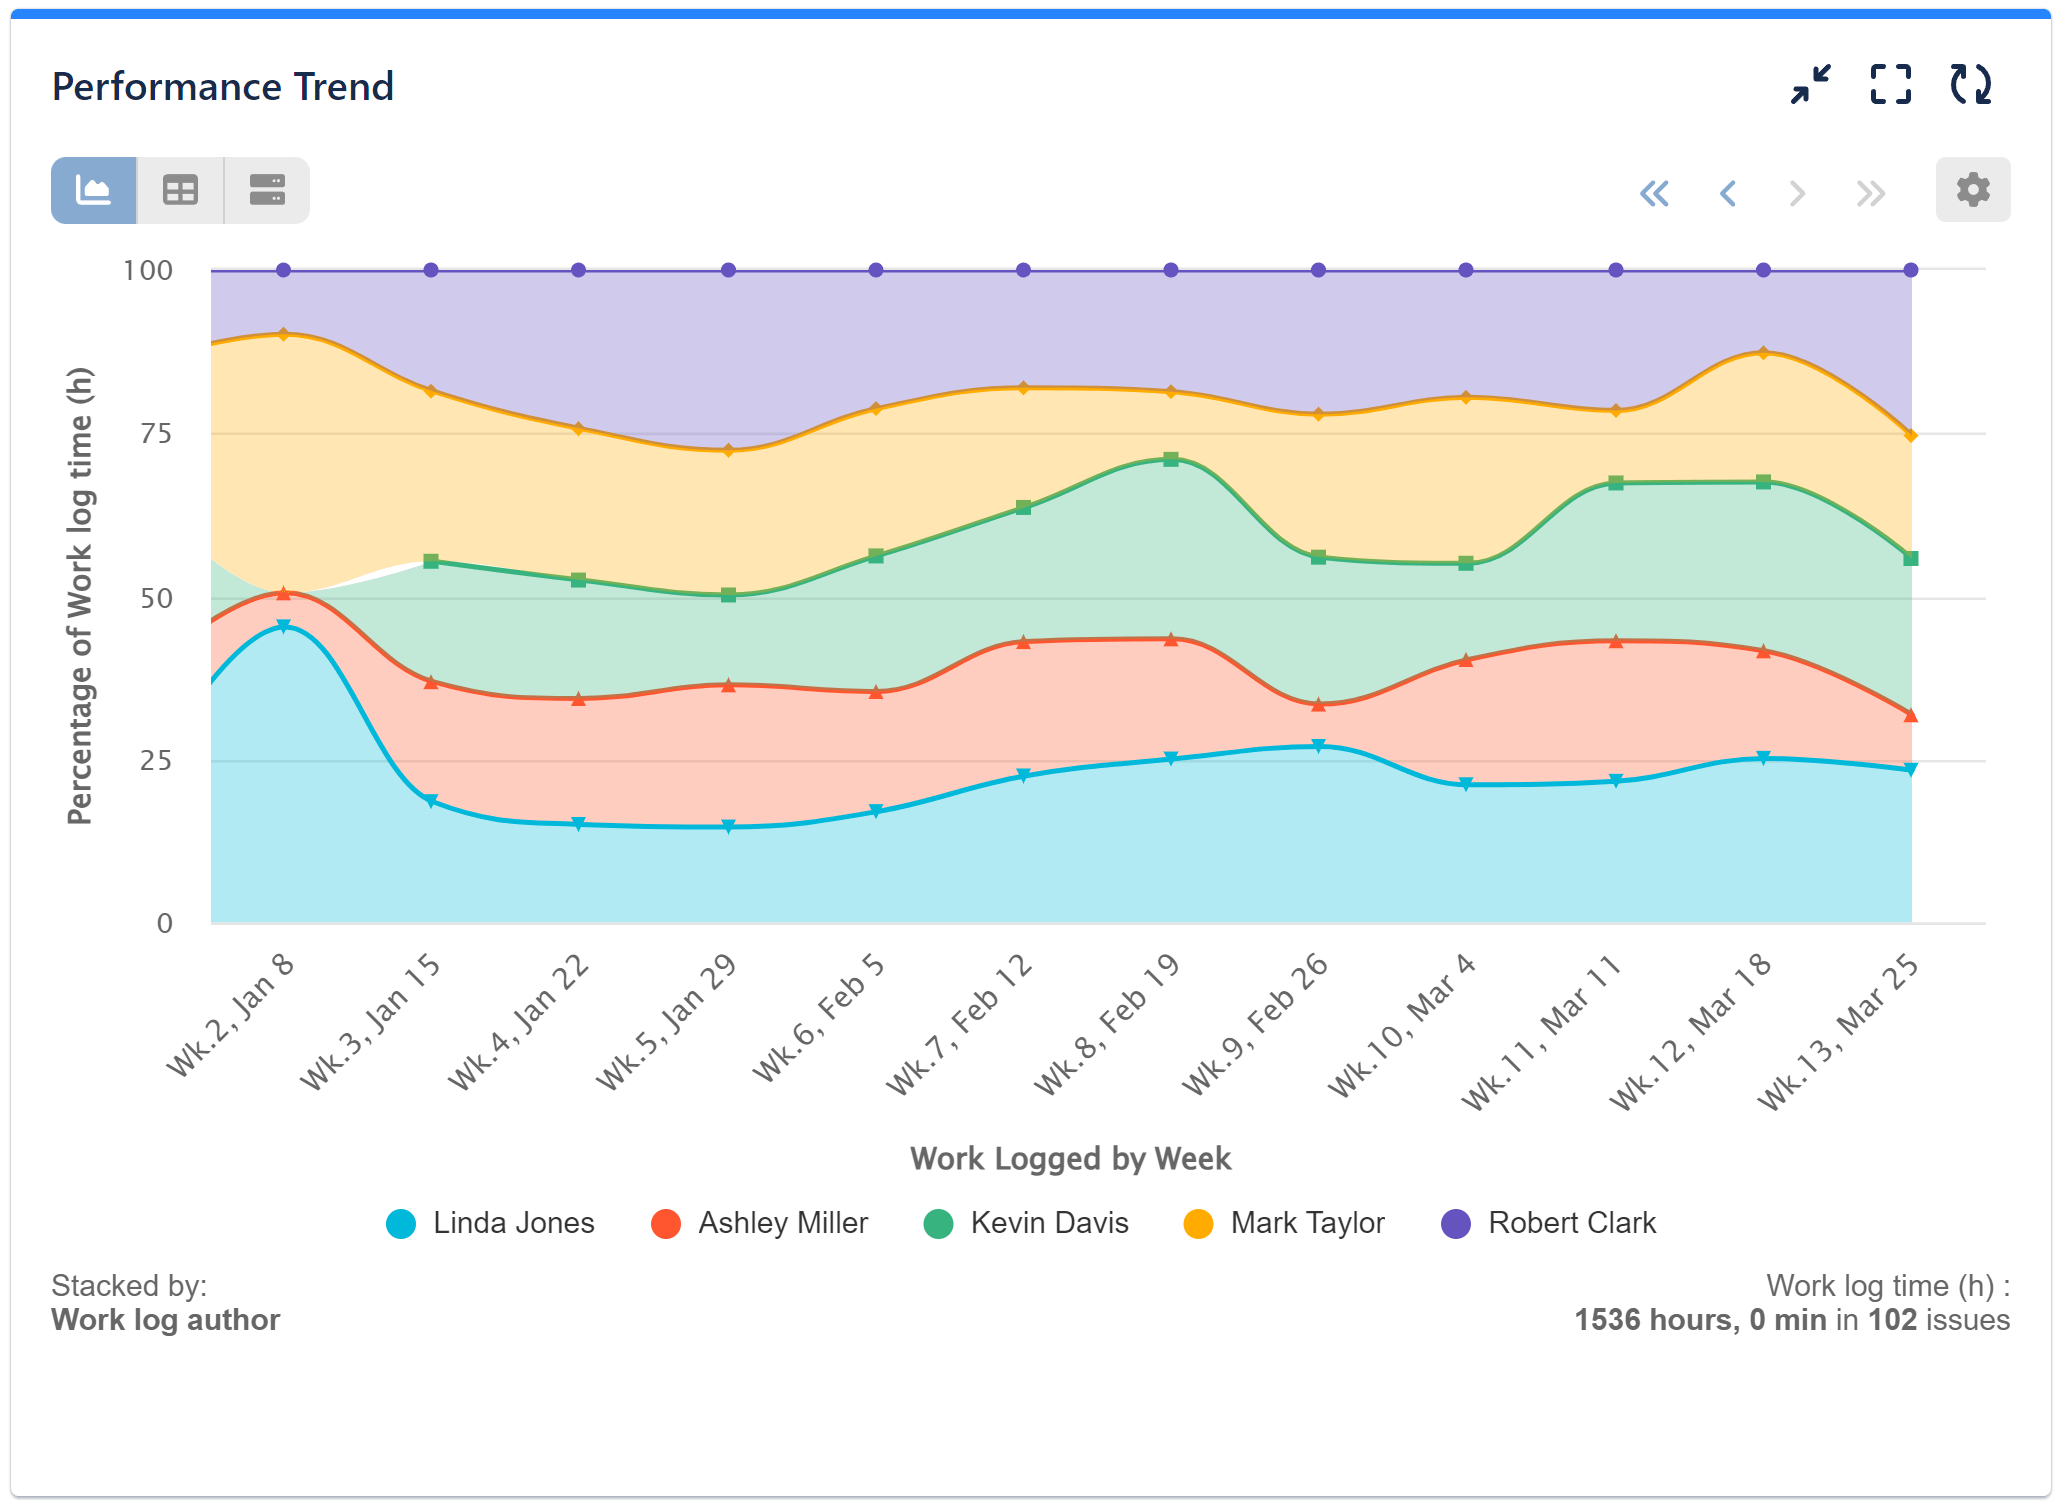
Stack Your Chart by Percentage for Comprehensive Data Analysis
Observe the difference in visualization between a stacked bar or area chart and the same stacked charts when by Percentage is toggled on.
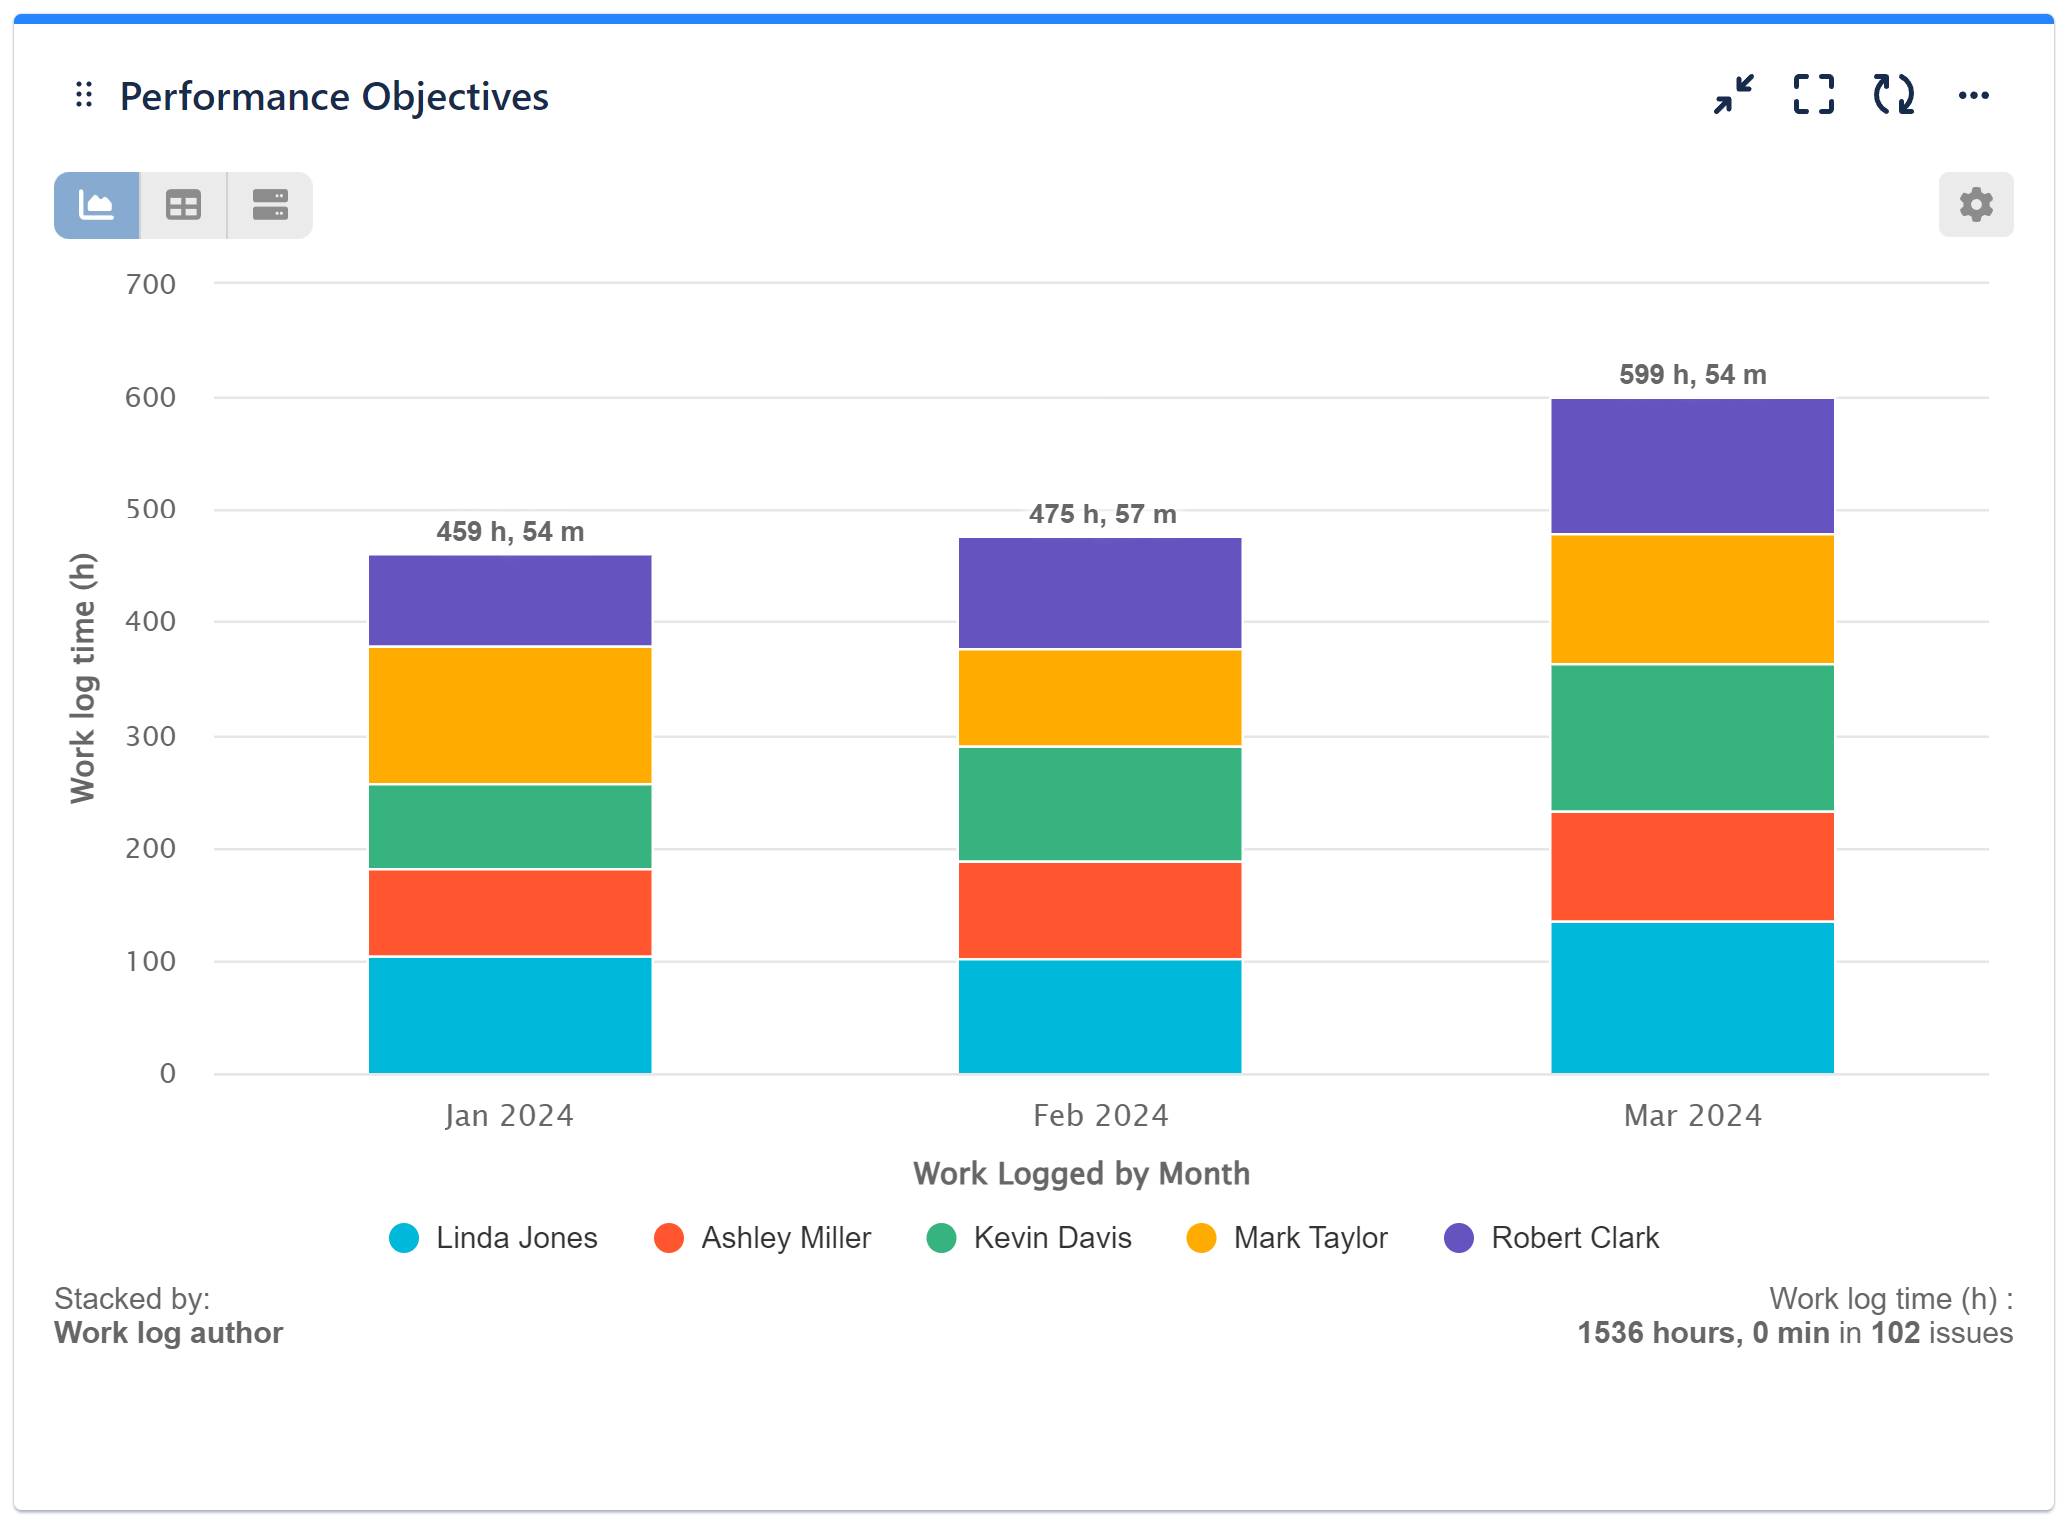
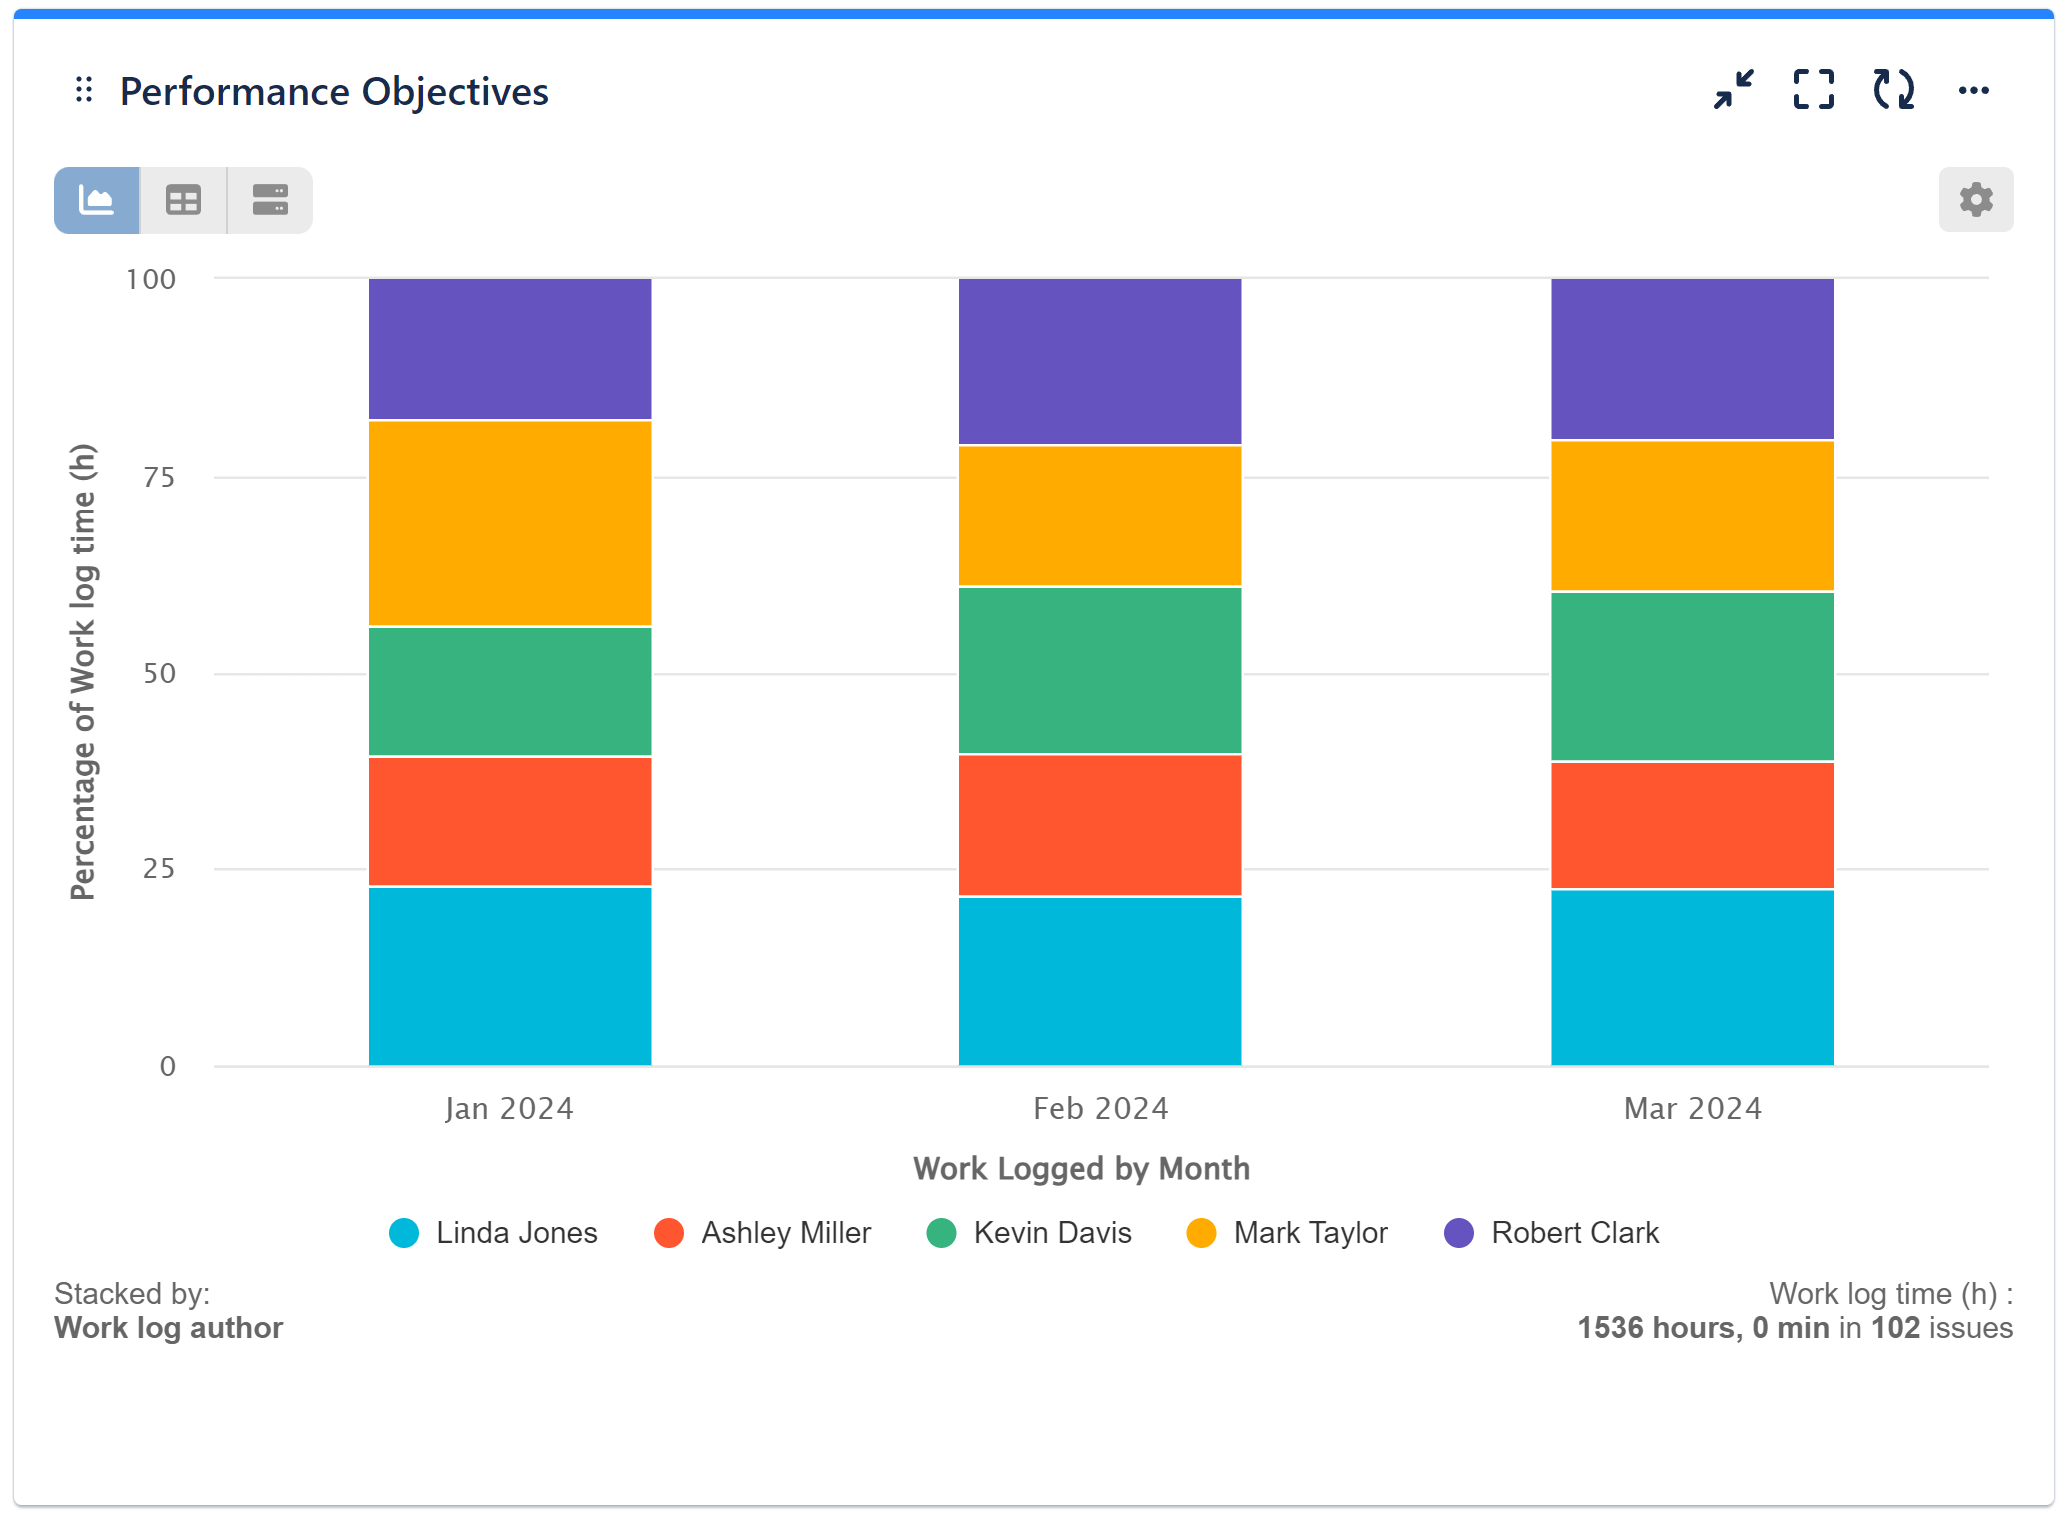
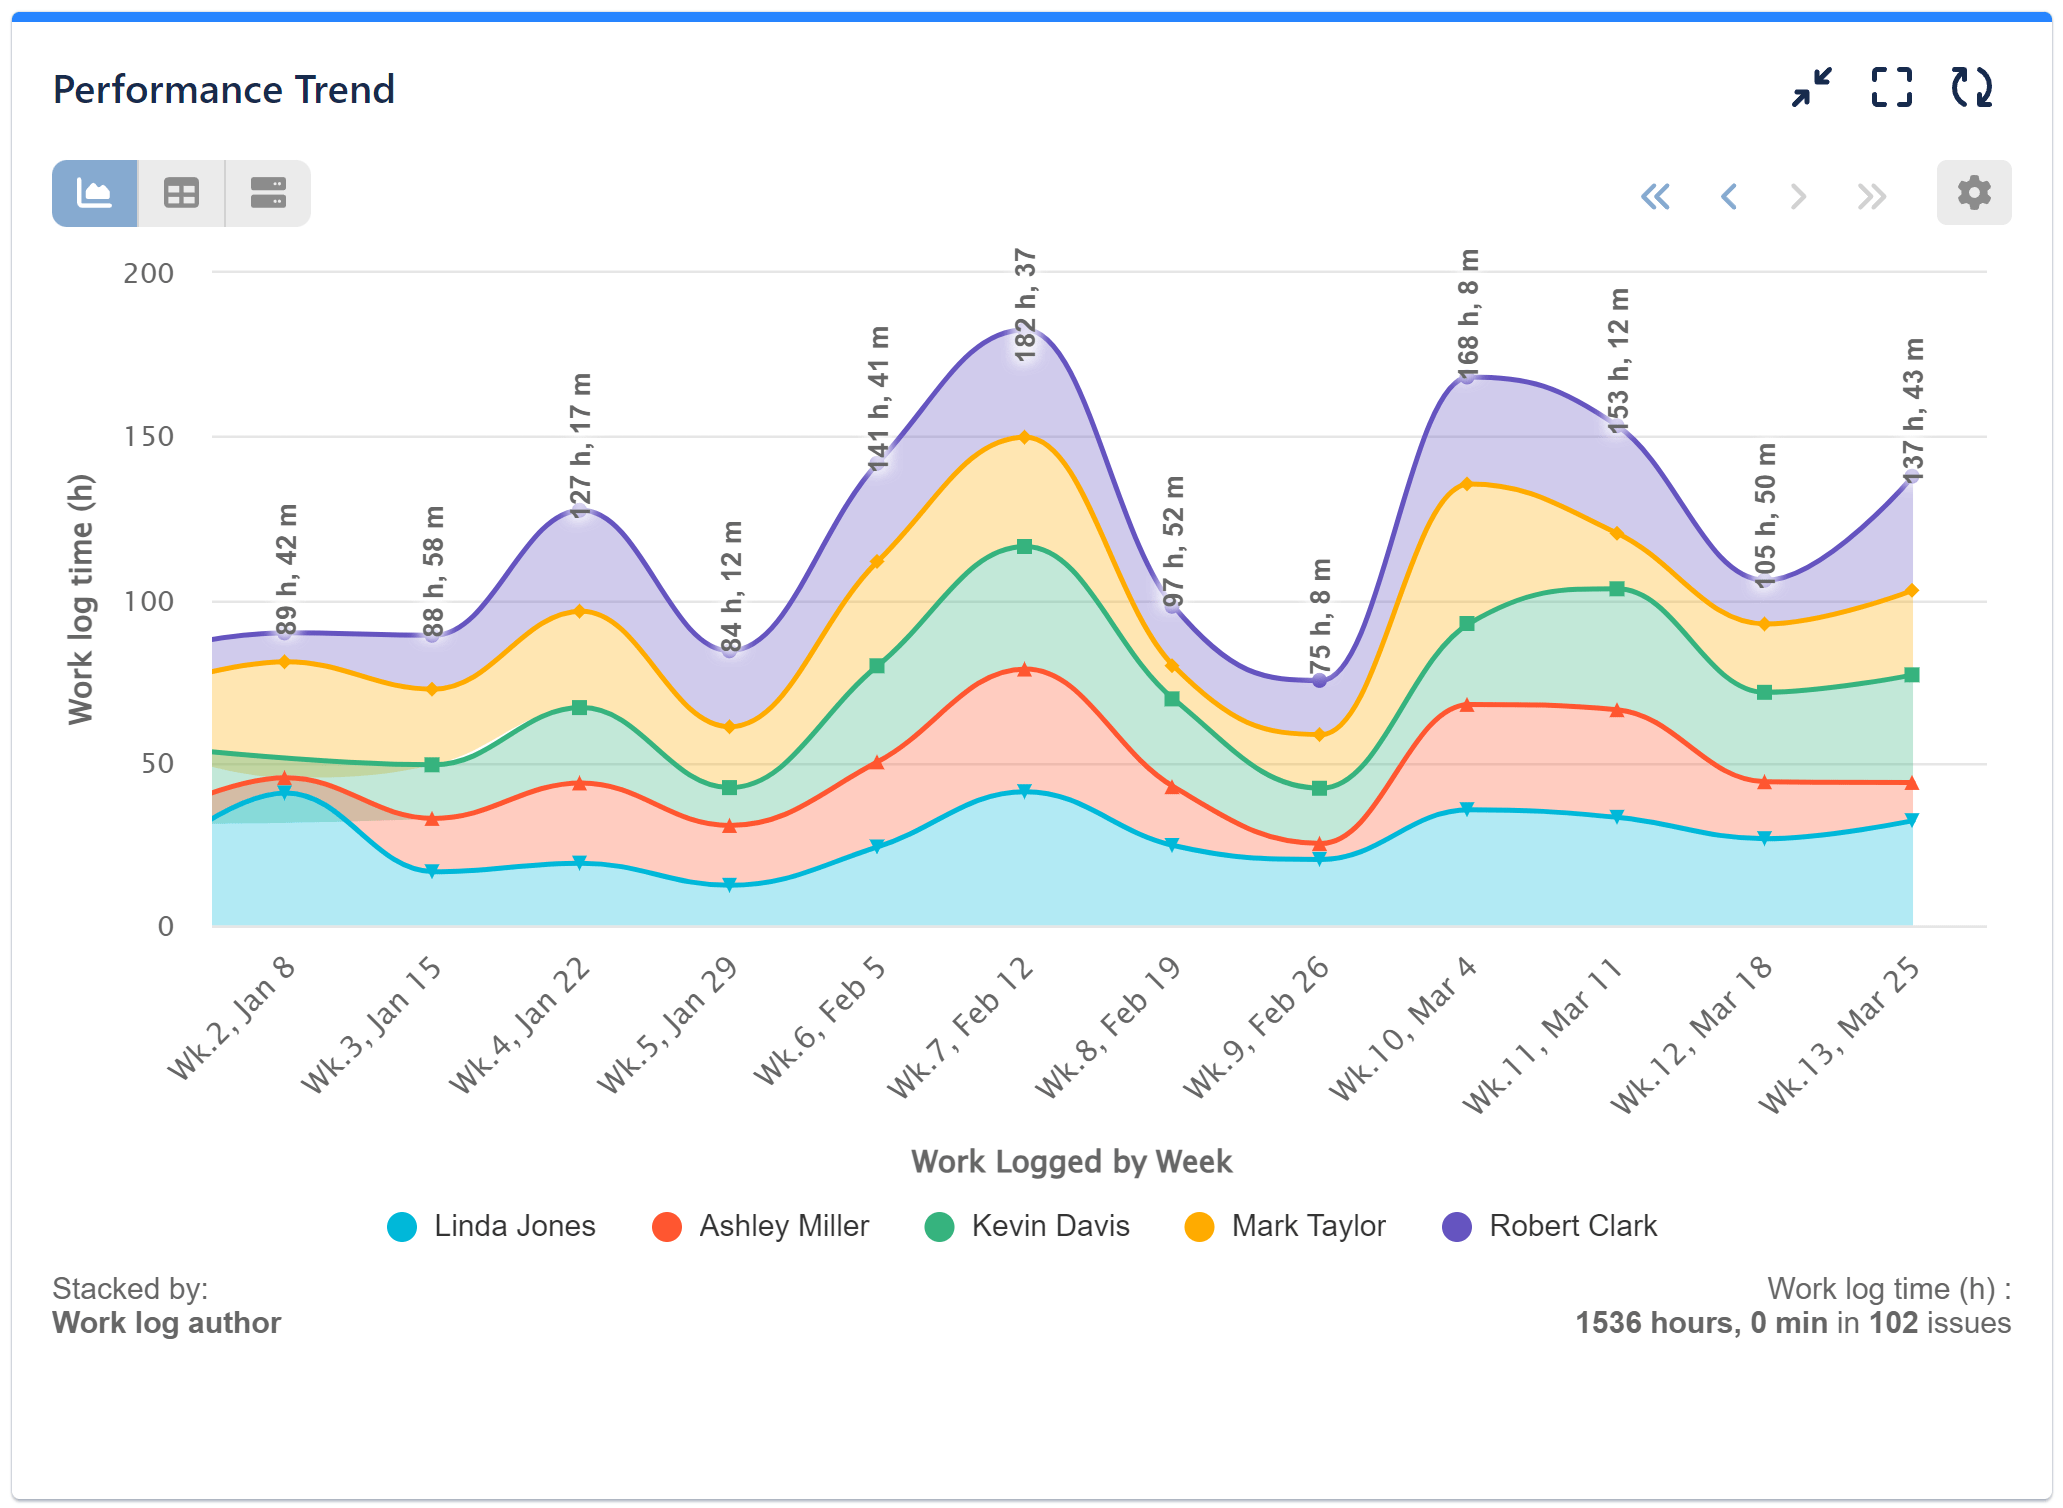
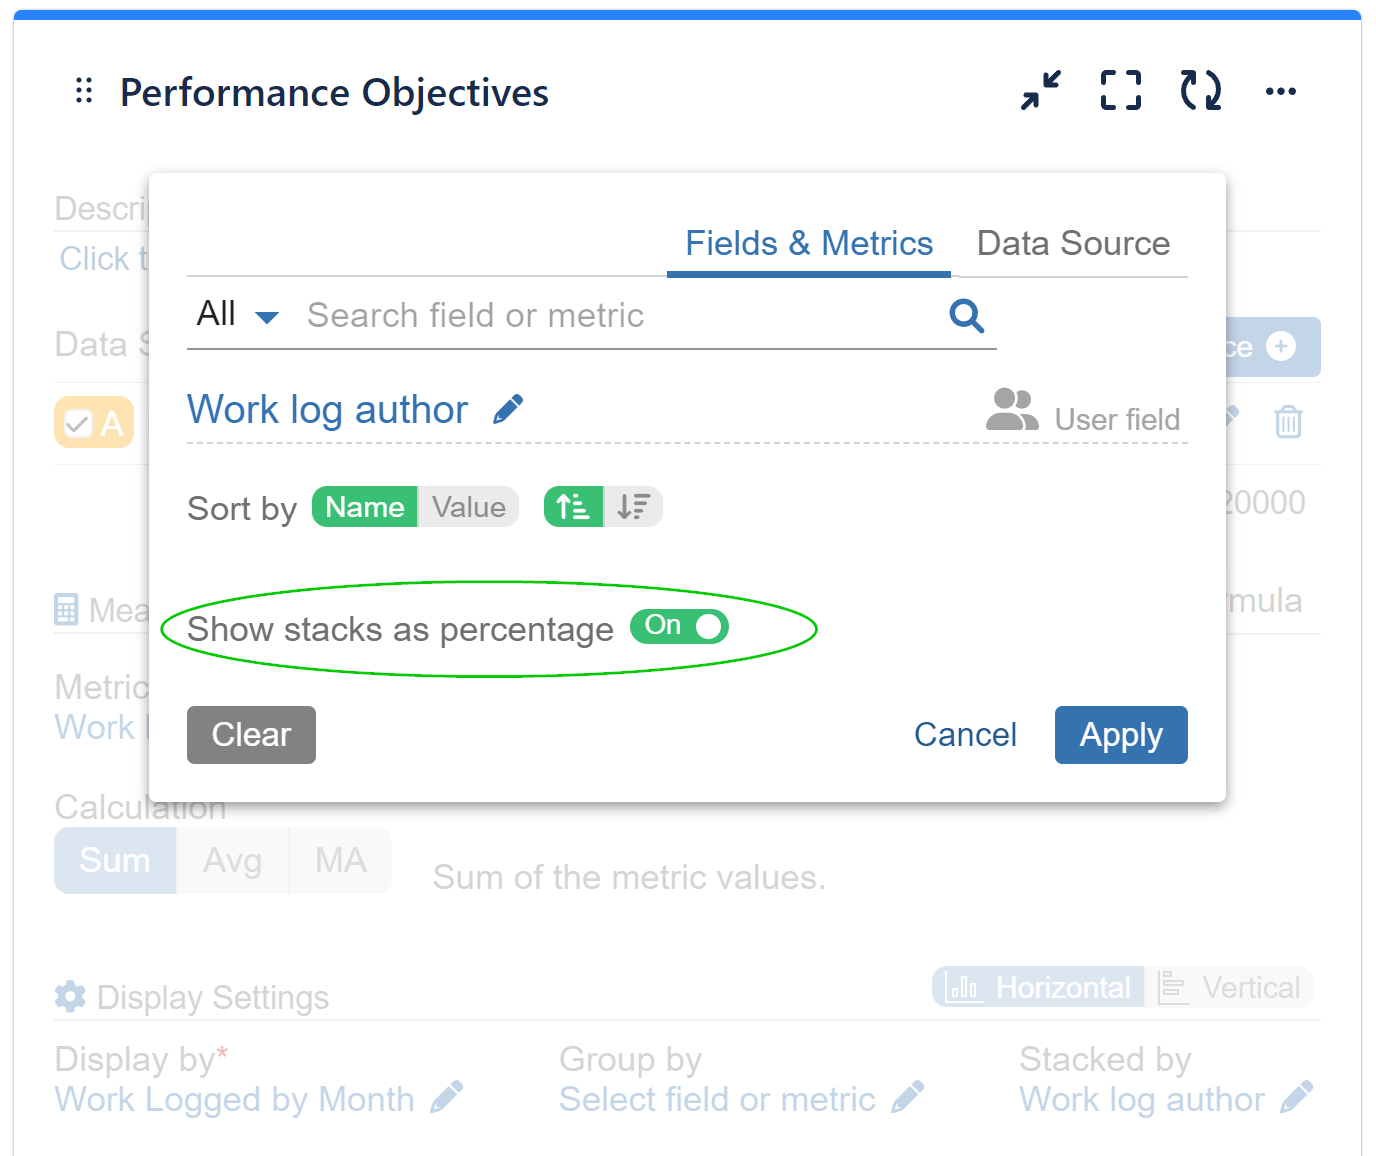
The configuration option is accessible within the modal that opens when editing the “Stacked By” display configuration.
Please review the recording below to see the feature in action:
Delve into the full range of powerful app features in our comprehensive User Guide.
Start your 30 days free trial of Performance Objectives: Charts for Jira from Atlassian Marketplace.