The Conditional Metric is an advanced feature of the Performance Objectives for Jira app, offering enhanced flexibility. It empowers Jira users to customize and tailor their chart metrics to precisely match their reporting requirements.
On the configuration screen, within the Measure section, you’ll discover the Conditional Metric feature. Here, you can select the metric you wish to define conditions for, name your conditional metric, and input your conditional expression. As you hover over the expression field, a helpful tooltip containing expression examples will appear.
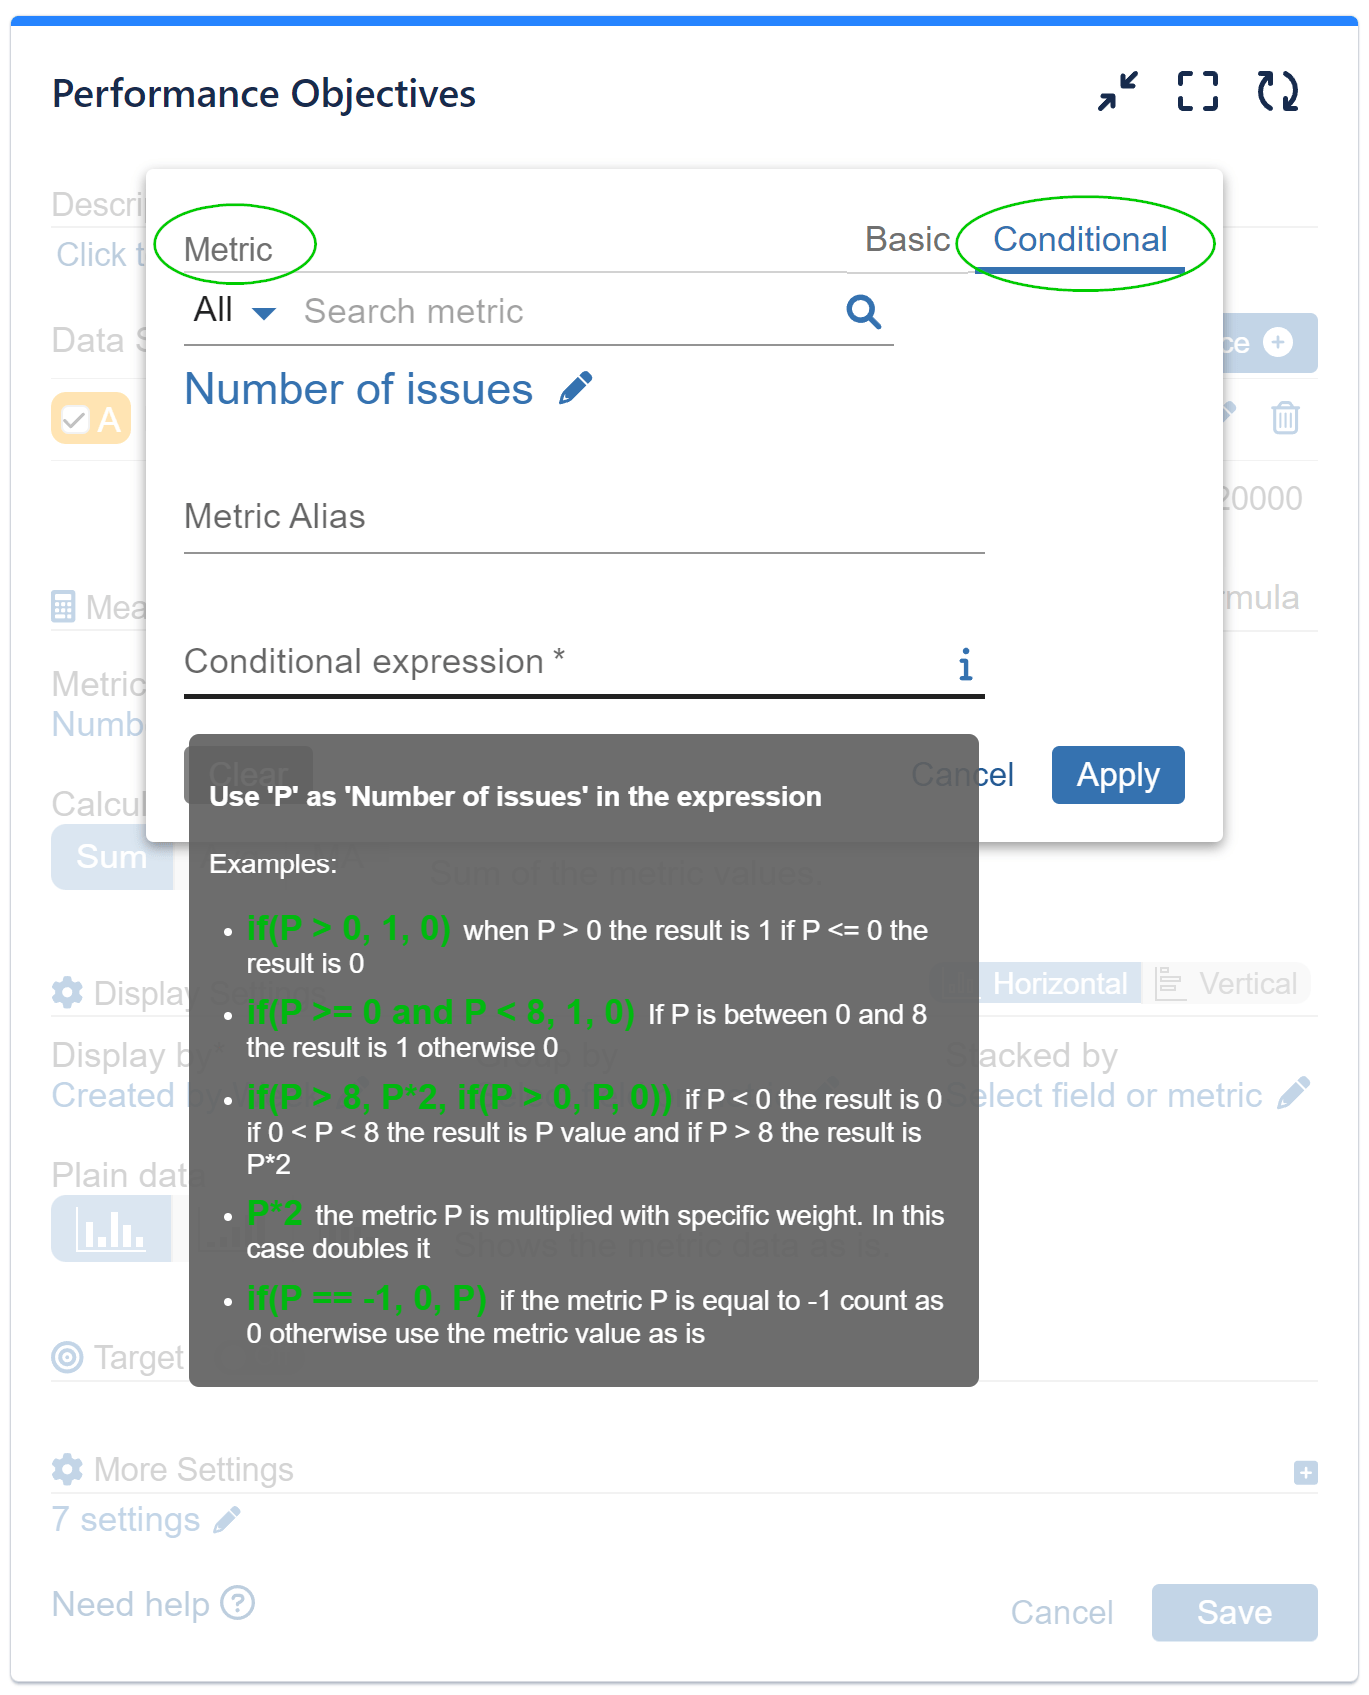
The feature allows you to filter Jira issues based on specific conditions tied to the chosen metric, providing powerful flexibility that Data Segmentation and JQL queries lack or you cannot write JQL. Expressions facilitate the use of key mathematical operators such as: equals, greater than, less than, or multiplication, which can be utilized to assign weight to a specific value.
Here are some ideas for conditional metrics that can benefit any Jira team:
- Count number of issues estimated with greater than 13 Story Points
- Count number of issues that have been in status ‘In Progress’ for more than 3 days, displayed by Priority
- Count number of issues with Remaining Estimate less than 4 hours, displayed by Assignee
- Count number of issues with more than 10 Comments, displayed by Request type
Check out our YouTube video tutorial designed for Conditional Metrics for more insightful use cases of this feature.
Sample Scenario: Count Jira Issues with Conditional Metric and Chart Visualizations
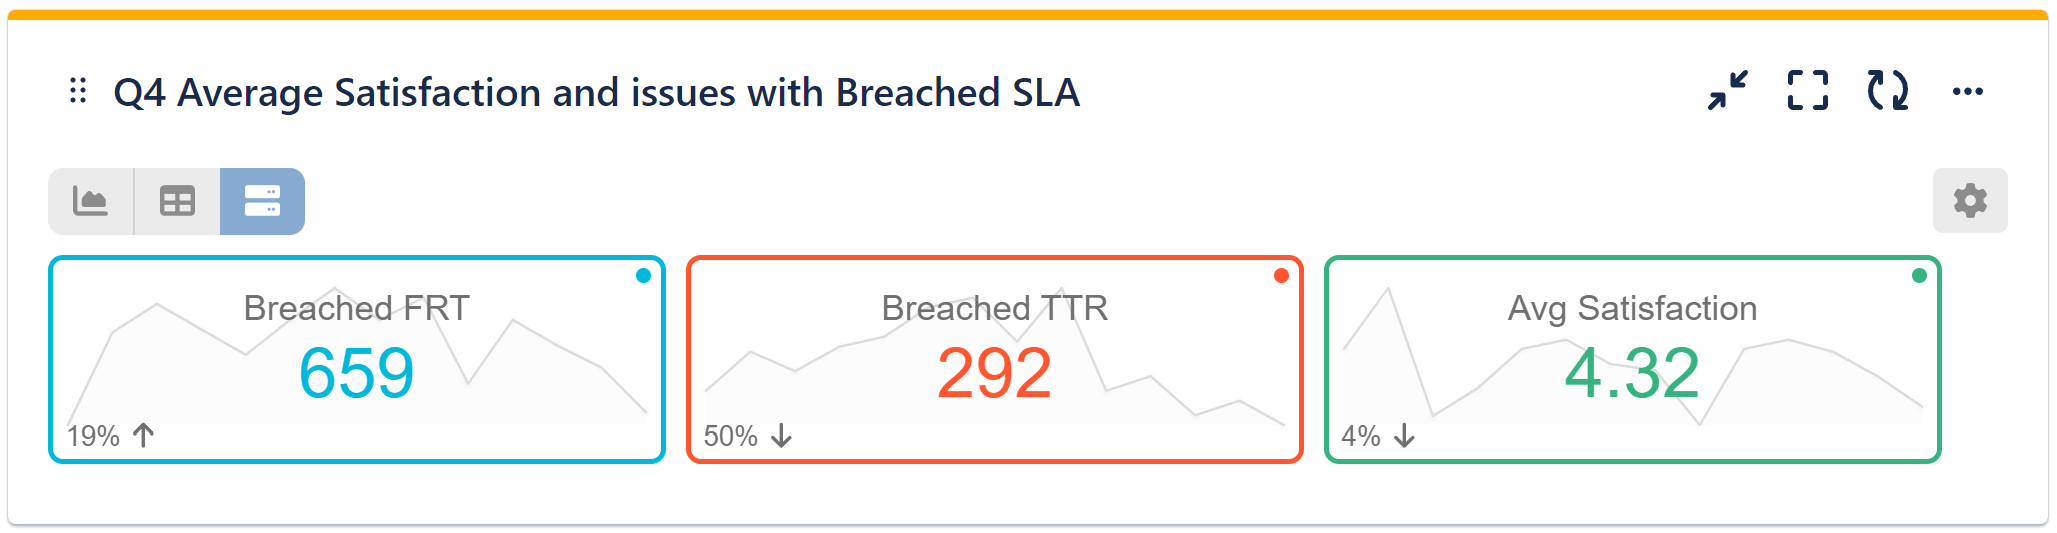
In our sample scenario, we utilized the Multi Metric Combined Chart Gadget in Tiles View to obtain an overview of three conditional metrics from our Jira Service Management project. These metrics include:
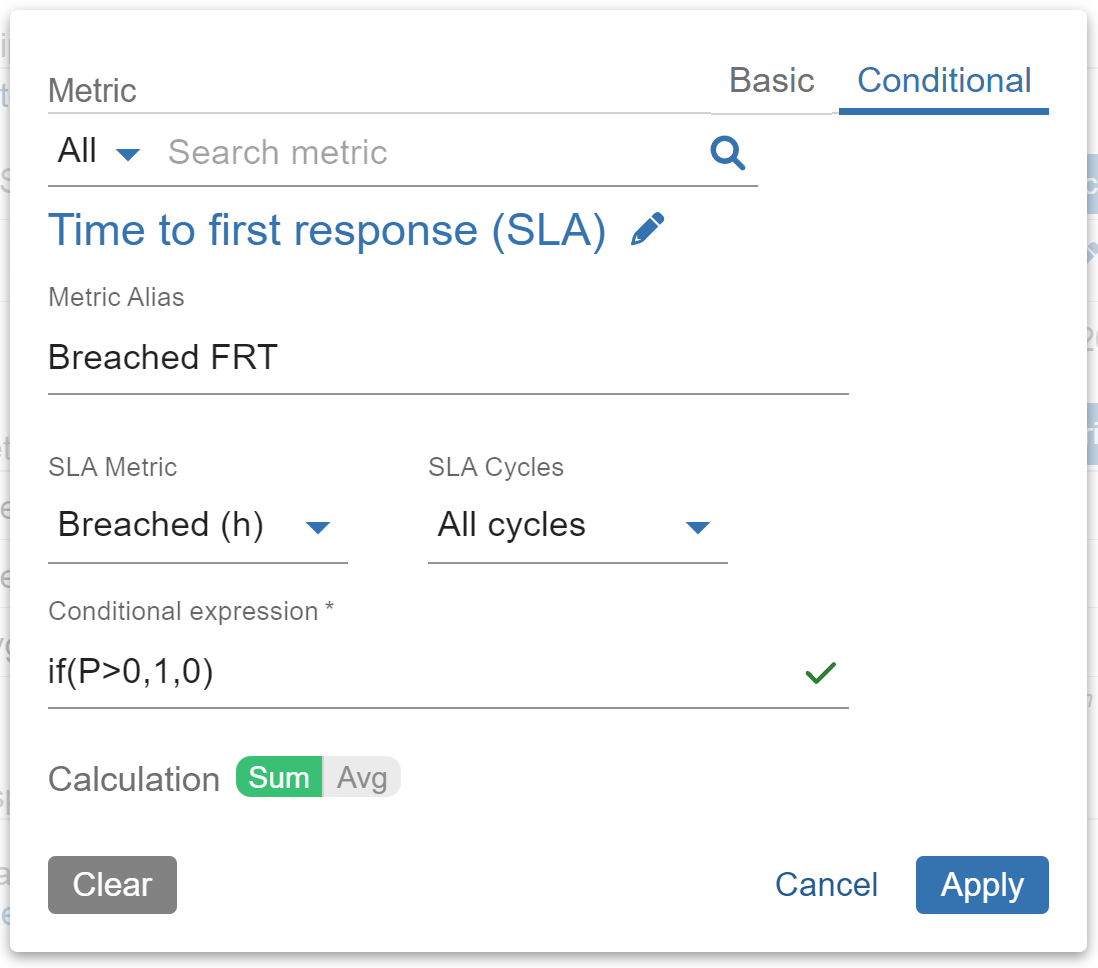
- Counting the number of issues that breached the First Response Time SLA.
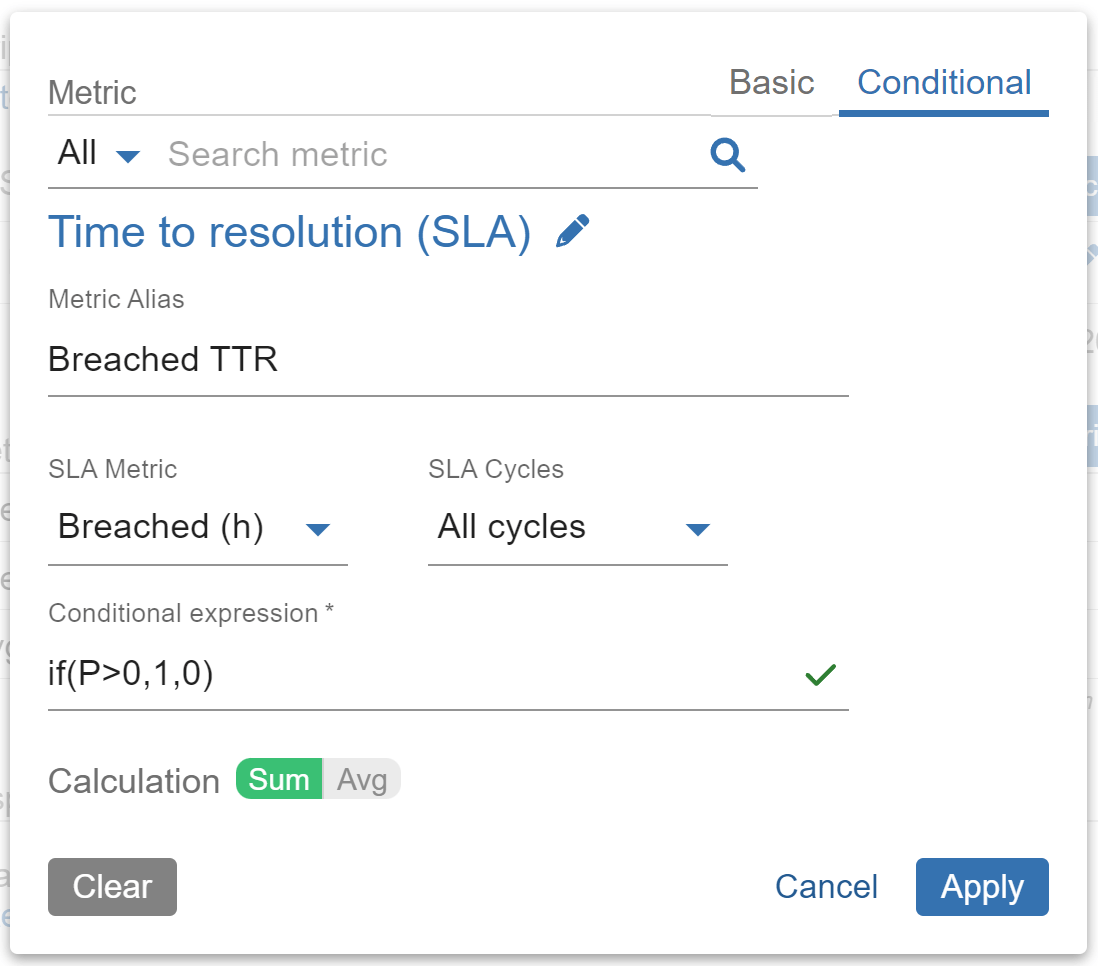
- Identifying issues that breached the Time to Resolution SLA.
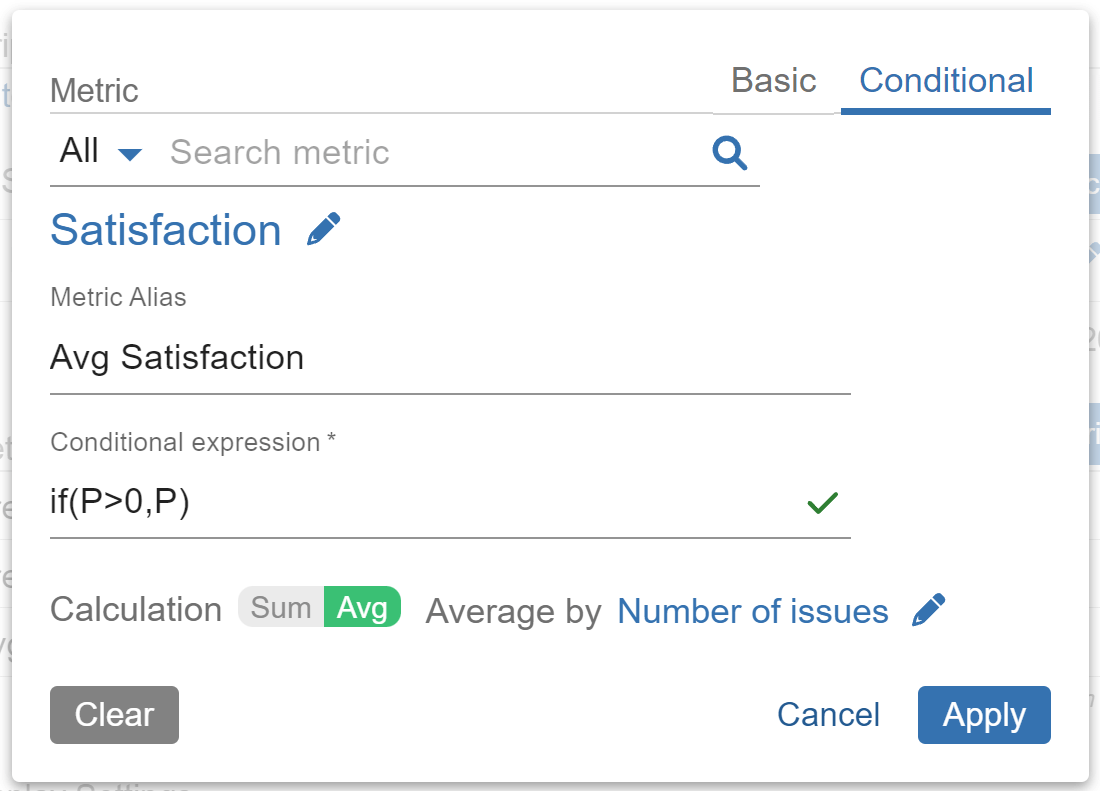
- Measuring the average Satisfaction rates per the specified period, which, in our case, is Q4 2023.
This approach allows us to gauge the pulse of the project’s performance and gain valuable insights into its efficiency and adherence to service level agreements.
Below are the configuration steps for this report:
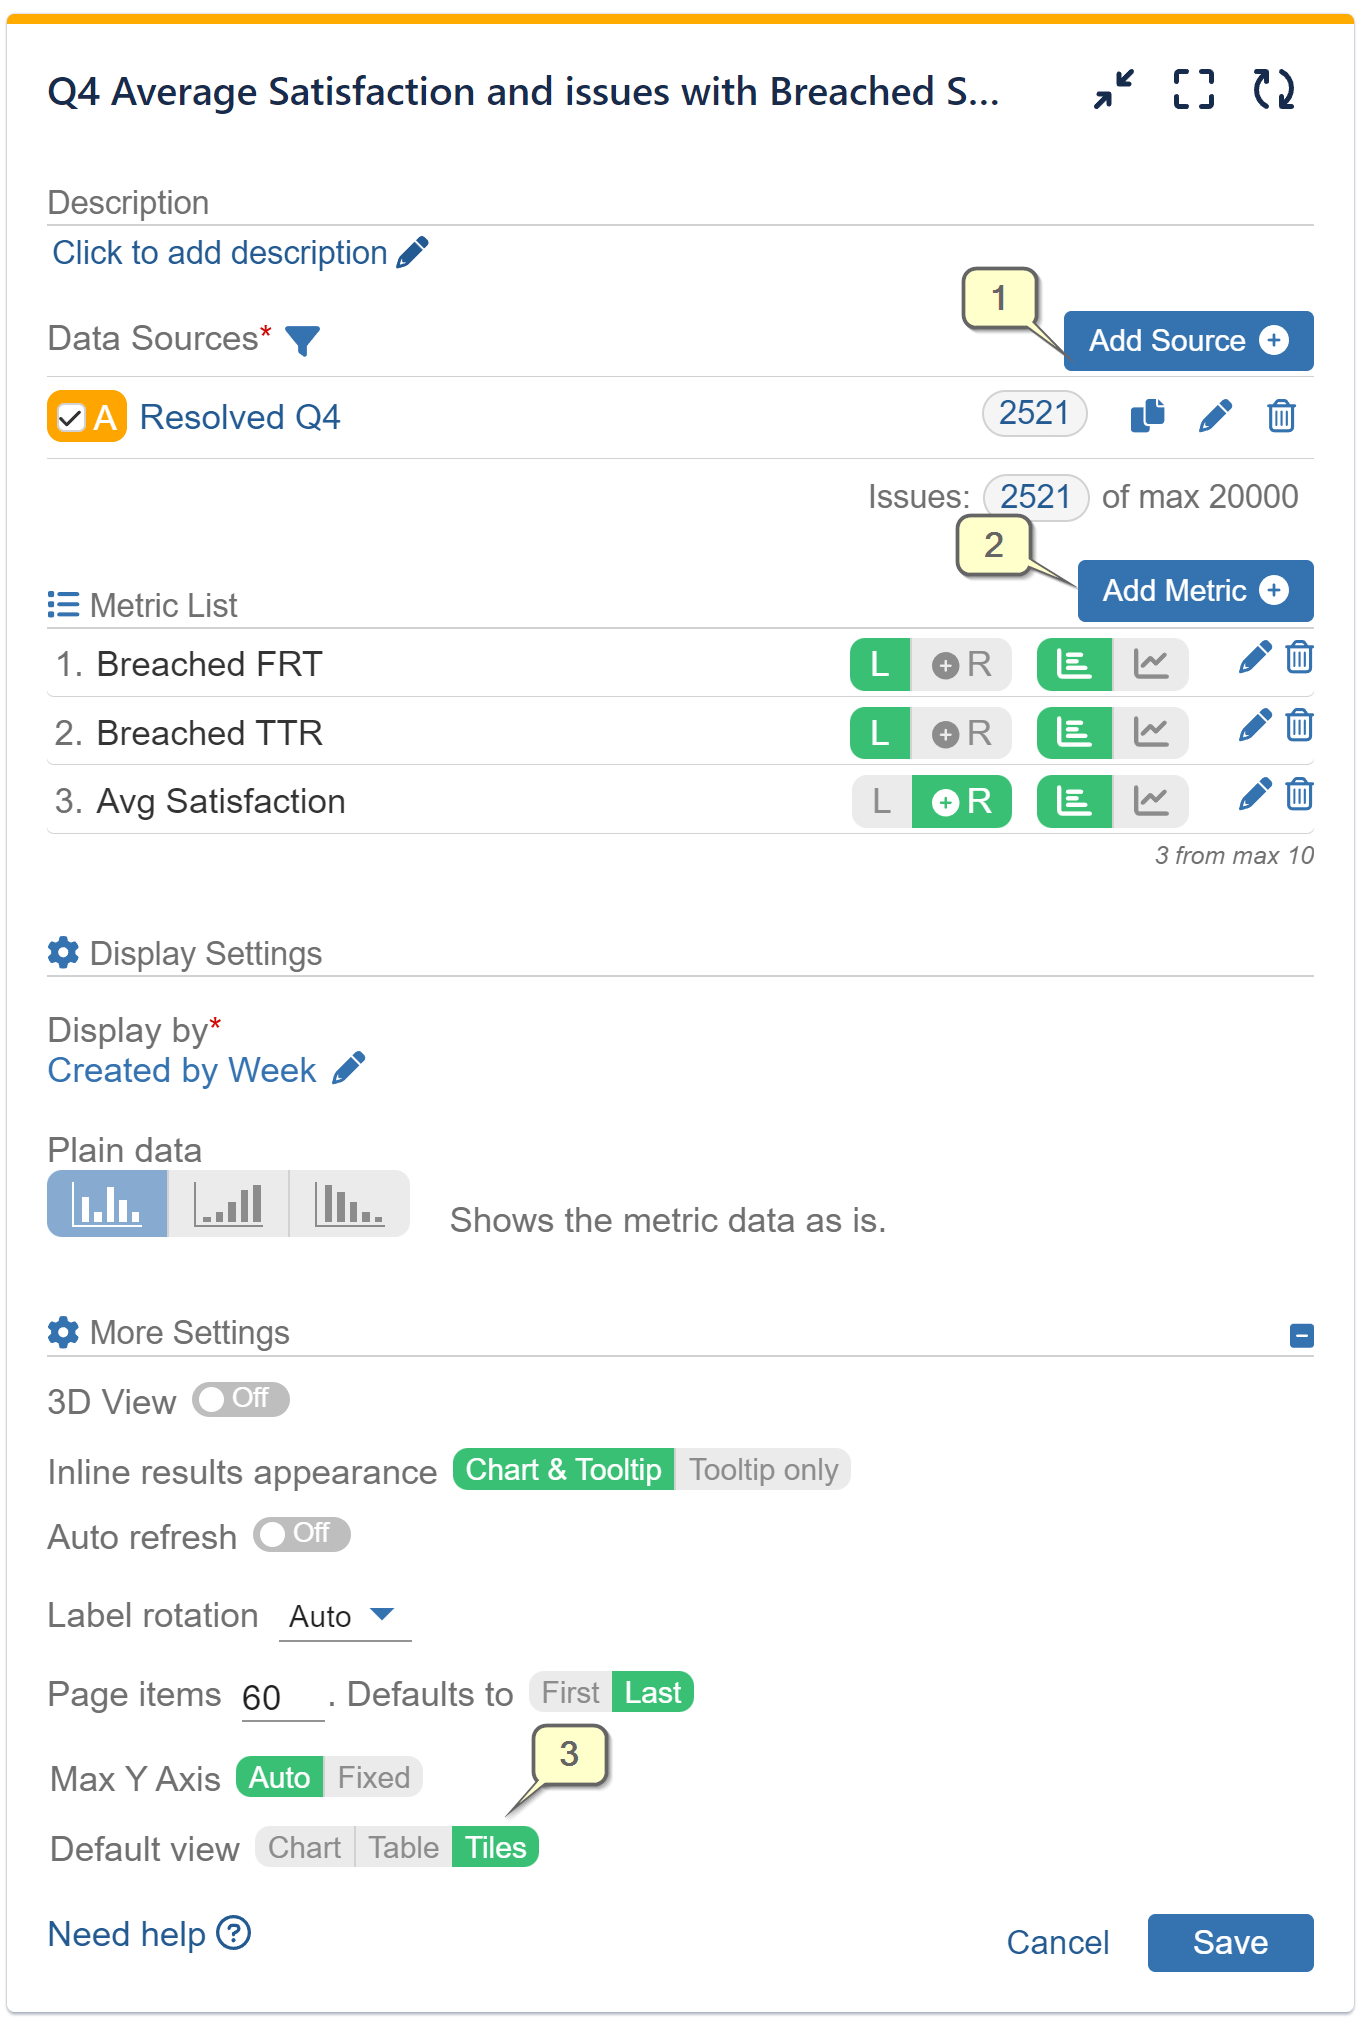
Step 1: Define your Data Source.
Step 2: Add three Conditional Metrics with the details and expressions given below.
Step 3: Within the “More Settings” section, navigate to Default View option and select Tiles.
Discover more of our app’s capabilities by referring to our comprehensive User Guide. Explore our KPI examples section to find inspiration for creating insightful Jira reports.
Start your 30 days free trial of Performance Objectives: Charts for Jira from Atlassian Marketplace.