Table of Contents
Unveiling the Watermelon Effect: What It Is, Why It Happens, and How to Address It
Have you heard of the Watermelon Effect in IT service management? It’s when everything looks great on the outside—green SLAs, good-looking dashboards—but underneath, there’s a hidden layer of red: unresolved issues, frustrated teams, and unhappy customers.
Just like a watermelon looks green on the outside but is red on the inside, the same occurs when service-level agreements (SLAs) and key performance indicators (KPIs) appear to be healthy on the surface, but in reality, underlying problems are bubbling up. On a dashboard, everything looks “green” with metrics being met, but customer satisfaction, internal team health, or deeper process issues are actually “red.”
This effect occurs because many organizations measure and report on high-level metrics that don’t offer a true picture of performance. For instance, teams may hit response or resolution times, but the quality of interactions or the complexity of certain issues might be neglected. Over-reliance on surface-level metrics (like SLAs) can create a false sense of achievement, leaving critical problems unaddressed.
The consequences of the Watermelon Effect can be severe, leading to unhappy customers, frustrated teams, and management blind spots. Teams may burn out trying to meet superficial targets without resolving core issues, which ultimately harms business outcomes. However, with the right metrics and reporting capabilities, managers can lift the veil on this effect, revealing the true performance of their teams. By leveraging customized reports in Jira dashboards using reporting tools like the Performance Objectives app, managers can track the right data and ensure that hidden problems are tackled. Below, we suggest some specific reports that can be easily created with the app to uncover if there is “red” in your project.
SLA Breaches & Low Satisfaction Tracker
This report gives visibility into critical red zones that can be masked by otherwise strong performance indicators, making it a valuable tool for managers looking to uncover the true performance of their service teams. Combining breaches with very low customer satisfaction (score of 1) helps surface tickets where the customer experience was likely poor, regardless of whether the team met response/resolution times. For this report, we used the Multi Metric Combined gadget in Tiles view, which provides a clear overview of the total number of issues, along with a percentage change indicator and a sparkline to visualize trends over time. As long as you see a downward trend, you may be in a safer position.

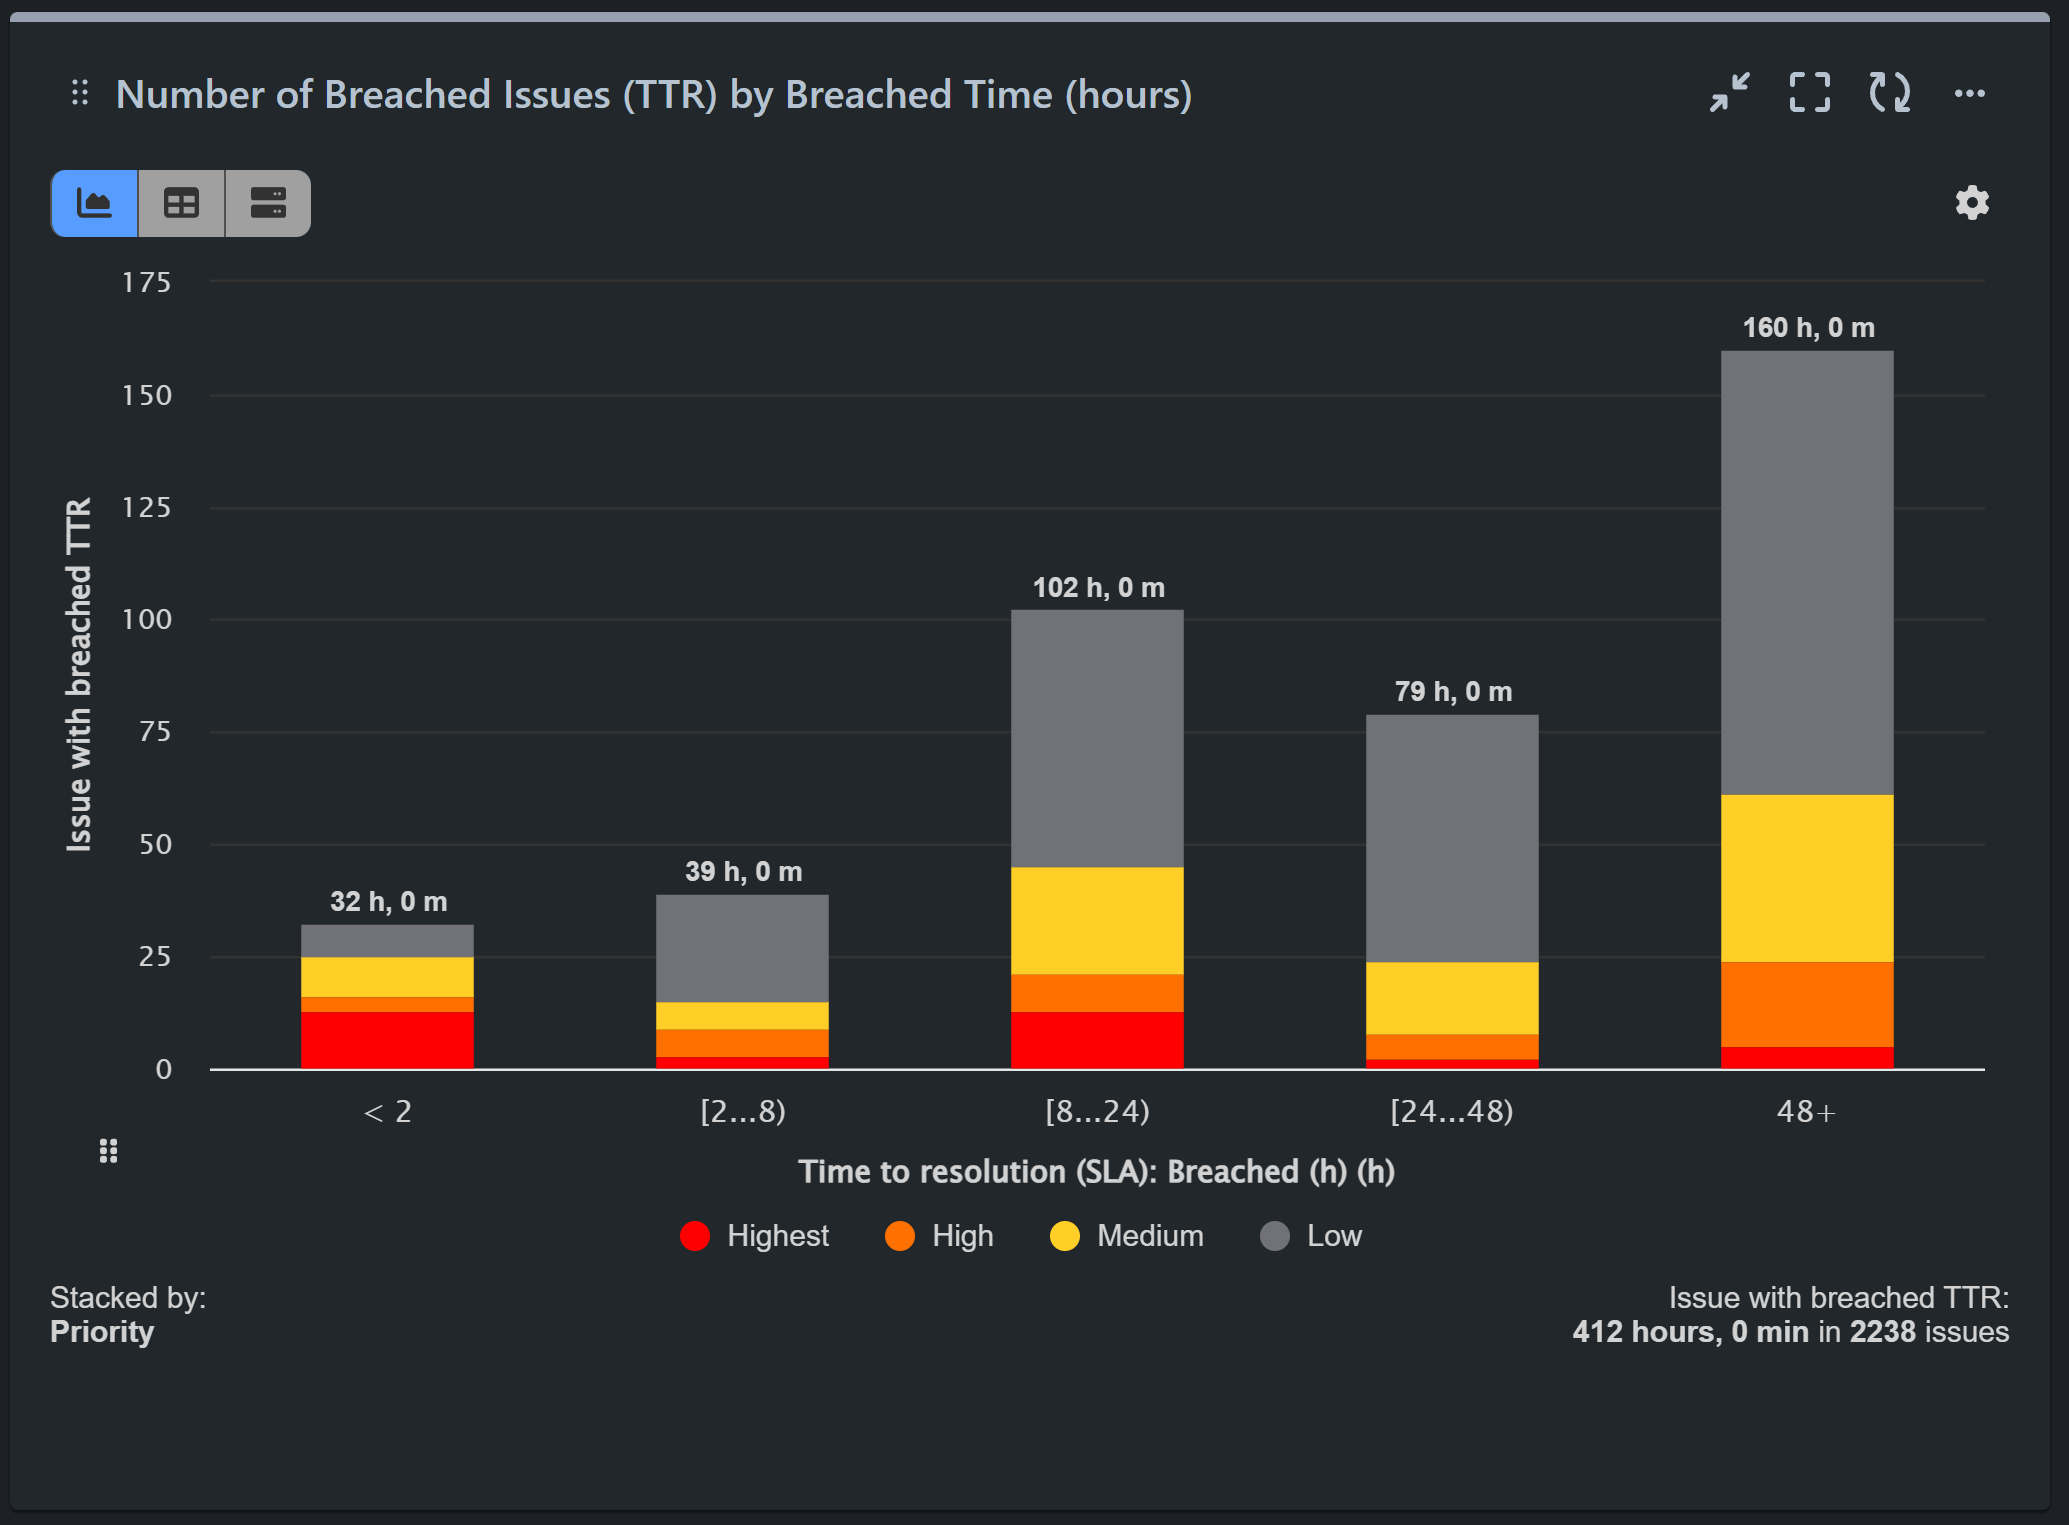
Breached Issues by Breach Time
After identifying the breached SLA issues in the initial report, the next step is to determine the extent to which these issues exceeded acceptable time limits. This “Breached issues by Breach Time” report, utilizing custom metric distribution slots and stacked by priority, allows you to examine the extent of each SLA metric breach. By focusing on the breaches with the longest durations and highest priority, you can pinpoint where the most significant delays and quality concerns lie. This granular view helps in understanding the severity and impact of issues, guiding targeted actions to address the most critical service gaps and combat the Watermelon Effect in your project.

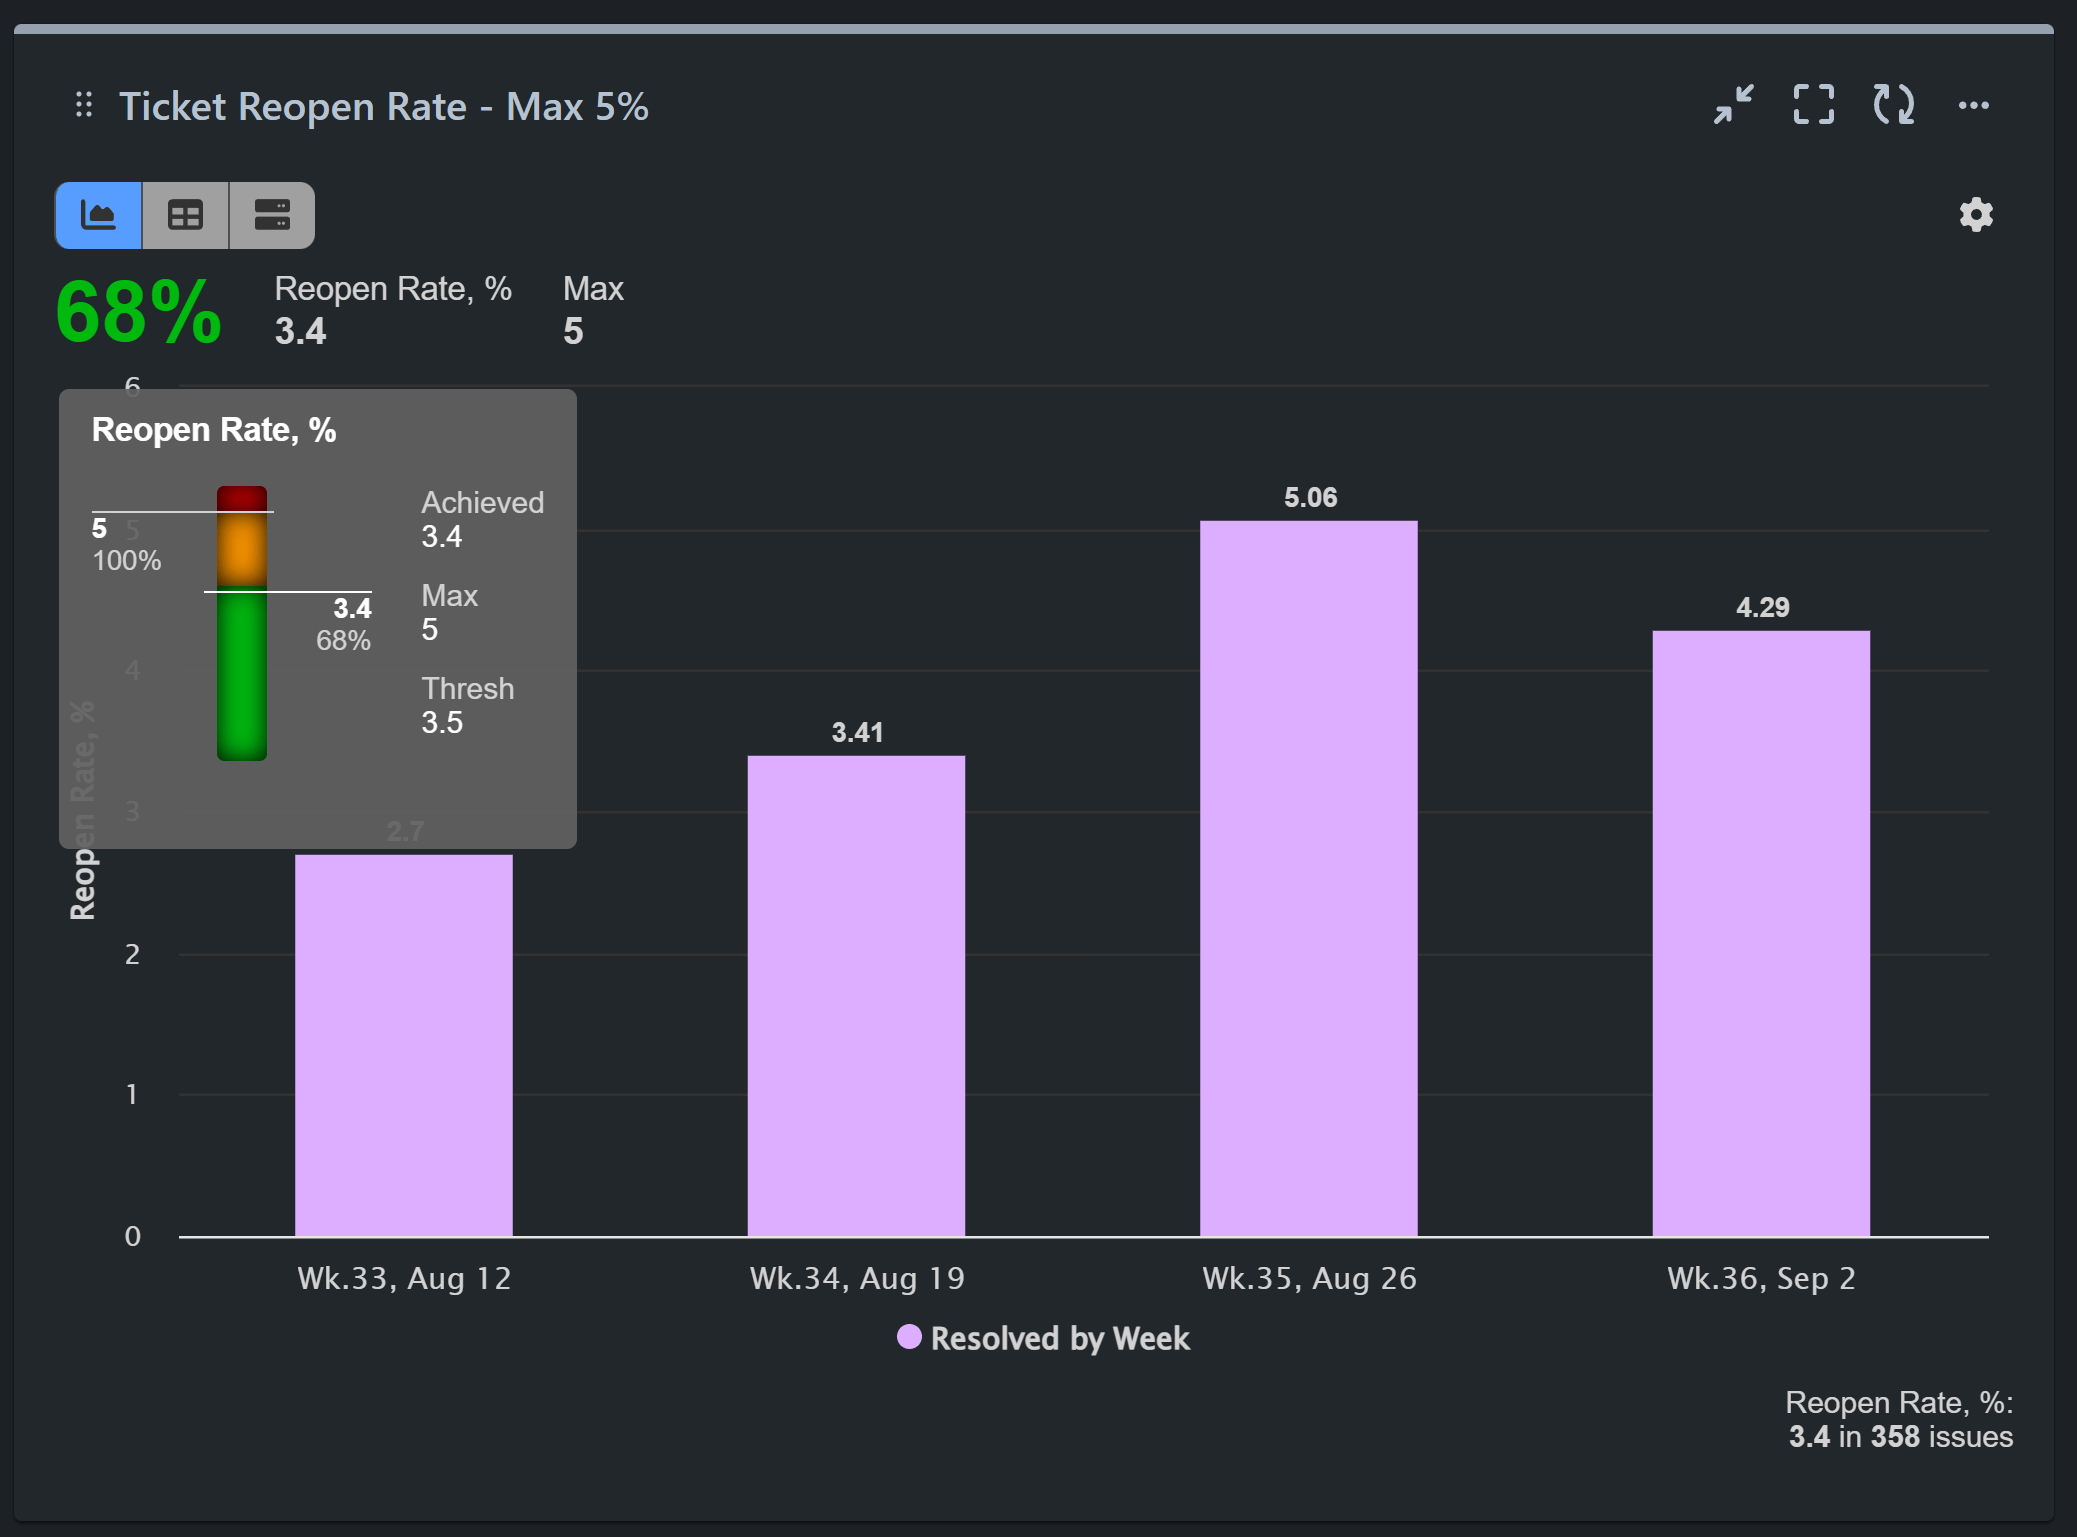
Maximum Reopen Rate
Building on insights from the “Breached SLA Issues by Breach Time” report, the next report focuses on the “Max 5% Reopen Rate”. This report calculates the percentage of issues reopened after being marked as resolved, setting a target of a maximum 5% being reopen. By evaluating the number of reopened issues, this report highlights potential compromises in service quality and areas where initial resolutions may not have fully addressed customer needs, with SLA compliance possibly being the primary motivator. A higher reopen rate suggests that there may be recurring issues or inadequacies in how problems are resolved, posing a risk of customer dissatisfaction and further impacting overall service effectiveness.

Conclusion
If you’re not tracking the right metrics and gaining valuable insights in Jira Service Management, the Watermelon Effect can become a silent killer of team productivity and user satisfaction. With the Performance Objectives app, you can uncover these hidden red zones and proactively address them. This not only helps teams improve performance but also ensures customer satisfaction, team well-being, and alignment with long-term business goals.
Discover a wide range of SLA and XLA reports for Jira in our KPI library.
Start your 30 days free trial of Performance Objectives: Charts for Jira from Atlassian Marketplace.