Table of Contents
Elevate Your Service Management Project Reporting with XLA Reports in JSM
In today’s fast-paced business environment, maintaining high standards in service management is crucial. As organizations strive to deliver exceptional customer experiences, it’s essential to go beyond traditional Service Level Agreements (SLAs) and embrace Еxperience Level Agreements (XLAs). XLAs focus on the quality of the customer experience, providing a more comprehensive measure of service effectiveness. In this blog, we will introduce the concept of XLAs and showcase a series of reports you can configure in Jira Service Management (JSM) using the Performance Objectives app.
Understanding XLAs
Unlike SLAs, which primarily measure the timeliness of service delivery, XLAs emphasize the overall experience and satisfaction of the end-users. This shift in focus enables organizations to align their service delivery with customer expectations and business outcomes, ultimately leading to higher customer satisfaction and loyalty. Even if you do not use traditional questionnaires or forms to gather customer feedback, you can still configure XLA reports with valuable experience indicators derived from your Jira data using the Performance Objectives app, all without leaving the platform. This approach allows you to measure and improve customer experience based on real-time metrics and interactions, providing deeper insights into your service performance.
7 XLA Reports for Jira Service Management
Below, we present some of the key reports you can configure using our app, along with their benefits:
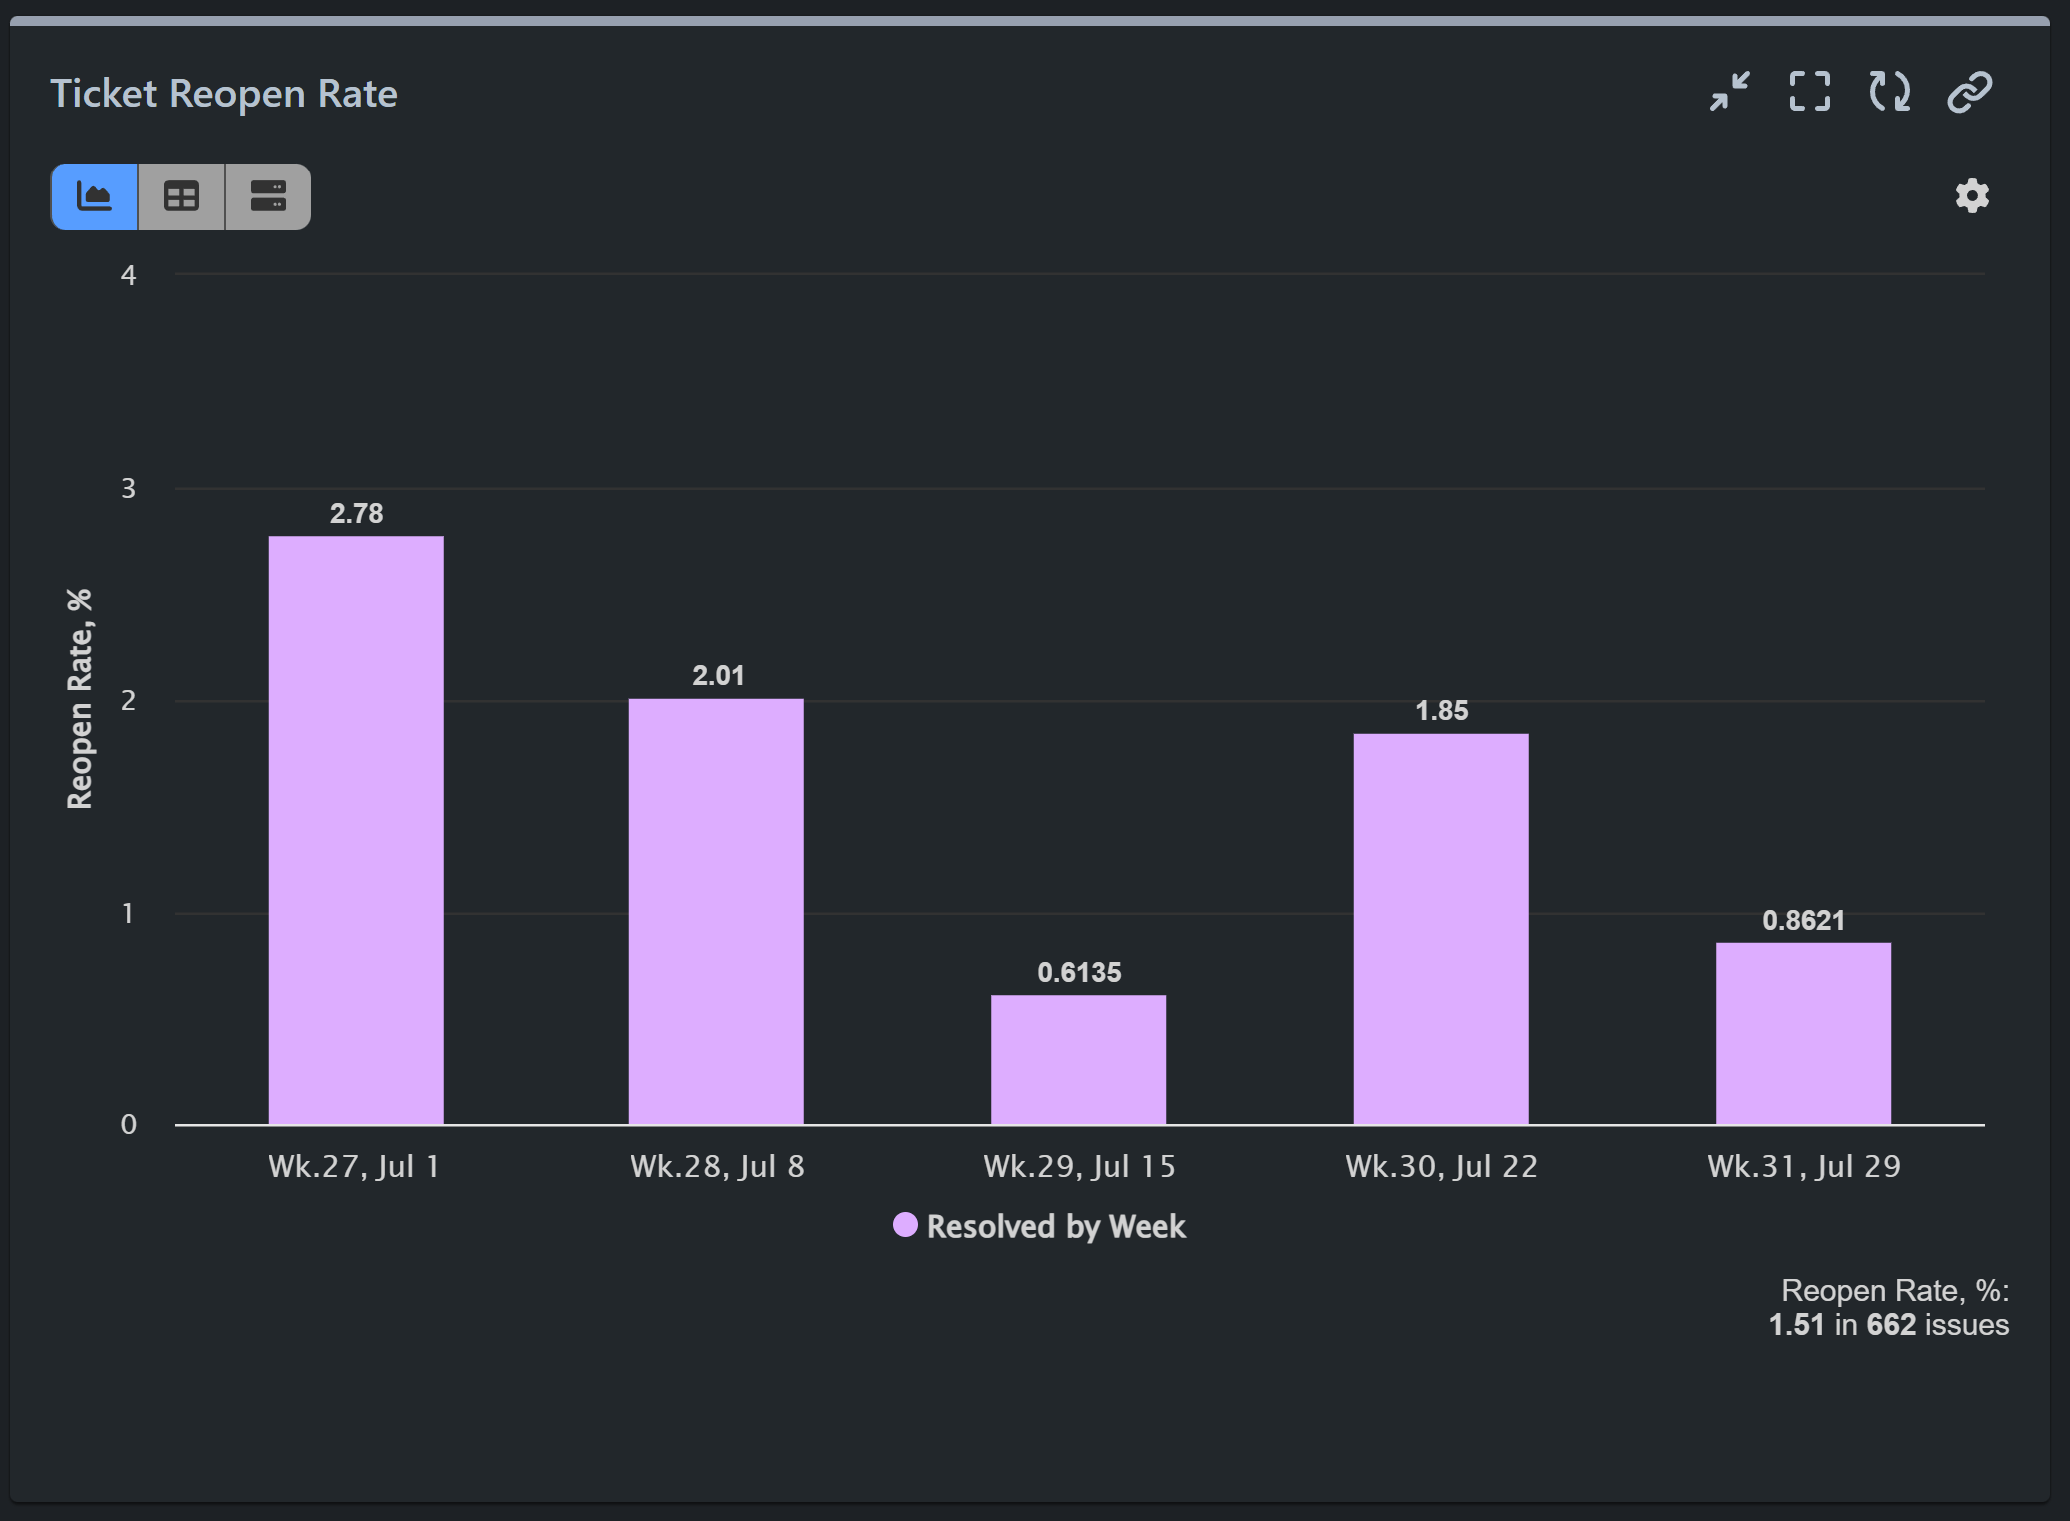
Ticket Reopen Rate (RR) Report
This report displays the percentage of resolved tickets that have been reopened by customers. Monitoring this metric is crucial for support teams, as it offers valuable insights into the effectiveness of their service.
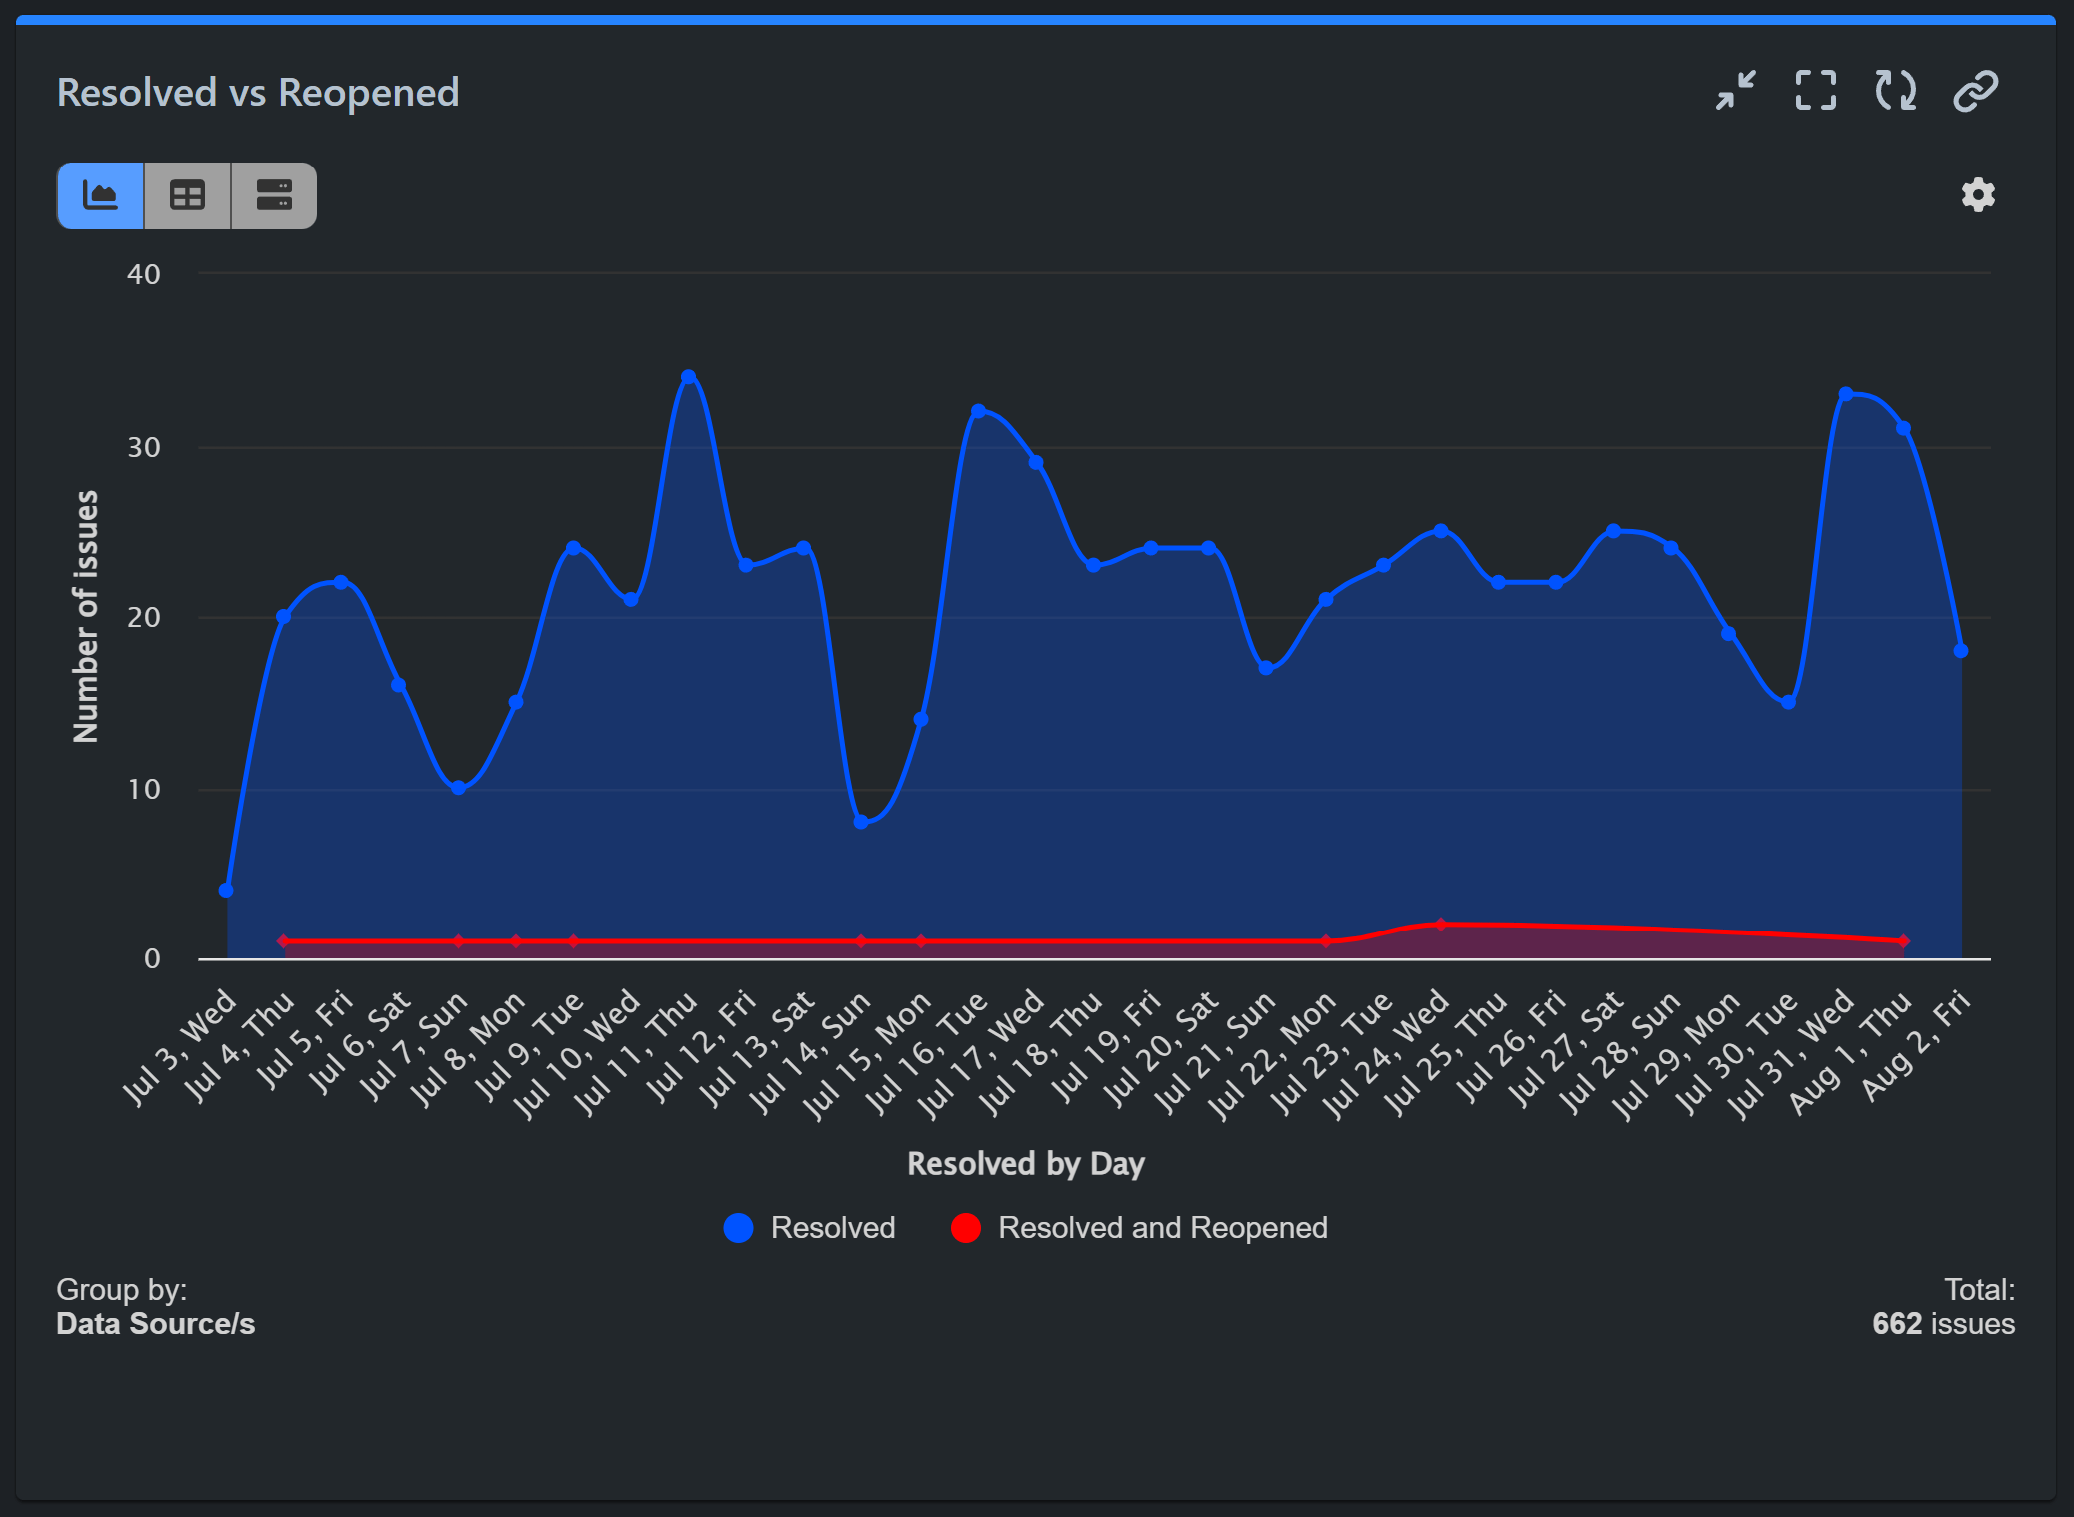
Resolved vs Reopened
This report compares the number of resolved tickets against those that have been resolved, but reopened. It helps you identify recurring issues and areas where initial resolutions may not be fully effective, enabling you to take corrective actions and improve resolution quality.
You can create a Resolved vs. Reopened report using Jira Service Management’s native reporting features. Alternatively, the Performance Objectives app offers advanced capabilities for creating this report directly on your dashboard, including extensive data segmentation flexibility and a variety of visualizations for a more comprehensive and customizable analysis.
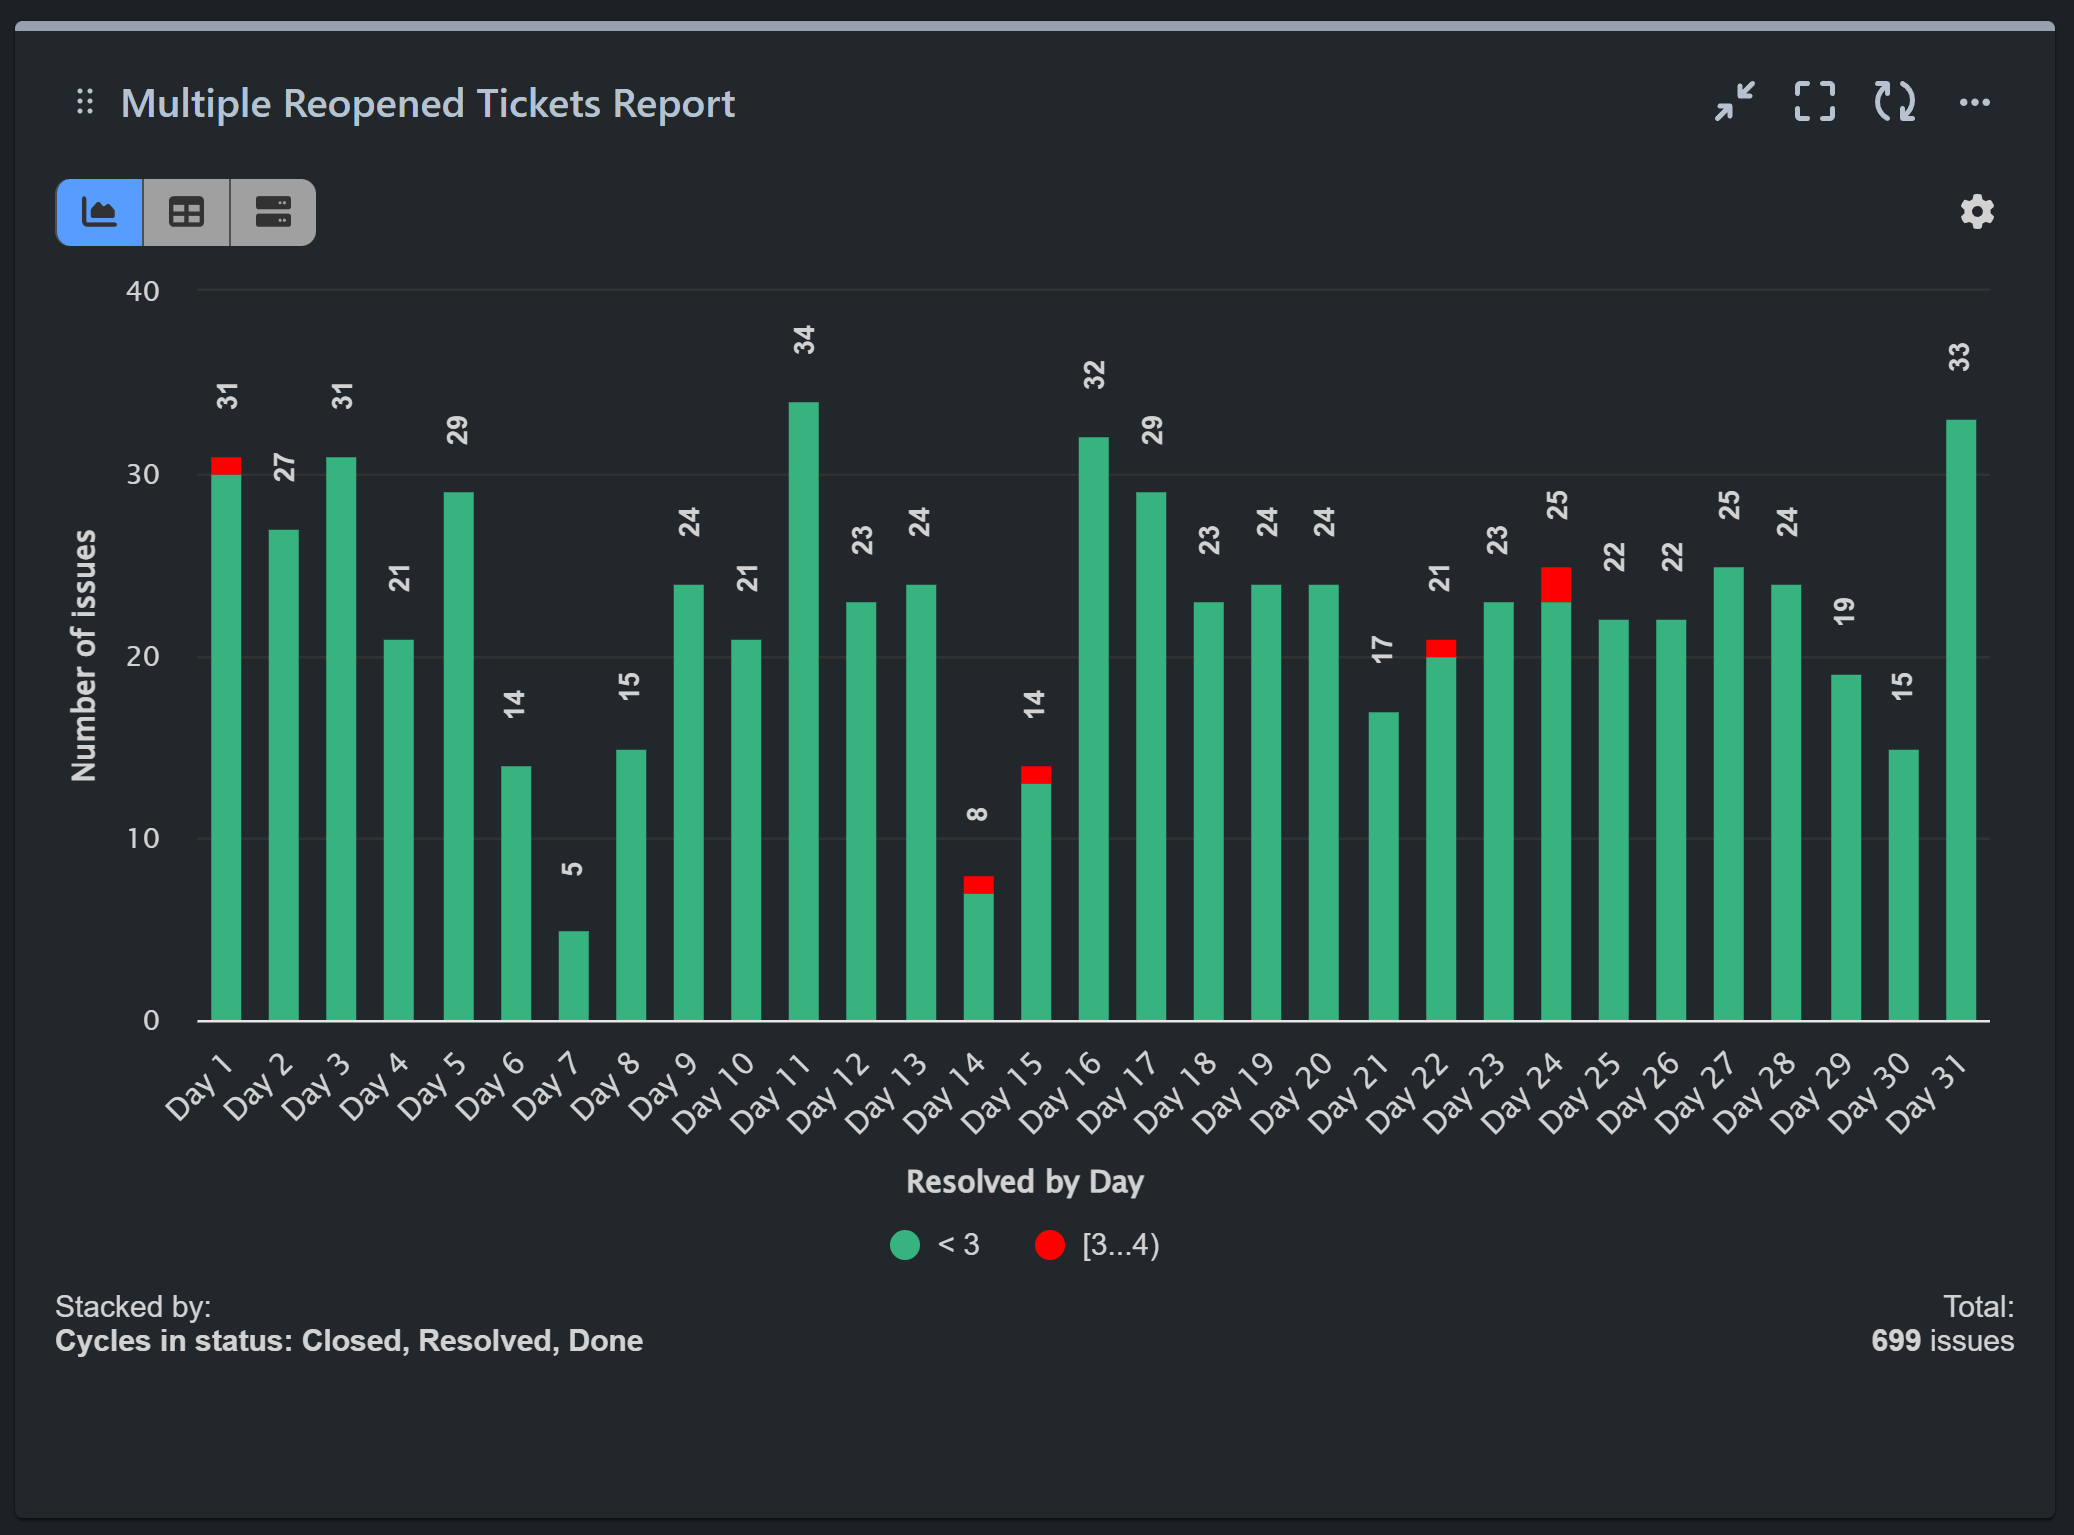
Multiple Reopened Tickets Report
This report tracks issues that have been reopened multiple times after initial resolution, indicating persistent problems that require attention. Addressing these issues can lead to more stable and reliable service delivery. For this report, we are using the ‘Cycles in Status’ metric and all statuses indicating resolved/closed state.
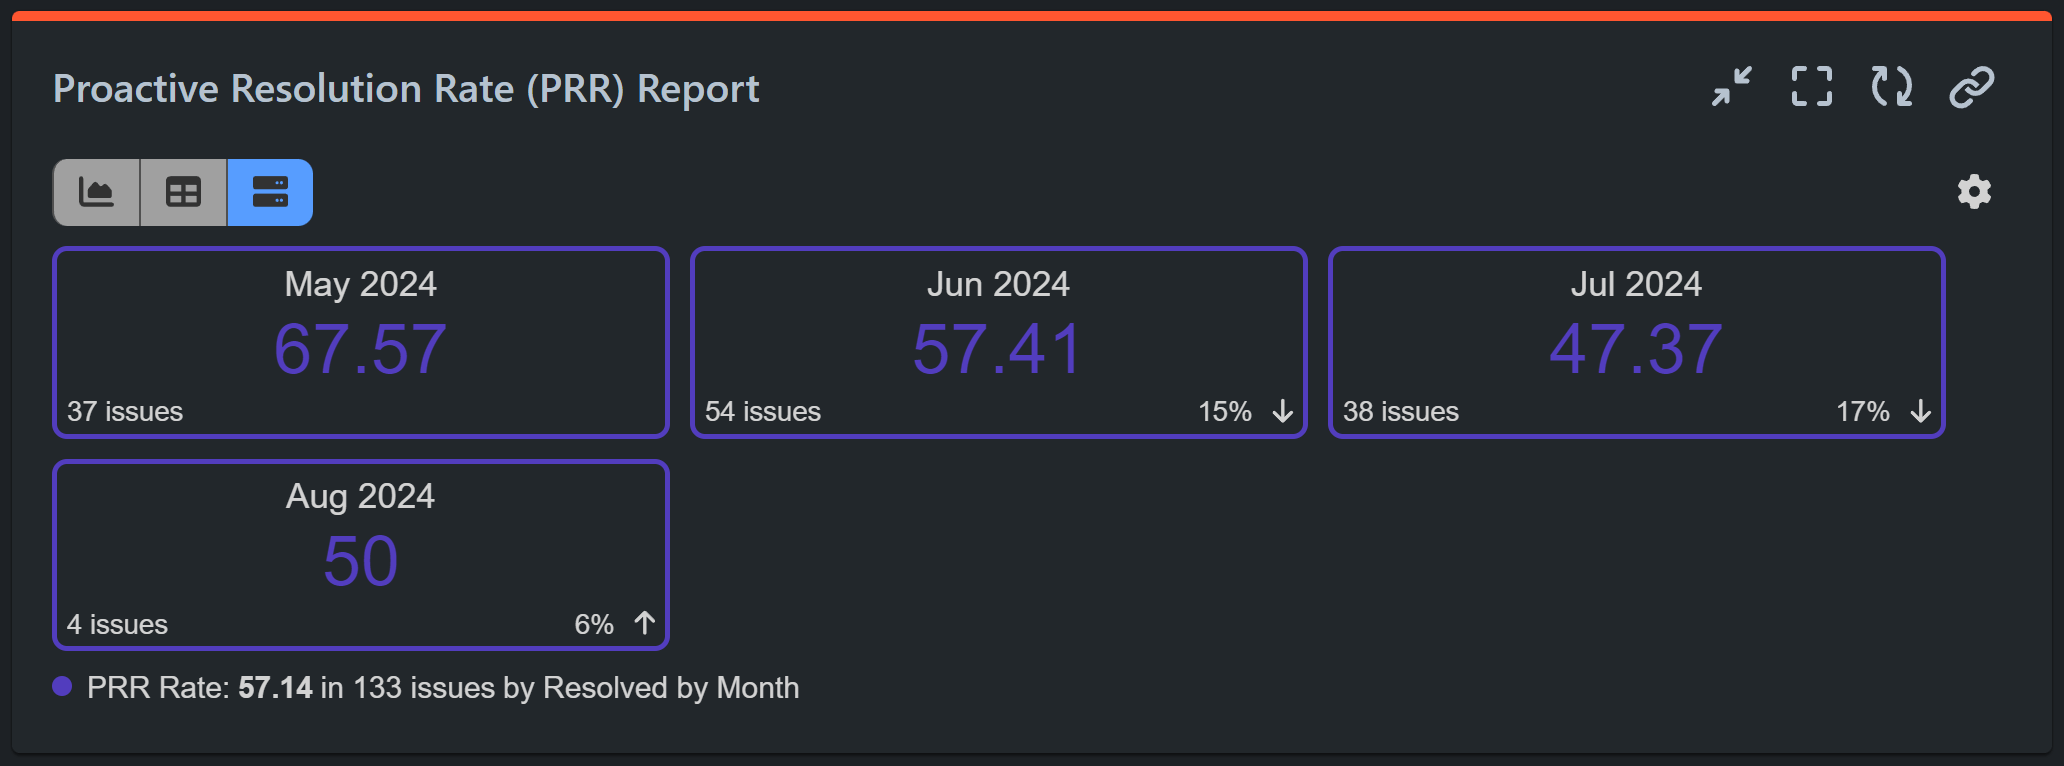
Proactive Resolution Rate (PRR) Report
For instance, if your Customer Support team notices a problem with your service or product and reports it to the development team for resolution before any end-user raises the issue, this proactive approach may prevent potential disruptions to service or product performance and enhance customer satisfaction.
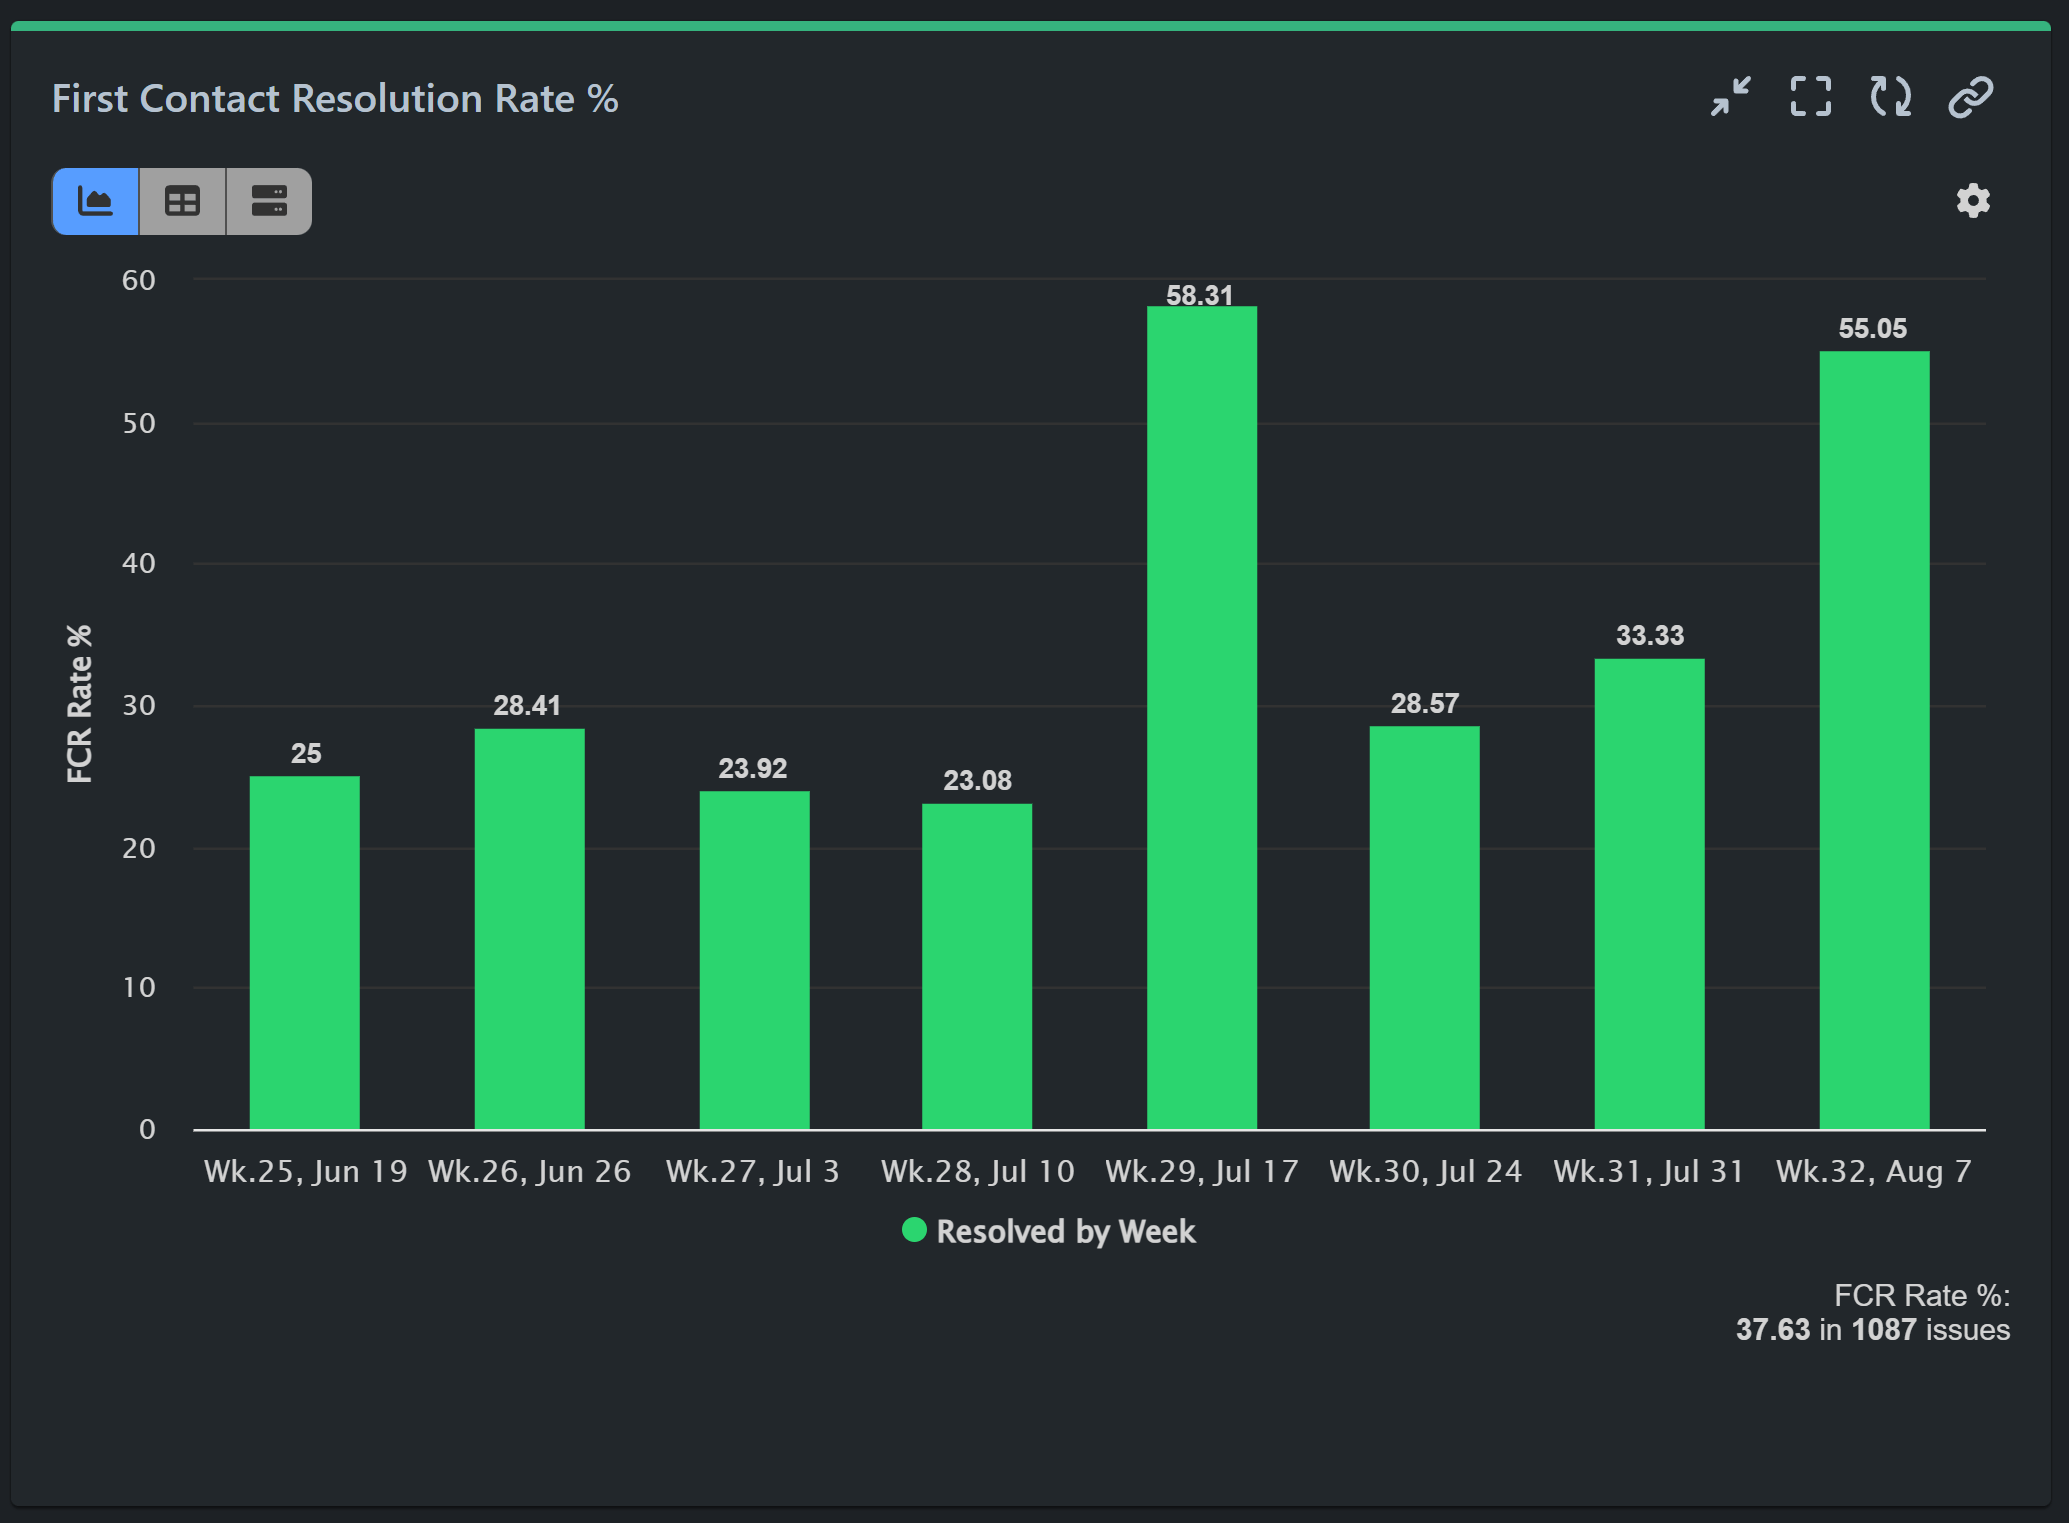
First Contact Resolution Rate %
This report measures the percentage of issues resolved during the first interaction with the customer. High first contact resolution rates indicate efficient problem-solving and a better customer experience.
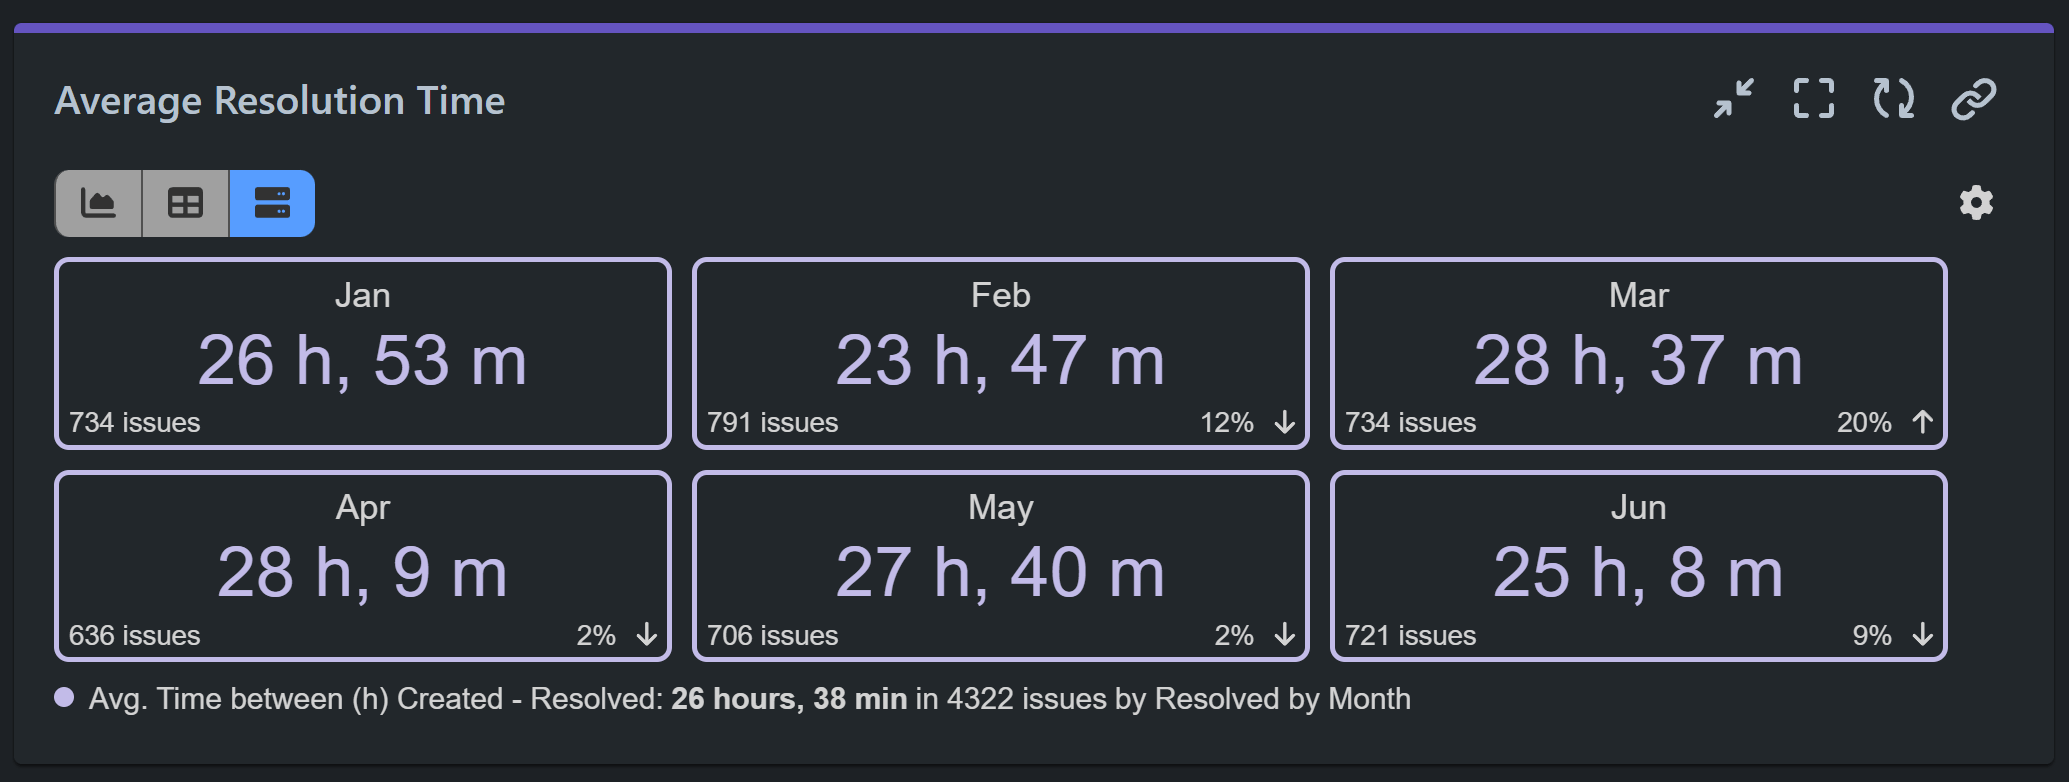
Average Resolution Time
This report provides insights into the average time taken to resolve issues. By monitoring this metric, you can identify bottlenecks in your processes and implement strategies to speed up resolution times.
Use the Resolution Time gadget by Atlassian to create a bar chart of the average resolution time (in days) of resolved issues, or the Performance Objectives gadget to benefit from its versatile customization features.
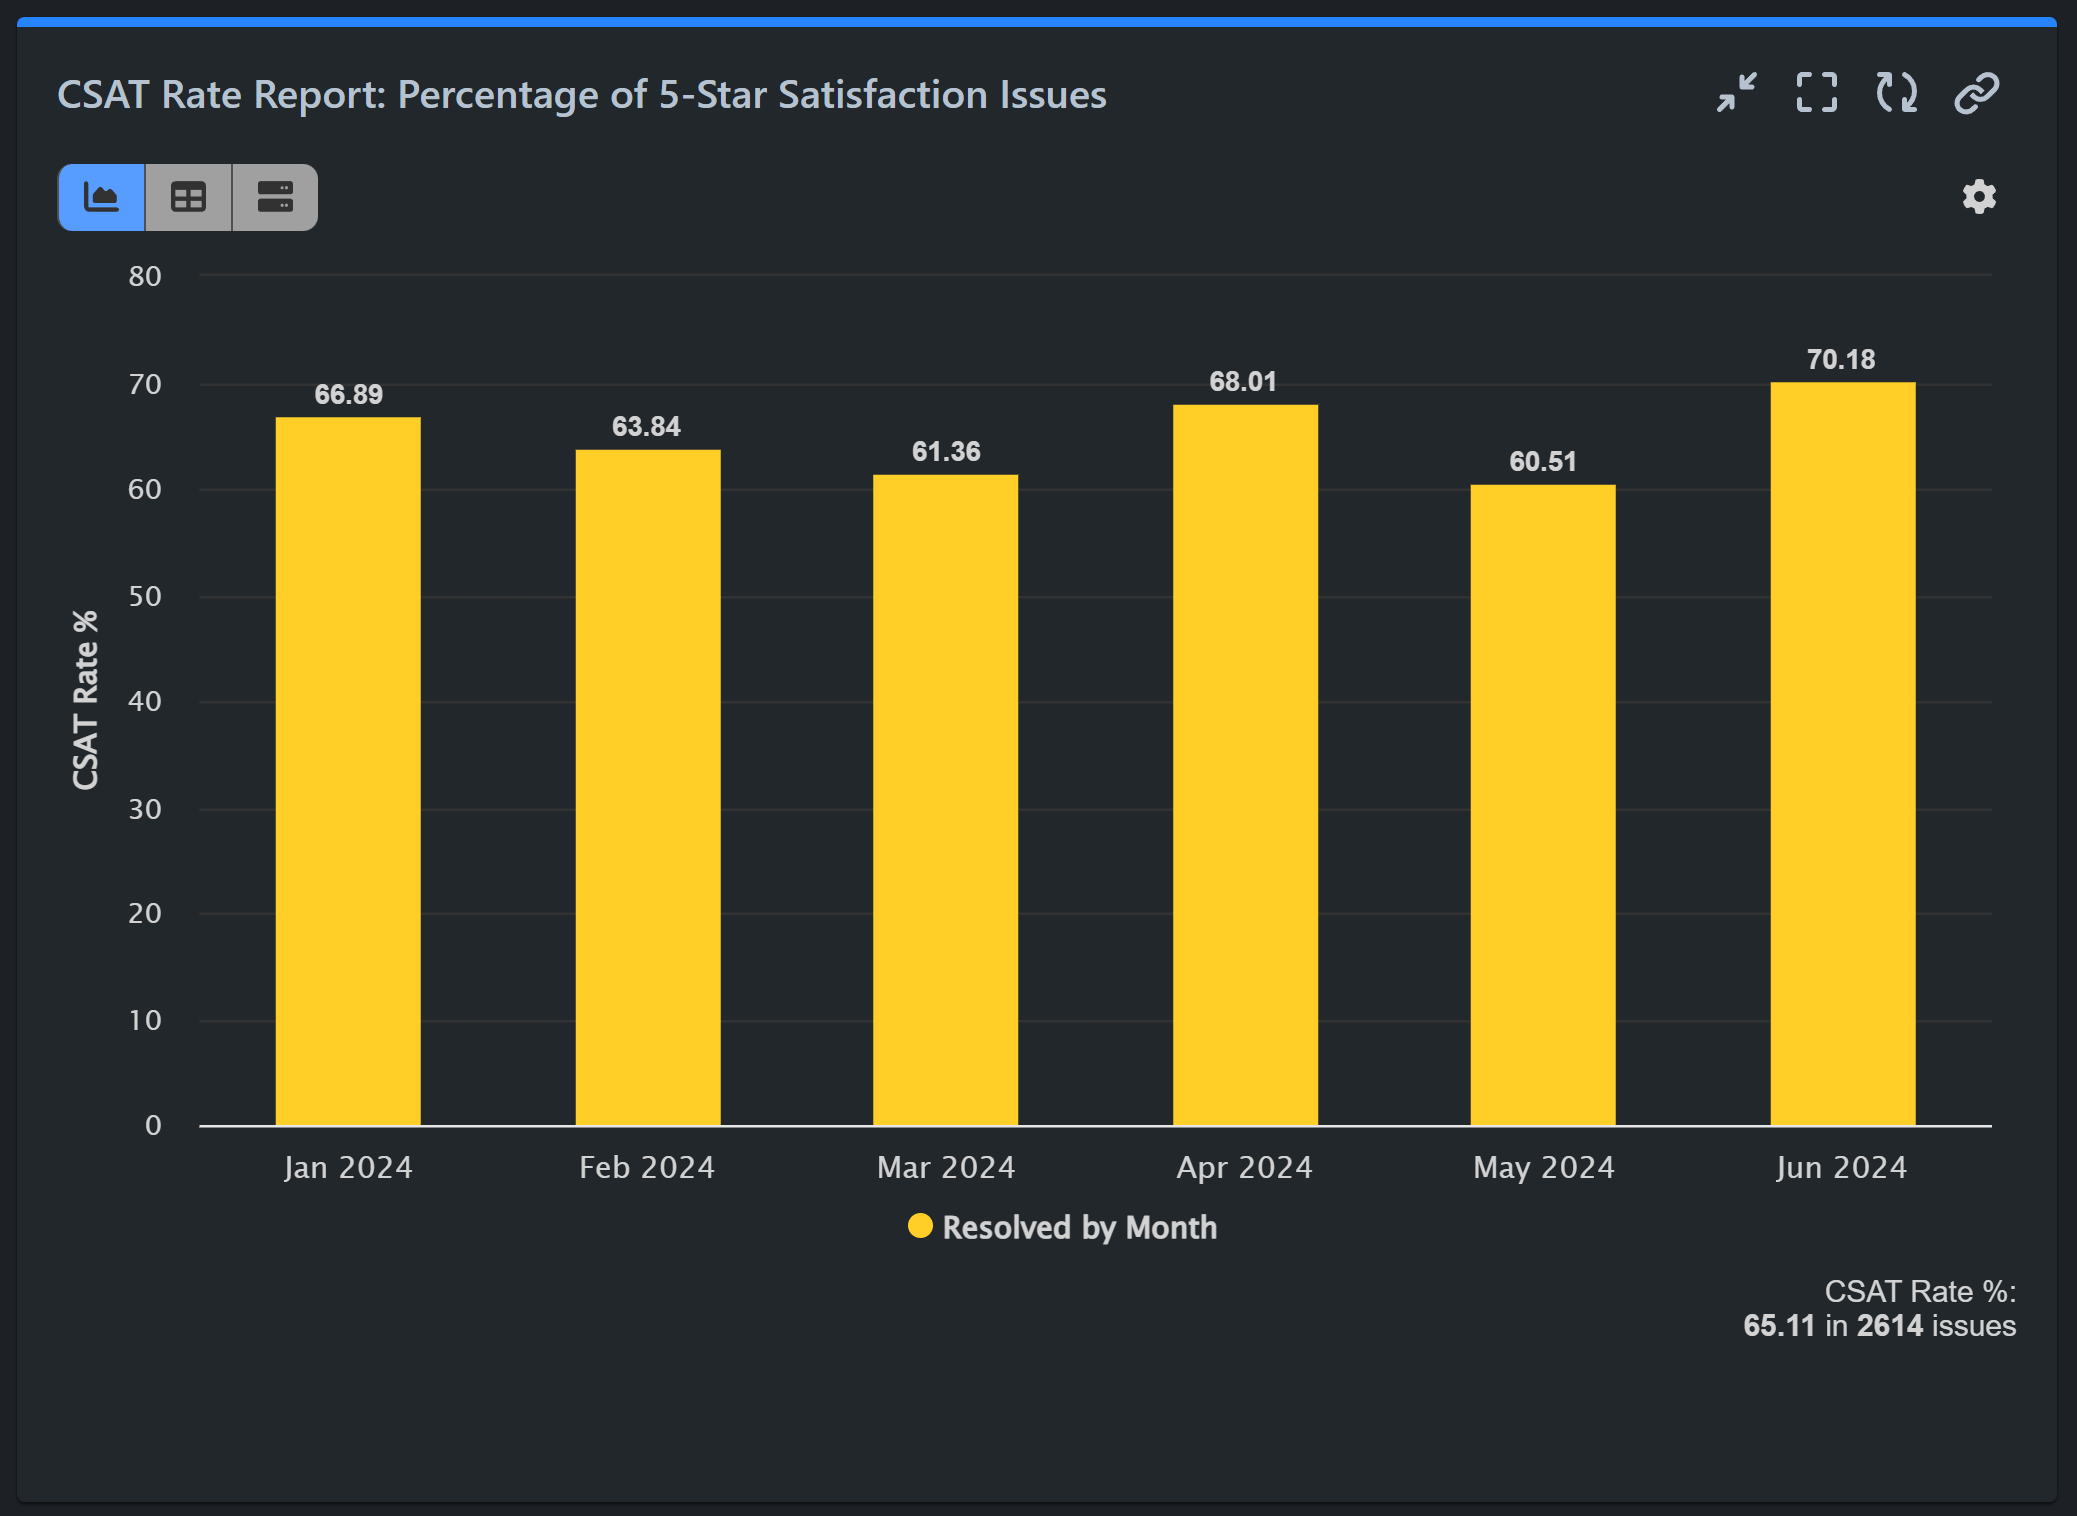
CSAT Rate Report: Percentage of 5-Star Satisfaction Issues
Customer satisfaction (CSAT) is a critical measure of service quality. This report shows the percentage of issues that received a 5-star rating, helping you gauge customer satisfaction and identify areas for improvement.
Conclusion
By integrating these XLA reports into your Jira Service Management dashboard, you can gain valuable insights into your service performance and customer experience. Our Performance Objectives app makes it easy to configure and customize these reports to fit your specific needs.
Check our User Guide to explore the app’s features or read the KPI examples for inspiration on insightful reports for your Jira dashboard.
Start your 30 days free trial of Performance Objectives: Charts for Jira from Atlassian Marketplace.